. 2023 Dec 14;14(1):8332.
doi: 10.1038/s41467-023-43903-x.

Maternal antibiotic exposure enhances ILC2 activation in neonates via downregulation of IFN1 signaling

Affiliations

Maternal antibiotic exposure enhances ILC2 activation in neonates via downregulation of IFN1 signaling

Haixu Xu et al. Nat Commun. .

Abstract

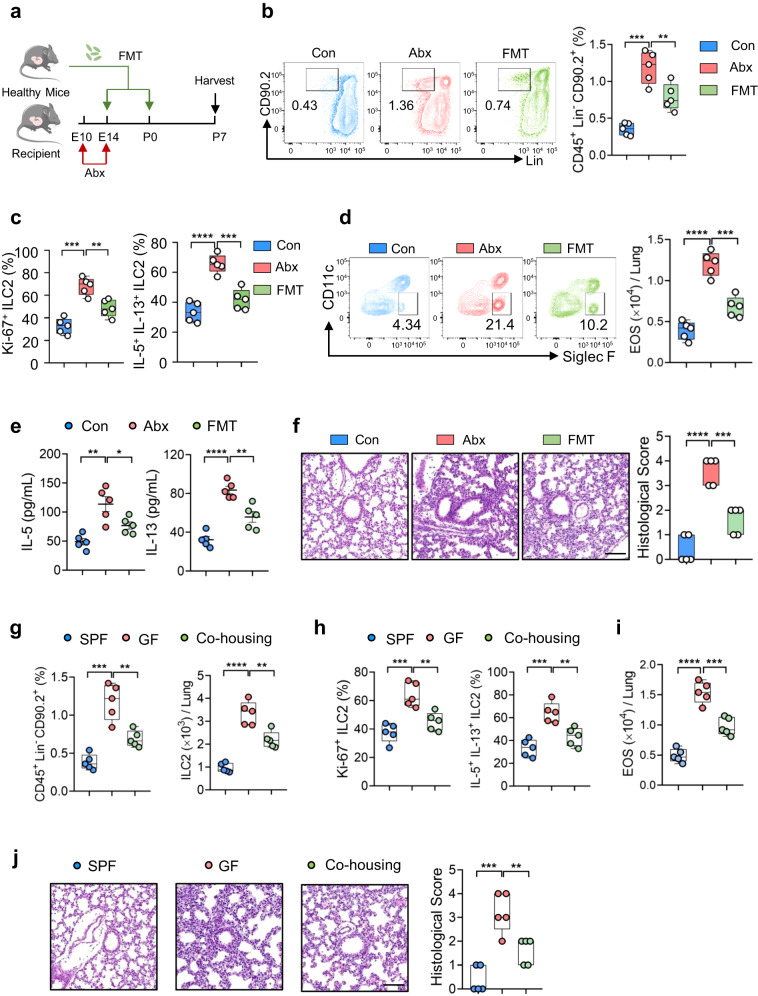
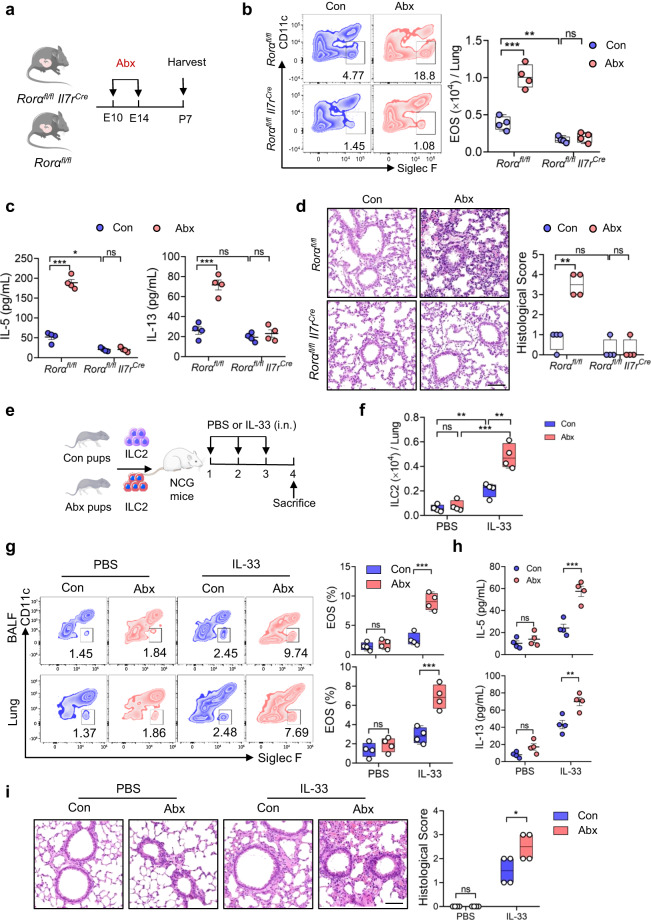
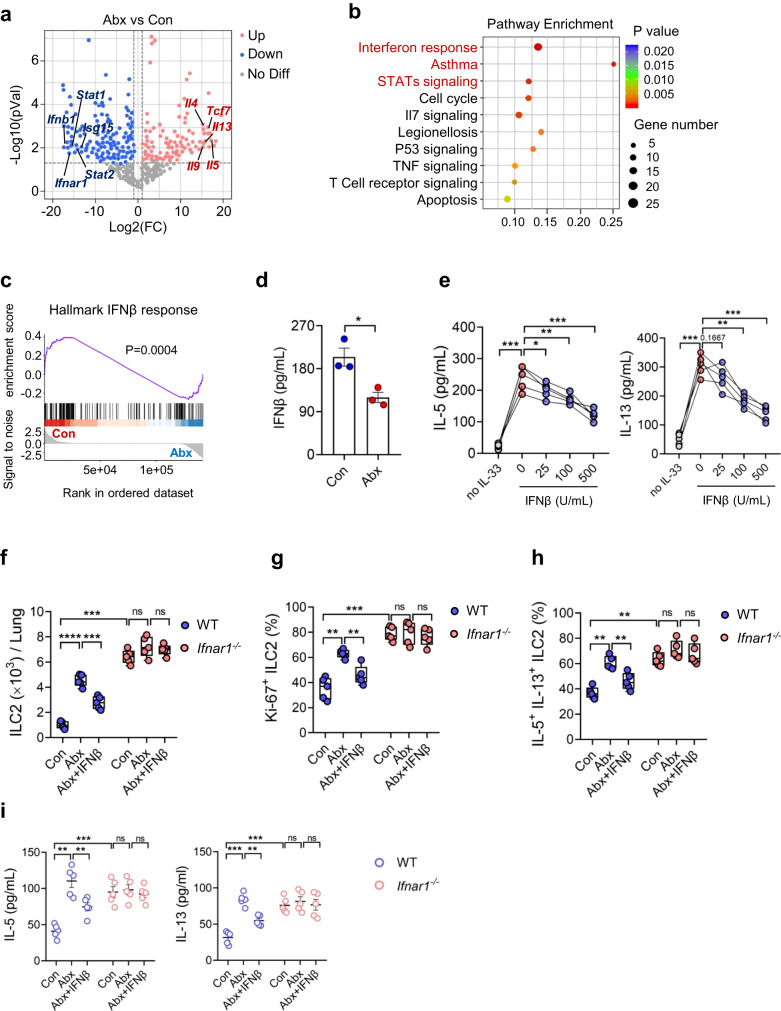
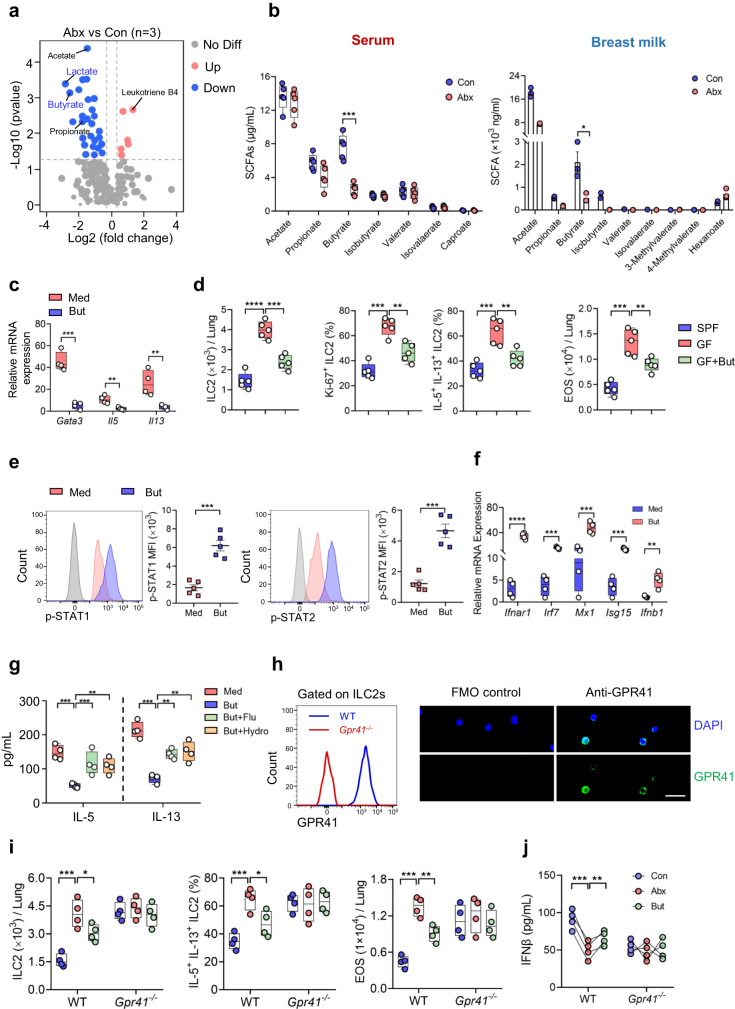
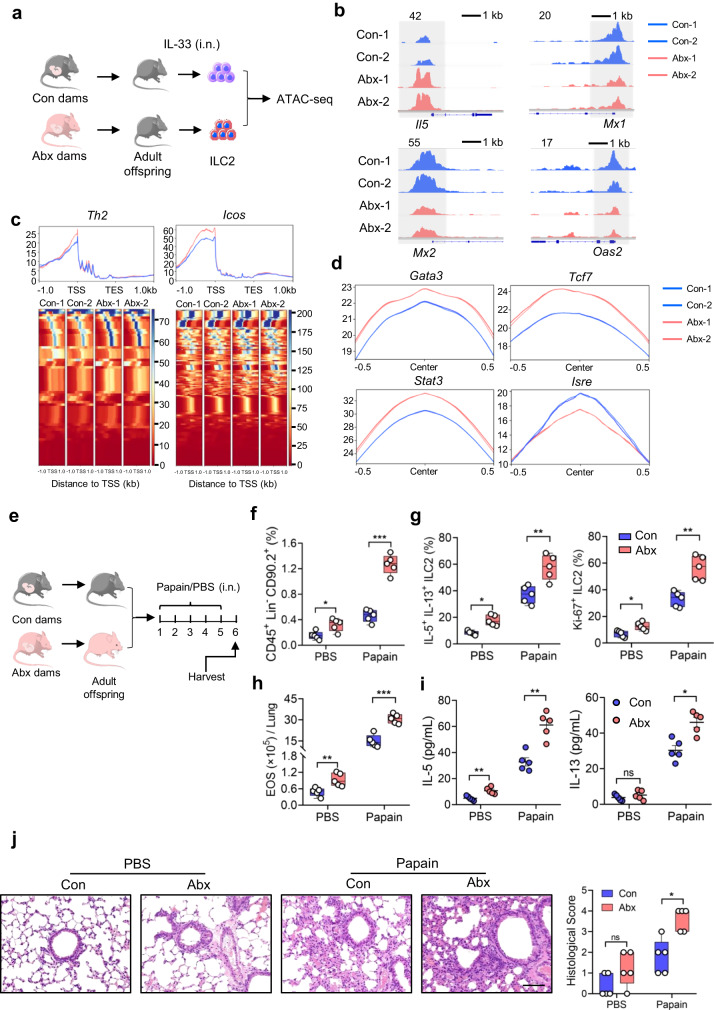
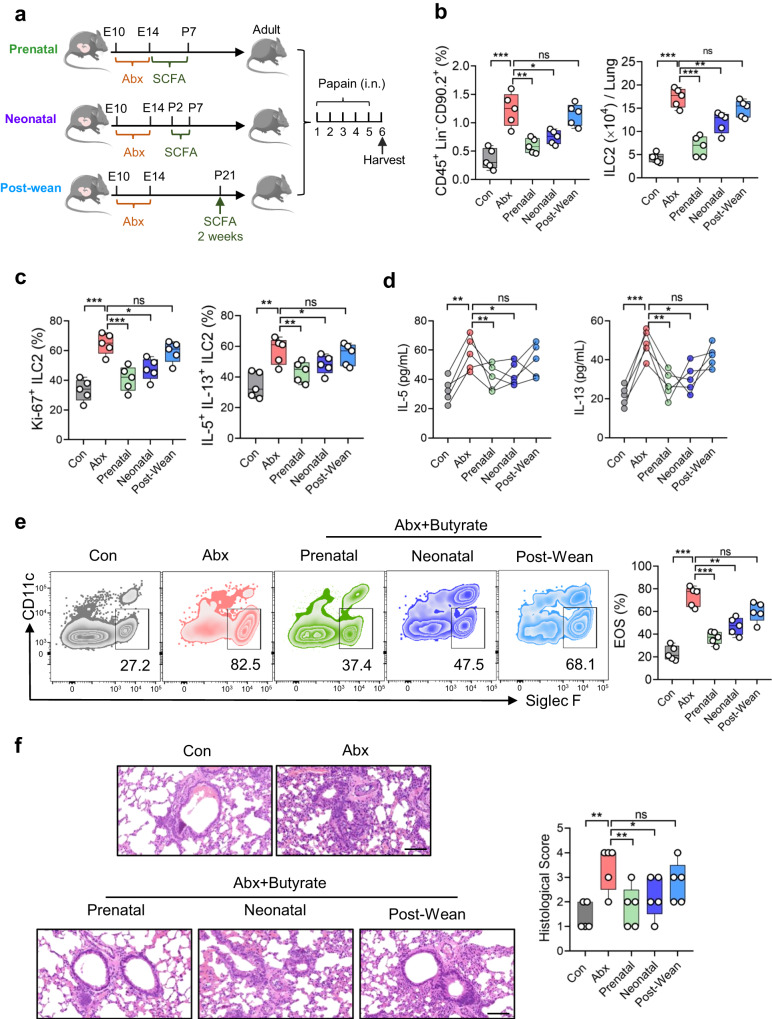
Microbiota have an important function in shaping and priming neonatal immunity, although the cellular and molecular mechanisms underlying these effects remain obscure. Here we report that prenatal antibiotic exposure causes significant elevation of group 2 innate lymphoid cells (ILC2s) in neonatal lungs, in both cell numbers and functionality. Downregulation of type 1 interferon signaling in ILC2s due to diminished production of microbiota-derived butyrate represents the underlying mechanism. Mice lacking butyrate receptor GPR41 (Gpr41-/-) or type 1 interferon receptor IFNAR1 (Ifnar1-/-) recapitulate the phenotype of neonatal ILC2s upon maternal antibiotic exposure. Furthermore, prenatal antibiotic exposure induces epigenetic changes in ILC2s and has a long-lasting deteriorative effect on allergic airway inflammation in adult offspring. Prenatal supplementation of butyrate ameliorates airway inflammation in adult mice born to antibiotic-exposed dams. These observations demonstrate an essential role for the microbiota in the control of type 2 innate immunity at the neonatal stage, which suggests a therapeutic window for treating asthma in early life.


Conflict of interest statement

The authors declare no competing interests.

Figures

Fig. 1
Fig. 1. Prenatal antibiotic exposure enhances ILC2 responses in neonates.
a Illustration of experimental model: pregnant mice (n = 5) were given an antibiotic cocktail (Abx) during day 10 to 14 of gestation stage. Fecal contents pooled from control dams were transplanted into Abx-treated pregnant dams by a single oral gavage until delivery (E14 - P0), and pups were sacrificed at postnatal day 7 (P7). The phenotype of ILC2s in lungs and allergic airway inflammation were evaluated (bf). b Flow cytometric analysis of lung ILC2s (CD45+Lin-CD90.2+CD25+GATA3+) from the neonates. Lin-CD90.2+ gating is shown. c Flow cytometric analysis of the proliferation (left) and effector cytokine production (right) of ILC2s. d Frequencies and absolute numbers of eosinophils (CD45+CD11cSiglec F+) in lungs were analyzed by flow cytometry. e The amounts of IL-5 and IL-13 in lung homogenates were measured by ELISA. f H&E staining of lung tissues (bar, 100 µm), and the histological scoring. gj Wild-type SPF male mice were co-housed with GF females, and their offspring were sacrificed at P7. The phenotype of ILC2s and allergic inflammation in lungs were evaluated. g Flow cytometric analysis of the proportions and absolute numbers of lung ILC2s. h Flow cytometric analysis of the frequencies of proliferative ILC2s (Ki-67+) and cytokine-producing ILC2s (IL-5+ IL-13+) in lungs. i Absolute numbers of eosinophil (CD45+CD11cSiglec F+) in lungs were analyzed by flow cytometry. j H&E staining of lung tissues (bar, 100 µm) and the histological score. In all panels, 2–3 independent experiments were performed. In Fig. 1e, the data are presented as the mean ± SEM values, by unpaired two-tailed Student’s t test. For box plots, the data are shown as “Min to Max, show all points”. For box plots, the midline represents the median; box represents the interquartile range (IQR) between the first and third quartiles, and whiskers represent the lowest or highest values within 1.5 times IQR from the first or third quartiles (b, c, d, f, g, h, i, j). **P < 0.01; ***P < 0.001; ****P < 0.0001 by unpaired two-tailed Student’s t test. Statistical source data are provided in Source Data.
Fig. 2
Fig. 2. ILC2s in neonates born to Abx mothers display enhanced functionality.
a Schematic diagram of maternal antibiotic treatment of ILC2-deficient mice (Rorafl/fl Il7rCre) and Rorafl/fl littermate controls (n = 4). Allergic airway inflammation, including EOS numbers in lungs, amounts of type 2 cytokines in lungs and histological scoring of lungs were evaluated (bd). b Frequencies and absolute numbers of eosinophils in lungs were evaluated by flow cytometry. c Amounts of IL-5 and IL-13 in lung homogenates were measured by ELISA. d H&E staining of lungs (bar, 100 µm) and histological scoring. e Illustration of experimental model: lung ILC2s were sorted from neonatal mice from Abx-treated and control dams, followed by transferred into NCG mice (1.5 × 104 cells/mouse). NCG mice were then challenged intranasally with IL-33 or PBS daily for 3 days (n = 4). The phenotype of ILC2 in lungs and allergic airway inflammation were evaluated (fi). f Flow cytometric analysis of ILC2s in lungs. g Flow cytometric analysis of eosinophils in lungs and BALF. h Amounts of IL-5 and IL-13 in BALF were determined by ELISA. i H&E staining of lung tissues (bar, 100 µm) and the histological scoring. In Fig. 2c and h, the data are presented as the mean ± SEM values, by unpaired two-tailed Student’s t test. For box plots, the data are shown as “Min to Max, show all points”. For box plots, the midline represents the median; box represents the interquartile range (IQR) between the first and third quartiles, and whiskers represent the lowest or highest values within 1.5 times IQR from the first or third quartiles (b, d, f, g, i). *P < 0.05; **P < 0.01; ***P < 0.001 by unpaired two-tailed Student’s t test or one-way ANOVA followed by Tukey-Kramer multiple-comparisons test. Data are presentative of 2-3 independent experiments (ai). Statistical source data are provided in Source Data.
Fig. 3
Fig. 3. Breast milk derived factors contribute to the effects of microbiota on neonatal ILC2s.
a Schematic diagram of cross-fostering experiments: pups born to antibiotic dams and control littermates were switched at postnatal day 1 (P1) (n = 5). The phenotype of ILC2 in lungs and allergic airway inflammation were evaluated (bf). b Flow cytometric analysis of ILC2s in neonatal lungs. c Flow cytometric analysis of the frequency of proliferative ILC2s (Ki-67+) and cytokine-producing ILC2s (IL-5+IL-13+). d Amounts of IL-5 and IL-13 in lung homogenates were determined by ELISA. e Flow cytometric analysis of eosinophils in lungs. f H&E staining of lung tissues (bar, 100 µm) and the histological scoring. In Fig. 3d, the data are presented as the mean ± SEM values, by unpaired two-tailed Student’s t test. For box plots, the data are shown as “Min to Max, show all points”. For box plots, the midline represents the median; box represents the interquartile range (IQR) between the first and third quartiles, and whiskers represent the lowest or highest values within 1.5 times IQR from the first or third quartiles (b, c, e, f). *P < 0.05; **P < 0.01; ***P < 0.001; ****P < 0.0001 by unpaired two-tailed Student’s t test. Data are presentative of 2-3 independent experiments (af). Statistical source data are provided in Source Data.
Fig. 4
Fig. 4. Maternal antibiotic exposure downregulates IFN1 signaling in neonatal ILC2s.
ac Lung ILC2s were sorted from neonates born to Abx or PBS dams, and transcriptional profiling was evaluated by SMART-seq. a Volcano plots presenting the differences between two groups. The negative binomial distribution was employed for the identification of differentially expressed genes through the use of DESeq2. The Benjamini-Hochberg method was applied for multiple testing correction. b Top 10 pathways enriched in KEGG analysis. The hypergeometric test was employed to assess the impact of differentially expressed genes on a pathway. The Benjamini-Hochberg method was applied for multiple testing correction. c Gene set enrichment analysis (GSEA) showing the downregulation of interferon β (IFNβ) signaling in Abx group. The one-sided Wilcoxon rank-sum test was employed for the enrichment analysis of the IFNβ signaling pathway within the framework of GSEA. d Amounts of IFNβ in the culture supernatants of lung ILC2s were measured by ELISA (n = 3). e The amounts of IL-5 and IL-13 in the culture supernatants of lung ILC2s in the presence of different dosages of IFNβ were measured by ELISA (n = 4). fi WT and Ifnar1-/- pregnant mice were subjected to Abx treatment, pups were intraperitoneally injected with IFNβ (1 × 104 U/mouse) daily for 5 consecutive days. Pups were sacrificed at postnatal day 7 (n = 5). The absolute number of ILC2 (f), the frequency of Ki-67+ ILC2s (g), and the frequency of IL-5+ IL-13+ ILC2s (h) in lungs were analyzed by flow cytometry. i Amounts of IL-5 and IL-13 in BALF were determined by ELISA. In Fig. 4d, 4e and 4i, the data are presented as the mean ± SEM values, by unpaired two-tailed Student’s t test. For box plots, the data are shown as “Min to Max, show all points”. For box plots, the midline represents the median; box represents the interquartile range (IQR) between the first and third quartiles, and whiskers represent the lowest or highest values within 1.5 times IQR from the first or third quartiles (f, g, h). **P < 0.01; ***P < 0.001; ****P < 0.0001 by unpaired two-tailed Student’s t test or one-way ANOVA followed by Tukey-Kramer multiple-comparisons test. Data are presentative of 2-3 independent experiments (di). Statistical source data are provided in Source Data.
Fig. 5
Fig. 5. Butyrate suppresses neonatal ILC2 responses via upregulation of IFN1 signaling.
a,b Metabolomics analysis was performed to evaluate the metabolites in breastmilk and serum from Abx-treated dams and control dams. a Volcano plot showing metabolites with differential abundance between Abx-treated dams and the controls (n = 3). The two-sided Wilcoxon rank-sum test was employed to identify differences. The Benjamini-Hochberg method was applied for multiple testing correction. b Targeted metabolomics analysis of SCFAs in serum (n = 5)/breast milk (n = 3) of Abx-treated dams and controls. c ILC2s from neonatal lungs were cultured in vitro with 100 ng/mL IL-33, 20 ng/mL IL-2 and 20 ng/mL IL-7 for 3 days, in the presence of butyrate (But, 2 mM) or medium control (Med). The mRNA expression of Gata3, Il5, and Il13 was determined by qRT-PCR (n = 4). d GF newborn mice were intraperitoneally injected with butyrate (100 mg/kg) daily for 5 consecutive days, and pups were sacrificed at postnatal day 7 (n = 5). The absolute numbers of ILC2s, the frequency of Ki-67+ ILC2s and IL-5+IL-13+ ILC2s, as well as eosinophils in lungs were evaluated by flow cytometry. eg Lung ILC2s from neonatal mice were cultured with 100 ng/mL IL-33, 20 ng/mL IL-2, and 20 ng/mL IL-7 for 3 days in the presence or absence of butyrate (2 mM). e Phosphorylation of STAT1 and STAT2 was determined by flow cytometry (n = 5). f mRNA expression of Ifnar1, Irf7, Mx1, Isg15 and Ifnb1 was determined by qRT-PCR (n = 4). g Lung ILC2s from neonates were cultured with IL-2, IL-7, and IL-33 for 3 days in the presence or absence of butyrate (2 mM), fludarabine (Flu, 5 μM), or hydrocortisone (Hydro, 0.4 mg/mL) for 12 h. Amounts of IL-5 and IL-13 in supernatants were determined by ELISA (n = 4). h Expression of GPR41 on neonatal ILC2s was evaluated by flow cytometry (left) and immunofluorescence. Scale bar, 10 μm (right). ij Gpr41−/− pregnant mice and WT control were subjected to antibiotic treatment; pups were intraperitoneally injected with butyrate (100 mg/kg) daily for 5 consecutive days and were sacrificed at PND7 (n = 4). Absolute numbers of ILC2s (i-left) and the frequency of IL-5+IL-13+ ILC2s (i-middle) and absolute numbers of eosinophils (i-right) were evaluated by flow cytometry. Amounts of IFNβ in lung homogenates were measured by ELISA (j). In Fig. 5e and 5j, the data are presented as the mean ± SEM values, by unpaired two-tailed Student’s t test. For box plots, the data are shown as “Min to Max, show all points”. For box plots, the midline represents the median; box represents the interquartile range (IQR) between the first and third quartiles, and whiskers represent the lowest or highest values within 1.5 times IQR from the first or third quartiles (b, c, d, f, g, i). *P < 0.05; **P < 0.01; ***P < 0.001; ****P < 0.0001 by unpaired two-tailed Student’s t test (d, g, i) or Mann–Whitney U test (b, c, f). Data are presentative of 2-3 independent experiments (cj). Statistical source data are provided in Source Data.
Fig. 6
Fig. 6. Maternal antibiotic exposure induces epigenetic changes in ILC2s and exerts long-term effects on allergic inflammation in adult offspring.
ad ILC2s from Abx adult offspring display distinct chromatin accessibility (n = 2). a Experimental design: adult offspring born to antibiotic exposed dams and the controls were challenged with IL-33 intranasally for 3 consecutive days (500 ng/mouse/day). Lung ILC2s were sorted for ATAC-seq analysis. b Integrated genome viewer snapshots of representative genes involved in Con and Abx ILC2s. Genomic regions differentially open in Con and Abx ILC2s are highlighted in gray boxes. Red dots indicate peaks that are more accessible in Abx ILC2s, and blue dots indicate those that are uniquely accessible in control ILC2 (fold change >2, FDR < 0.05). c Integrated genome viewer snapshots of representative genes involved in Th2 signaling and ICOS. d HOMER de novo motif analysis of multiple transcription factors important for ILC2 function. ej Adult offspring born to Abx dams or controls were administered with papain or PBS intranasally for 5 consecutive days (n = 5). e Illustration of experimental model. Adult offspring born to Abx dams or controls were administered with papain or PBS intranasally for 5 consecutive days. Mice were analyzed on day 6. ILC2 phenotype and allergic inflammation in lungs were evaluated (fj). The frequencies of ILC2s in lungs (f), IL-5+IL-13+ ILC2s, and Ki-67+ ILC2s (g) and absolute numbers of eosinophils in lung (h) were analyzed by flow cytometry. (i): Amounts of IL-5 and IL-13 in BALF were measured by ELISA. j H&E staining of lung tissues (bar, 100 µm) and histological score. In Fig. 6i, the data are presented as the mean ± SEM values, by unpaired two-tailed Student’s t test. For box plots, the data are shown as “Min to Max, show all points”. For box plots, the midline represents the median; box represents the interquartile range (IQR) between the first and third quartiles, and whiskers represent the lowest or highest values within 1.5 times IQR from the first or third quartiles (f, g, h, j). *P < 0.05; **P < 0.01; ***P < 0.001; ****P < 0.0001 by unpaired two-tailed Student’s t test or one-way ANOVA followed by Tukey-Kramer multiple-comparisons test. Data are presentative of 2-3 independent experiments (fj). Statistical source data are provided in Source Data.
Fig. 7
Fig. 7. Therapeutic window of allergic airway inflammation in early life.
a Schematic diagram of butyrate supplementation at different periods. For Prenatal group, antibiotic-exposed dams were supplemented with butyrate (200 mM) in drinking water from embryonic day 14 (E14) to postnatal day 7 (P7) (n = 5); for Neonatal group, pups of Abx dams were intraperitoneally injected with butyrate daily from P2 to P7 (n = 5); for Post-Wean group, pups of Abx dams were supplemented with butyrate (200 mM) in drinking water from P21 for 2 weeks (n = 5). After butyrate supplementation, adult mice were administered with papain or PBS intranasally for 5 consecutive days. ILC2 phenotype and allergic inflammation in lungs were evaluated (bf). bc Frequencies and absolute numbers of ILC2s in lungs (b). Ki-67+ ILC2s and IL-5+ IL-13+ ILC2s (c) were evaluated by flow cytometry. d Amounts of IL-5 and IL-13 in BALF were examined by ELISA. e Frequencies of eosinophils in BALF were analyzed by flow cytometry. f H&E staining of lung tissues (bars, 100 µm). In Fig. 7d, the data are presented as the mean ± SEM values, by unpaired two-tailed Student’s t test. For box plots, the data are shown as “Min to Max, show all points”. For box plots, the midline represents the median; box represents the interquartile range (IQR) between the first and third quartiles, and whiskers represent the lowest or highest values within 1.5 times IQR from the first or third quartiles (b, c, e, f). *P < 0.05; **P < 0.01; ***P < 0.001; ****P < 0.0001 by unpaired two-tailed Student’s t test. Data are presentative of 2-3 independent experiments (bf). Statistical source data are provided in Source Data.

References

    1. Gray J, et al. Intestinal commensal bacteria mediate lung mucosal immunity and promote resistance of newborn mice to infection. Sci. Transl. Med. 9, eaaf9412 (2017). - PMC - PubMed
    1. Moreno-Córdova V, Berra-Romani R, Flores Mendoza LK, Reyes-Leyva J. Th17 Lymphocytes in children with asthma: do they influence control? Pediatr. Allergy Immunol. Pulmonol. 2021;34:147–152. doi: 10.1089/ped.2021.0067. - DOI - PMC - PubMed
    1. Stokholm J, et al. Maturation of the gut microbiome and risk of asthma in childhood. Nat. Commun. 2018;9:141. doi: 10.1038/s41467-017-02573-2. - DOI - PMC - PubMed
    1. Davoudi V, Keyhanian K, Bove RM, Chitnis T. Immunology of neuromyelitis optica during pregnancy. Neurol. Neuroimmunol. Neuroinflamm. 2016;3:e288. doi: 10.1212/NXI.0000000000000288. - DOI - PMC - PubMed
    1. Kabata H, Moro K, Koyasu S. The group 2 innate lymphoid cell (ILC2) regulatory network and its underlying mechanisms. Immunol. Rev. 2018;286:37–52. doi: 10.1111/imr.12706. - DOI - PubMed

Publication types

Associated data