. 2024 Oct 28;15(1):9287.
doi: 10.1038/s41467-024-53657-9.

Protective effect of TCR-mediated MAIT cell activation during experimental autoimmune encephalomyelitis

Affiliations

Protective effect of TCR-mediated MAIT cell activation during experimental autoimmune encephalomyelitis

Mark Walkenhorst et al. Nat Commun. .

Abstract

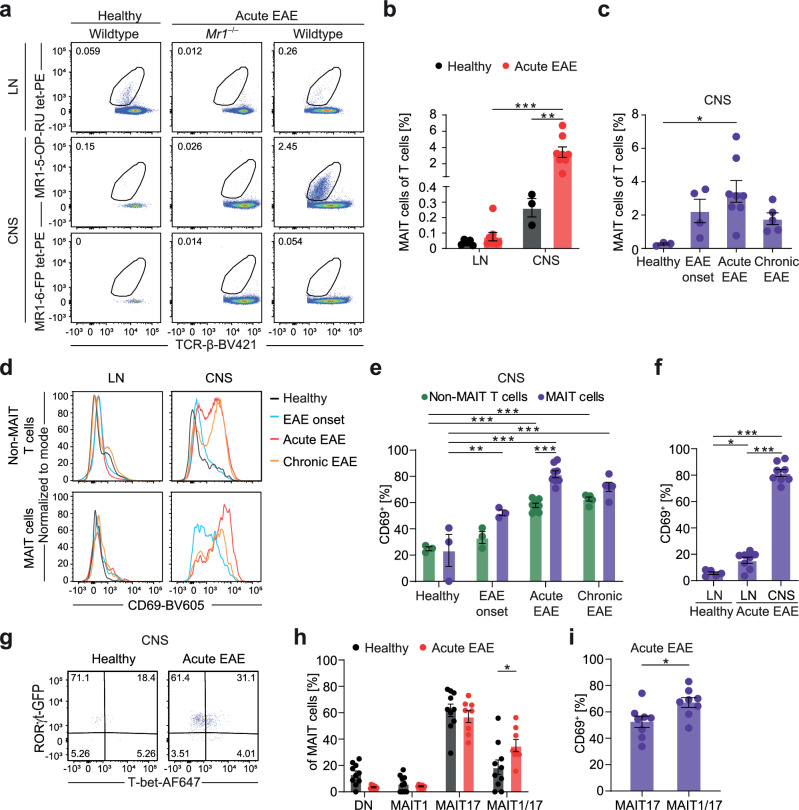
Mucosal-associated invariant T (MAIT) cells express semi-invariant T cell receptors (TCR) for recognizing bacterial and yeast antigens derived from riboflavin metabolites presented on the non-polymorphic MHC class I-related protein 1 (MR1). Neuroinflammation in multiple sclerosis (MS) is likely initiated by autoreactive T cells and perpetuated by infiltration of additional immune cells, but the precise role of MAIT cells in MS pathogenesis remains unknown. Here, we use experimental autoimmune encephalomyelitis (EAE), a mouse model of MS, and find an accumulation of MAIT cells in the inflamed central nervous system (CNS) enriched for MAIT17 (RORγt+) and MAIT1/17 (T-bet+RORγt+) subsets with inflammatory and protective features. Results from transcriptome profiling and Nur77GFP reporter mice show that these CNS MAIT cells are activated via cytokines and TCR. Blocking TCR activation with an anti-MR1 antibody exacerbates EAE, whereas enhancing TCR activation with the cognate antigen, 5-(2-oxopropylideneamino)-6-D-ribitylaminouracil, ameliorates EAE severity, potentially via the induction of amphiregulin (AREG). In summary, our findings suggest that TCR-mediated MAIT cell activation is protective in CNS inflammation, likely involving an induction of AREG.


Conflict of interest statement

The authors declare no competing interests.

Figures

Fig. 1
Fig. 1. Activated MAIT17 and MAIT1/17 cells accumulate in the inflamed CNS during EAE.
a, b MAIT cell frequency in LN and CNS of wildtype and Mr1−/− C57BL/6 J mice was analyzed by flow cytometry in healthy mice (LN, n = 5; CNS, n = 3 samples pooled from 3 mice per sample) and mice during acute EAE (n = 8; 14 days post immunization (dpi)). MAIT cells were gated as living CD45+CD11bCD45RTCR-β+MR1tetramer(5-OP-RU)+ cells. c MAIT cell frequency in the CNS of C57BL/6 mice was analyzed as described in (a) in healthy mice (n = 3 samples pooled from 3 mice per sample), mice at EAE onset (n = 4; 9 dpi), during acute EAE (n = 8; 14 dpi) and during chronic EAE (n = 5; 30 dpi). df T cell activation, reflected by CD69 expression, was quantified by flow cytometry in LN and CNS from healthy mice (LN, n = 5; CNS, n = 3), mice at EAE onset (n = 3), during acute EAE (n = 8) and during chronic EAE (n = 5). MAIT cells were gated as described in a and non-MAIT T cells were defined as living CD45+CD11bCD45RTCR-β+MR1tetramer(5-OP-RU)CD44+ cells. g, h RORγt and T-bet expression were quantified in RORγtGFP transgenic reporter mice by flow cytometry after intranuclear T-bet staining in CNS of healthy mice (n = 10) and of mice during acute EAE (n = 8). MAIT cells were classified as double-negative (DN; RORγtT-bet), MAIT1 (RORγtT-bet+), MAIT17 (RORγt+T-bet) and MAIT1/17 (RORγt+T-bet+). i The frequency of CD69+ cells was quantified among MAIT17 and MAIT1/17 cells in the CNS of RORγtGFP transgenic reporter mice during acute EAE (n = 8). Data are shown as mean ± SEM. Statistics: two-way ANOVA in (b, e, h) (hP = 0.0116); one-way ANOVA in c (P = 0.0278), f; t-test (two-tailed) in i (P = 0.0243); *P < 0.05, **P < 0.01, ***P < 0.001. Source data are provided as a Source Data file.
Fig. 2
Fig. 2. Induction of inflammatory and tissue repair gene signatures in CNS-infiltrating MAIT cells in EAE.
MAIT cells from healthy spleen, EAE spleen and EAE CNS during acute EAE (14 days post immunization) of C57BL/6 J mice (n = 4 samples per group pooled from 5 mice per sample) were sorted (living CD45+CD11bCD45RTCR-β+MR1tetramer(5-OP-RU)+ cells) and subjected to bulk-RNA sequencing. a Inflammatory and tissue repair associated GO-terms among the 50 most upregulated GO terms represented in differentially expressed genes between EAE CNS and EAE spleen. b, d Gene set enrichment analysis (GSEA) of signatures defining pathogenic Th17 cells and tissue repair in indicated comparisons. Normalized enrichment score (NES) and false discovery rate (FDR; P-values after Benjamini-Hochberg adjustment) are shown. c, e Quantification of expression of indicated gene sets in MAIT cells derived from healthy spleen, EAE spleen and EAE CNS by AUCell analysis of data generated as described above. Data are shown as mean ± SEM. Statistics: gene set enrichment analysis (GSEA) in (b, d); one-way ANOVA in (c, e) **P < 0.01, ***P < 0.001. Source data are provided as a Source Data file.
Fig. 3
Fig. 3. Induction of effector molecules representing inflammatory and tissue repair function by MAIT cells in acute EAE.
a Normalized expression of Il22, Csf2, Il17a and Ifng from RNA sequencing data of MAIT cells sorted from healthy spleen, EAE spleen and EAE CNS of C57BL/6 J mice (n = 4 samples per group pooled from 5 mice per sample). b, c MAIT cells were isolated from healthy spleen and from spleen and CNS during acute EAE of C57BL/6 J mice (n = 4 per group) and were cultured for 4 h in the presence of phorbol 12-myristate-13-acetate (PMA) (10 ng/ml), ionomycin (1 μg/ml) and monensin (2 µM) (red) or left unstimulated (grey). IL-22, GM-CSF, IL-17A and IFN-γ were subsequently stained intracellularly and quantified by flow cytometry. d Normalized expression of Amphiregulin (Areg) from RNA sequencing data of sorted MAIT cells from C57BL/6 J mice (n = 4 samples per group pooled from 5 mice per sample). e, f MAIT cells were isolated from healthy spleen and from spleen and CNS during acute EAE of C57BL/6 J mice (n = 5 per group) and were cultured for 4 h in the presence of PMA (10 ng/ml), ionomycin (1 μg/ml) and monensin (2 µM) (red) or left unstimulated (grey). AREG was subsequently stained intracellularly and quantified by flow cytometry. Data are shown as mean ± SEM. Statistics: DESeq2 false discovery rate-adjusted P-value in (a, d); two-way ANOVA in c; one-way ANOVA in (f); *P < 0.05, **P < 0.01, ***P < 0.001. Source data are provided as a Source Data file.
Fig. 4
Fig. 4. TCR- and cytokine-mediated activation of MAIT cells in EAE.
a Expression of gene sets enriched in MAIT cells activated via cytokines, TCR or via cytokines and TCR in sorted MAIT cells from indicated tissues of C57BL/6 J mice (n = 4 samples per group pooled from 5 mice per sample) quantified by AUCell analysis. b, c Nur77 expression in the CNS quantified by flow cytometry in healthy Nur77GFP reporter mice (n = 5 samples pooled from 3 mice per sample) and during preclinical EAE (6–7 days post immunization (dpi); n = 4), EAE onset (9–11 dpi; n = 4), acute EAE (13–14 dpi; n = 12) and chronic EAE (30 dpi, n = 6; 45 dpi, n = 5). d Nur77GFP expression was measured by flow cytometry in classical T cells (living CD45+CD11bCD45RTCR-β+MR1tetramer(5-OP-RU)CD1dtetramer(PBS-57)CD44+ cells), γδ T cells (living CD45+CD11bCD45RTCR-βTCR-γδ+ cells), NKT cells (living CD45+CD11bCD45RTCR-β+CD1dtetramer(PBS-57)+ cells) and MAIT cells (living CD45+CD11bCD45RTCR-β+MR1tetramer(5-OP-RU)+ cells) from LN, spleen and CNS of Nur77GFP reporter mice during acute EAE (14 dpi; n = 5). e, f Nur77GFP and Nur77GFP+ MAIT cells were sorted from the CNS of Nur77GFP reporter mice in acute EAE (n = 3 samples per cell type pooled from 4 mice per sample) and cultured for 4 h in the presence of phorbol 12-myristate-13-acetate (PMA) (10 ng/ml), ionomycin (1 μg/ml) and monensin (2 µM). GM-CSF, IL-17A and AREG were subsequently stained intracellularly and quantified by flow cytometry. Data are shown as mean ± SEM. Statistics: one-way ANOVA in (a); two-way ANOVA in (c, d, f); *P < 0.05, **P < 0.01, ***P < 0.001. Source data are provided as a Source Data file.
Fig. 5
Fig. 5. Blocking TCR activation of MAIT cells exacerbates EAE.
ac EAE was induced in female C57BL/6 J mice by active immunization against MOG35-55 peptide. Clinical score and body weight were assessed daily. At 5, 10 and 15 days post immunization (dpi) mice were injected i.p. either with an anti-MR1 blocking antibody (n = 29) (clone: 26.5, 250 µg/injection) or with a respective IgG isotype control (n = 34). Data were pooled from two independent experiments. The EAE course was divided into EAE onset (day of first symptoms–12 dpi), acute EAE (13–17 dpi), EAE recovery (18–22 dpi) and chronic EAE (23–30 dpi). The cumulative score in the respective phases was compared between groups. d, e Nur77GFP reporter mice were immunized and treated with anti-MR1 blocking antibody (n = 6) or isotype control (n = 4) as described in (a). During acute EAE (16 dpi), Nur77GFP expression of MAIT and non-MAIT T cells from the CNS was analyzed. Data are shown as mean ± SEM. Statistics: Mann-Whitney-U test (two-tailed) in (a, c) (P = 0.0034); t-test (one-tailed) in (d) (P = 0.0404), e; *P < 0.05, **P < 0.01. Source data are provided as a Source Data file.
Fig. 6
Fig. 6. TCR activation of MAIT cells ameliorates chronic EAE.
a EAE was induced in Nur77GFP reporter mice by active immunization against MOG35-55 peptide, followed by i.p. injections of 5-OP-RU (1 nmol) or PBS every 2 days starting at EAE onset (9 days post immunization (dpi)). During acute EAE (15 dpi), the Nur77GFP signal of classical T cells (living CD45+CD11bCD45RTCR-β+MR1tetramer(5-OP-RU)CD1dtetramer(PBS-57)CD44+ cells), γδ T cells (living CD45+CD11bCD45RTCR-βTCR-γδ+CD44+ cells), NKT cells (living CD45+CD11bCD45RTCR-β+CD1dtetramer(PBS-57)+CD44+ cells) and MAIT cells was measured by flow cytometry in LN (PBS, n = 2 mice; 5-OP-RU, n = 5 mice), spleen (n = 5 mice per group) and CNS (n = 5 mice per group). bd EAE was induced in female C57BL/6 J mice by active immunization against MOG35-55 peptide. Mice were injected i.p. with 5-OP-RU (1 nmol, n = 18) or PBS (n = 19) every 2 days starting at EAE onset (9 dpi). The cumulative score of the respective phases divided as in Fig. 5 was compared between groups. e, f 30 dpi, cervical spinal cord slices of female C57BL/6 J mice (n = 7 per group) were stained for GFAP. Scale bar, 250 µm. Area of GFAP was quantified using ImageJ. Data are shown as mean ± SEM. Statistics: two-way ANOVA in (a) (LN, P = 0.0016; Spleen, P = 0.0006; CNS, P < 0.00001); Mann-Whitney-U test (two-tailed) in (b, d) (P = 0.0478), (f) (P = 0.0175); *P < 0.05, **P < 0.01, ***P < 0.001. Source data are provided as a Source Data file.
Fig. 7
Fig. 7. Protective effect of high-dose TCR-activation in EAE.
ac EAE was induced in female C57BL/6 J mice by active immunization against MOG35-55 peptide. Mice were injected i.p. with 5-A-RU-PABC-Val-Cit-Fmoc (30 nmol, n = 25) or PBS (n = 25) for 5 days starting at EAE onset (9 days post immunization (dpi)). The EAE course was divided into EAE onset (day of first symptoms–16 dpi), acute EAE (17–21 dpi), EAE recovery (22–25 dpi) and chronic EAE (26–30 dpi). The cumulative score of the respective phases was compared between groups. df EAE was induced in female C57BL/6 J mice and the mice were treated as described in a and analyzed in acute EAE (20 dpi). d MAIT cell frequency in the CNS of PBS (n = 6) or 5-A-RU-PABC-Val-Cit-Fmoc (n = 8) treated mice was analyzed by flow cytometry. e Cells were isolated from the CNS of PBS (n = 4) or 5-A-RU-PABC-Val-Cit-Fmoc (30 nmol; n = 7) treated mice and cultured for 4 h in the presence of phorbol 12-myristate-13-acetate (PMA) (10 ng/ml), ionomycin (1 μg/ml) and monensin (2 µM). Intracellular AREG of MAIT cells, non-MAIT T cells and microglia was measured by flow cytometry. f Amounts of AREG in spinal cord lysates of PBS (n = 6) or 5-A-RU-PABC-Val-Cit-Fmoc (n = 8) treated mice were quantified by ELISA. Data are shown as mean ± SEM. Statistics: Mann-Whitney-U test (one-tailed) in (a, c) (Acute, P = 0.0393; Recovery, P = 0.0066; Chronic, P = 0.0077); t-test (two-tailed) in (d, e) (eP = 0.0323), (f) (P = 0.0224); *P < 0.05, **P < 0.01. Source data are provided as a Source Data file.

References

    1. Woo, M. S., Engler, J. B. & Friese, M. A. The neuropathology of multiple sclerosis. Nat. Rev. Neurosci.10.1038/s41583-024-00823-z (2024). - PubMed
    1. Attfield, K. E., Jensen, L. T., Kaufmann, M., Friese, M. A. & Fugger, L. The immunology of multiple sclerosis. Nat. Rev. Immunol.22, 734–750 (2022). - PubMed
    1. Simmons, S. B., Pierson, E. R., Lee, S. Y. & Goverman, J. M. Modeling the heterogeneity of multiple sclerosis in animals. Trends Immunol.34, 410–422 (2013). - PMC - PubMed
    1. Lee, Y. et al. Induction and molecular signature of pathogenic TH17 cells. Nat. Immunol.13, 991–999 (2012). - PMC - PubMed
    1. Pierson, E., Simmons, S. B., Castelli, L. & Goverman, J. M. Mechanisms regulating regional localization of inflammation during CNS autoimmunity. Immunol. Rev.248, 205–215 (2012). - PMC - PubMed

Publication types

MeSH terms

Substances

Associated data