. 2010 Sep 14;107(37):16222-7.
doi: 10.1073/pnas.1004381107. Epub 2010 Aug 26.

Signatures of founder effects, admixture, and selection in the Ashkenazi Jewish population

Affiliations

Signatures of founder effects, admixture, and selection in the Ashkenazi Jewish population

Steven M Bray et al. Proc Natl Acad Sci U S A. .

Abstract

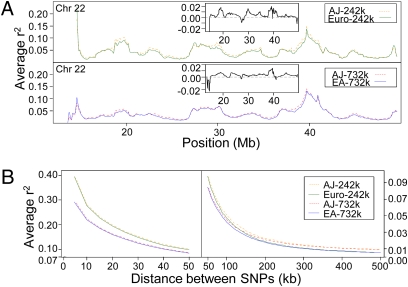
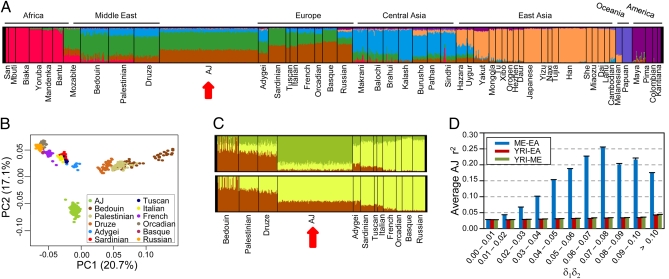
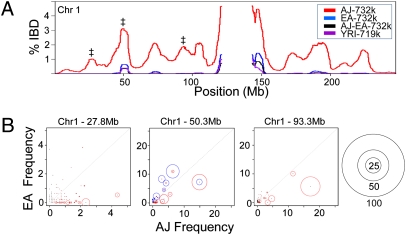
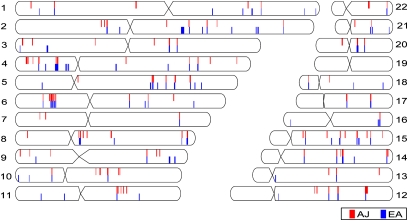
The Ashkenazi Jewish (AJ) population has long been viewed as a genetic isolate, yet it is still unclear how population bottlenecks, admixture, or positive selection contribute to its genetic structure. Here we analyzed a large AJ cohort and found higher linkage disequilibrium (LD) and identity-by-descent relative to Europeans, as expected for an isolate. However, paradoxically we also found higher genetic diversity, a sign of an older or more admixed population but not of a long-term isolate. Recent reports have reaffirmed that the AJ population has a common Middle Eastern origin with other Jewish Diaspora populations, but also suggest that the AJ population, compared with other Jews, has had the most European admixture. Our analysis indeed revealed higher European admixture than predicted from previous Y-chromosome analyses. Moreover, we also show that admixture directly correlates with high LD, suggesting that admixture has increased both genetic diversity and LD in the AJ population. Additionally, we applied extended haplotype tests to determine whether positive selection can account for the level of AJ-prevalent diseases. We identified genomic regions under selection that account for lactose and alcohol tolerance, and although we found evidence for positive selection at some AJ-prevalent disease loci, the higher incidence of the majority of these diseases is likely the result of genetic drift following a bottleneck. Thus, the AJ population shows evidence of past founding events; however, admixture and selection have also strongly influenced its current genetic makeup.


Conflict of interest statement

The authors declare no conflict of interest.

Figures

Fig. 1.
Fig. 1.
LD in Ashkenazi Jews compared with Europeans. (A) A 1.7-Mb sliding window shifting 100 kb along chromosome 22. (Upper) AJ and Euro populations; (Lower) AJ and EA populations. For each window, the average r2 was calculated between all pairs of SNPs within 500 kb of each other. The Insets show the AJ r2 minus the Euro or EA r2, respectively. (B) The decay of LD across all of the autosomes was assessed by grouping pairs of SNPs according to the distance separating them (0–5 kb, 5–10 kb, …, 495–500 kb) and then plotting the average r2 of each bin. (Left) Distances from 0 to 50 kb; (Right) distances from 50 to 500 kb. Note the scales on the y axis are different for the Left and Right.
Fig. 2.
Fig. 2.
Admixture and its relationship with LD. (A–C) Ancestral population clustering and PCA were performed using the combined AJ and HGDP populations. The AJ population was divided into three random subgroups of 157 individuals to better match the population size of the Middle Eastern and European populations in the HGDP dataset. The data shown represent one subgroup, and all three had similar results. (A) Population clustering analysis of AJ and all HGDP individuals for seven, K = 7, theoretical ancestral populations. Each color represents a different ancestral population and each vertical line represents a single individual. The proportion of each color within an individual signifies the fraction of ancestry derived from the color's ancestral population. The red arrow highlights the AJ population. (B) PCA performed using only the AJ, Middle Eastern, and European HGDP populations. (C) Population clustering analysis with K = 3 (Upper) or K = 2 (Lower) ancestral populations, performed using only the AJ, Middle Eastern, and European HGDP populations. (D) The correlation between admixture and LD was determined by plotting the average r2 for all SNP pairs within the given intervals of δ1δ2, where δ1 is the allele frequency difference between the founding populations at locus 1, and δ2 is the frequency difference at locus 2. The legend indicates the populations representing the founding populations: Middle Eastern (ME), European American (EA), or Yoruba in Ibadan, Nigeria (YRI). Error bars show SEM.
Fig. 3.
Fig. 3.
IBD and frequency of shared haplotypes. (A) The percentage of IBD for all pairs of individuals within the AJ, EA, and YRI populations is plotted for chromosome 1. Pairs consisting of one Ashkenazi Jew with one European American (AJ-EA) were also analyzed. The symbol ‡ mark the three loci whose haplotype frequencies are analyzed in B. (B) The 100-SNP haplotype blocks centered at three loci marked in A were analyzed for their frequency in the AJ and EA population. Red circles represent the haplotypes identified with IBD in the AJ population and the size of the circle indicates the frequency that the haplotype is shared (i.e., 50 indicates that the given haplotype is shared by half of the AJ pairs with IBD at that locus). The scale of the circles is given on the far right. (Center) Blue circles represent the haplotypes with IBD in the EA population.
Fig. 4.
Fig. 4.
The top 1% of iHS-selected regions. Each chromosomal ideogram shows the position of the top 1% of iHS windows in the AJ population, red, and the EA population, blue.

References

    1. Ostrer H. A genetic profile of contemporary Jewish populations. Nat Rev Genet. 2001;2:891–898. - PubMed
    1. Arcos-Burgos M, Muenke M. Genetics of population isolates. Clin Genet. 2002;61:233–247. - PubMed
    1. Peltonen L, Palotie A, Lange K. Use of population isolates for mapping complex traits. Nat Rev Genet. 2000;1:182–190. - PubMed
    1. Risch N, Tang H, Katzenstein H, Ekstein J. Geographic distribution of disease mutations in the Ashkenazi Jewish population supports genetic drift over selection. Am J Hum Genet. 2003;72:812–822. - PMC - PubMed
    1. Slatkin M. A population-genetic test of founder effects and implications for Ashkenazi Jewish diseases. Am J Hum Genet. 2004;75:282–293. - PMC - PubMed

Publication types

Associated data