Fasting-sensitive SUMO-switch on Prox1 controls hepatic cholesterol metabolism
- PMID: 37560809
- PMCID: PMC10561358
- DOI: 10.15252/embr.202255981
Fasting-sensitive SUMO-switch on Prox1 controls hepatic cholesterol metabolism
Abstract
Accumulation of excess nutrients hampers proper liver function and is linked to nonalcoholic fatty liver disease (NAFLD) in obesity. However, the signals responsible for an impaired adaptation of hepatocytes to obesogenic dietary cues remain still largely unknown. Post-translational modification by the small ubiquitin-like modifier (SUMO) allows for a dynamic regulation of numerous processes including transcriptional reprogramming. We demonstrate that specific SUMOylation of transcription factor Prox1 represents a nutrient-sensitive determinant of hepatic fasting metabolism. Prox1 is highly SUMOylated on lysine 556 in the liver of ad libitum and refed mice, while this modification is abolished upon fasting. In the context of diet-induced obesity, Prox1 SUMOylation becomes less sensitive to fasting cues. The hepatocyte-selective knock-in of a SUMOylation-deficient Prox1 mutant into mice fed a high-fat/high-fructose diet leads to a reduction of systemic cholesterol levels, associated with the induction of liver bile acid detoxifying pathways during fasting. The generation of tools to maintain the nutrient-sensitive SUMO-switch on Prox1 may thus contribute to the development of "fasting-based" approaches for the preservation of metabolic health.
Keywords: Bile acids; Cholesterol; Liver; Prox1; SUMOylation.
© 2023 The Authors. Published under the terms of the CC BY NC ND 4.0 license.
Conflict of interest statement
The authors declare that they have no conflict of interest.
Figures

Schematic representation of the protocol used to enrich and detect endogenous SUMO targets in the mouse liver in the fasted and refed states (Becker et al, 2013).
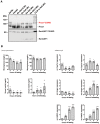
SUMO2 immunoprecipitation using crosslinked SUMO2 antibody beads and liver samples of wild‐type C57BL6/J mice in the fasted (16 h) or refed (16‐h fasted and re‐fed 2 h) states. Eluates analyzed by immunoblotting using anti‐Prox1 antibodies and ponceau staining was used as loading control.
8 weeks old C57BL/6N male mice were fasted (food removed at ZT 12) or re‐fed (fasted from ZT4 to ZT12 for synchronization; food re‐introduced at ZT 12). Tissue samples were collected at ZT 12, 15, 18 and 21 (n = 4). Liver lysates analyzed by immunoblotting using anti‐Prox1 and anti‐P_S6K(Thr389) antibodies; β actin was detected as an input control.
The quantification of SUMOylated Prox1 (%) and total Prox1 protein expression as well as Prox1 mRNA levels analyzed by qPCR are shown. qPCR data are presented as relative fold change normalized to the housekeeping gene TBP.

Schematic representation of Prox1. Functional domains are highlighted. The two putative SUMO‐consensus motifs (ΨKXE) with SUMOylation sites at lysine (K) residues 353 and 556 are marked. Figure adapted from (Elsir et al, 2012).
HepG2 cells overexpressing HA‐tagged mouse wild‐type Prox1 (wt), Prox1 K556R mutant or Prox1 E558A mutant. Cell lysates analyzed by immunoblotting using anti‐HA antibodies; tubulin was detected as an input control.
Mouse un‐tagged Prox1 (mProx1) was purified from HEK293T cells. Purified mProx1 was incubated with recombinant E1 and E2 enzyme together with either SUMO1 or SUMO2. The enzymatic reactions were started with ATP and incubated for 15, 30 and 60 min. A reaction with the Prox1 K556R mutant (KR) was used as a control. The 0 min sample was incubated without ATP. Samples were analyzed by immunoblotting using anti‐Prox1 antibodies.

Liver samples from C57BL/6J mice in the ad libitum, fasted (16 h) and refed (16 h fasted and refed for 0.5, 2, 6 and 24 h) states were analyzed by immunoblotting using anti‐Prox1 and RanGAP1 antibodies. The SUMO2 immunoprecipitation eluate was used for size verification. SUMOylated RanGAP1 was used as a loading control.
Eight weeks old C57BL/6N male mice were fasted: food was removed at ZT 12 or re‐fed: all groups were fasted for 8 h during the light phase (ZT 4–12) for synchronization, the food was reintroduced at ZT 12. Blood and liver samples were collected at ZT 12, 15, 18 and 21 (n = 4). Blood glucose and insulin levels (left) as well as liver expression analysis at the mRNA level by qPCR (right) are shown. qPCR data presented as relative fold change normalized to the housekeeping gene TBP.

Six‐week‐old C57BL/6N male mice were fed either a 0% cholesterol diet (ctrl) or a 2% high‐cholesterol diet (chol 2%) for 6 weeks.
Six weeks old C57BL/6N male mice were fed either a standard chow diet or a 60% high fat diet (HFD) for 8 weeks.
Six‐week‐old C57BL/6N male mice were fed either a standard chow diet or a 45% high fat +20% w/v fructose diet (HF/hfD) for 1 weeks.
(A–C) Liver samples were collected at ZT 15 in the fasted (11 h) and refed (fasted 8 h and refed 3 h) states (n = 4–5). Liver lysates were analyzed by immunoblotting using anti‐Prox1 antibodies; β actin was detected as an input control. The quantification of SUMOylated Prox1 and total Prox1 protein expression are shown.

Six‐week‐old C57BL/6N male mice were fed either a 0% cholesterol diet (ctrl) or a 2% high‐cholesterol diet (chol 2%) for 6 weeks.
Six‐week‐old C57BL/6N male mice were fed either a standard chow diet or a 60% high fat diet (HFD) for 8 weeks.
Six‐week‐old C57BL/6N male mice were fed either a standard chow diet or a 45% high fat +20% w/v fructose diet (HF/hfD) for 12 weeks.
(A–C) Blood and liver samples were collected at ZT 15 in the fasted (11 h) and re‐fed (fasted 8 h and refed 3 h) states (n = 4–5). Body weight records taken a day before tissue collection (n = 8–10), blood glucose, serum levels of total cholesterol and liver content of total cholesterol (for A) are shown.

Schematic representation of the SUMO‐deficient Prox1K556R knock‐in mouse model.
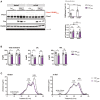
8 weeks old Prox1K556R K.I. (f/f) male mice were injected with a control AAV (Ctrl_AAV), with an AAV to overexpress Cre recombinase (Cre_AAV) or with phosphate‐buffered saline (PBS) (n = 4). Liver tissue samples were collected 3 weeks later from mice fed ad libitum. Liver lysates were analyzed by immunoblotting using anti‐Prox1 and anti‐Cre antibodies; Vcp was detected as an input control. The quantification of SUMOylated Prox1 and total Prox1 protein expression as well as Prox1 mRNA levels analyzed by qPCR are shown. qPCR data presented as relative fold change normalized to the housekeeping gene TBP.

Eight‐week‐old Prox1K556R K.I. (f/f) male mice were injected with a control AAV (Ctrl_AAV) or an AAV to overexpress Cre recombinase (Cre_AAV) (n = 2–4). 3 weeks later, hepatocytes (hep.) were isolated from the nonhepatocyte (non.h.) fraction. Expression analysis at the mRNA level by qPCR, data presented as relative fold change normalized to the housekeeping gene TBP.
Amplification reaction by PCR detecting the constitutive allele (280 bp) or the conditional K.I. allele after Cre‐mediated recombination (235 bp); control product (585 bp).

8 weeks old Prox1K556R K.I. (f/f) male mice were injected with a control AAV (Ctrl_AAV) or with an AAV to overexpress Cre recombinase (Cre_AAV) and placed on a high‐fat (45%) high‐fructose (20% w/v) diet for 18 weeks. Liver samples were collected between ZT 16 and 17 in the fasted (8 h) and refed (fasted 8 h and re‐fed 4–5 h) states (n = 7–8). Liver lysates were analyzed by immunoblotting using anti‐Prox1 and anti‐Cre antibodies; β actin was detected as an input control. The quantification of SUMOylated Prox1 and total Prox1 protein expression are shown.
Serum analysis using a colorimetric‐based serum analyzer. Levels of total cholesterol, high‐density lipoprotein (HDL) and low‐density lipoprotein (LDL) are shown.
Equal amounts of serum were pooled and separated by FPLC, serum lipoprotein cholesterol profiles are shown.

Body weight records and fasting glucose levels recorded 12 weeks after the AAV injection are shown (n = 14).
Serum analysis using a colorimetric‐based serum analyzer. Levels of triglycerides, total bile acids, alanine aminotransferase (ALT), aspartate aminotransferase (AST) and lactate dehydrogenase (LDH) are shown (n = 7–8).
Colorimetric measurement of total cholesterol and cholesteryl ester within the liver as well as liver weight (in % relative to the total body weight) are shown (n = 7–8).
Liver morphology analyzed via hematoxylin and eosin staining and detection of connective collagenous tissue via Sirius red staining (representative images; scale bar = 100 μm). The digital quantification of lipid vacuoles per tissue area is shown.

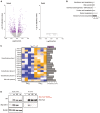
Volcano plots illustrating the genes that are significantly up‐ or downregulated in the liver of obese mice expressing the Prox1 K556R mutant in comparison to obese mice expressing wild‐type Prox1 in the fasted and refed states (n = 7–8).
Results of a pathway enrichment analysis (KEGG) of the differentially expressed genes in the fasted state.
Heatmap displaying the expression of enriched genes involved in phase I, II and III of bile acid detoxification and bile acid synthesis in the liver of obese mice expressing the Prox1 K556R mutant (Cre_AAV) in comparison with obese mice expressing wild‐type Prox1 (Ctrl_AAV) in the fasted state (n = 4). The occupation scores according to a published Chip‐ sequencing analysis on Prox1 (Armour et al, 2017) are shown. Cyp7a1 was used as a reference gene.
Prox1/LRH‐1 co‐immunoprecipitation in HEK293A cells overexpressing HA‐tagged Prox1 wild‐type (wt) or K556R mutant (KR) and Myc‐tagged LRH‐1.

HEK293A cells overexpressing mouse HA‐tagged wild‐type Prox1 (wt), K556R mutant (KR) or E558A mutant (EA) were treated with cycloheximide (CHX) for 6 and 8 h. The cell lysates were analyzed by immunoblotting using anti‐HA and anti‐β actin antibodies.
HepG2 cells overexpressing mouse YFP‐tagged wild‐type Prox1 (wt) or K556R mutant were analyzed by fluorescence microscopy (magenta), DNA was stained with DAPI (blue); (representative images; scale bar = 20 μm).
The nuclei from HepG2 cells were isolated and used for protein extraction. Multiple nuclear extracts were prepared using different concentrations of NaCl (110, 230, 350 or 420 mM). Total samples collected before cell lysis (T), the cytoplasmic extracts (CE) and the nuclear extracts (NE) were analyzed by immunoblotting using anti‐Prox1 antibodies. The chromatin binding factor RCC1 and tubulin were used as controls.
Prox1/PXR and Prox1/HNF4α co‐immunoprecipitation in HEK293A cells overexpressing HA‐tagged Prox1 wild‐type (wt) or K556R mutant (KR) and Myc‐tagged PXR or HNF4α.
References
-
- Alnouti Y (2009) Bile acid sulfation: a pathway of bile acid elimination and detoxification. Toxicol Sci 108: 225–246 - PubMed
-
- Alpini G, Ueno Y, Glaser SS, Marzioni M, Phinizy JL, Francis H, Lesage G (2001) Bile acid feeding increased proliferative activity and apical bile acid transporter expression in both small and large rat cholangiocytes. Hepatology 34: 868–876 - PubMed
-
- Azuma K, Urano T, Watabe T, Ouchi Y, Inoue S (2011) PROX1 suppresses vitamin K‐induced transcriptional activity of Steroid and Xenobiotic Receptor. Genes Cells 16: 1063–1070 - PubMed
Associated data
- Actions
- Actions
Grants and funding
LinkOut - more resources
Full Text Sources
Molecular Biology Databases

