. 2023 Nov 16;14(1):7406.
doi: 10.1038/s41467-023-43150-0.

Mesenchymal stromal cells alleviate depressive and anxiety-like behaviors via a lung vagal-to-brain axis in male mice

Affiliations

Mesenchymal stromal cells alleviate depressive and anxiety-like behaviors via a lung vagal-to-brain axis in male mice

Jing Huang et al. Nat Commun. .

Abstract

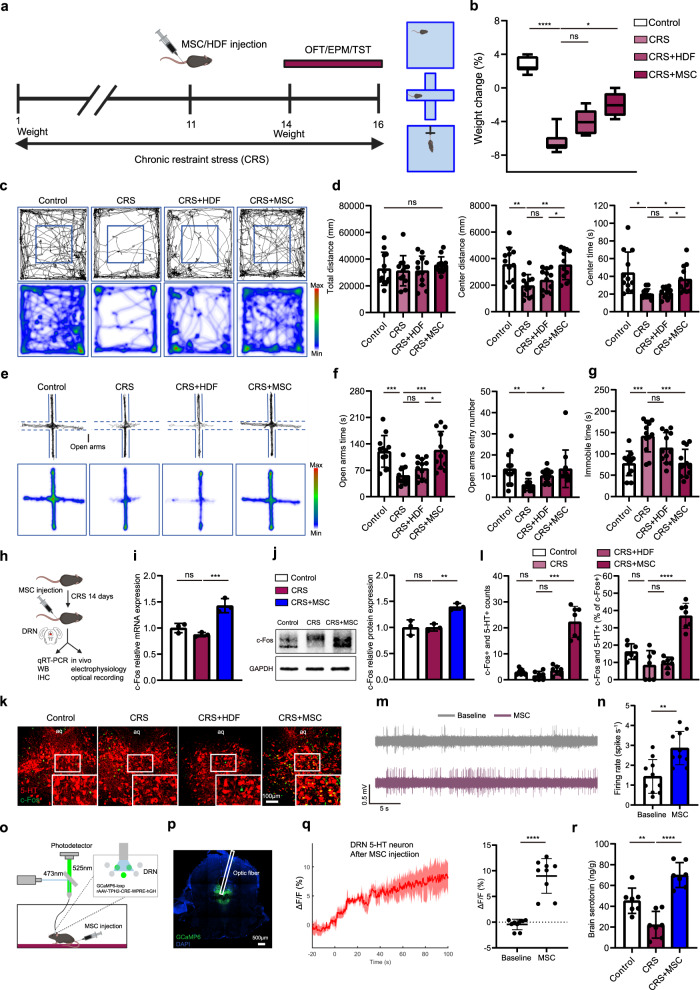
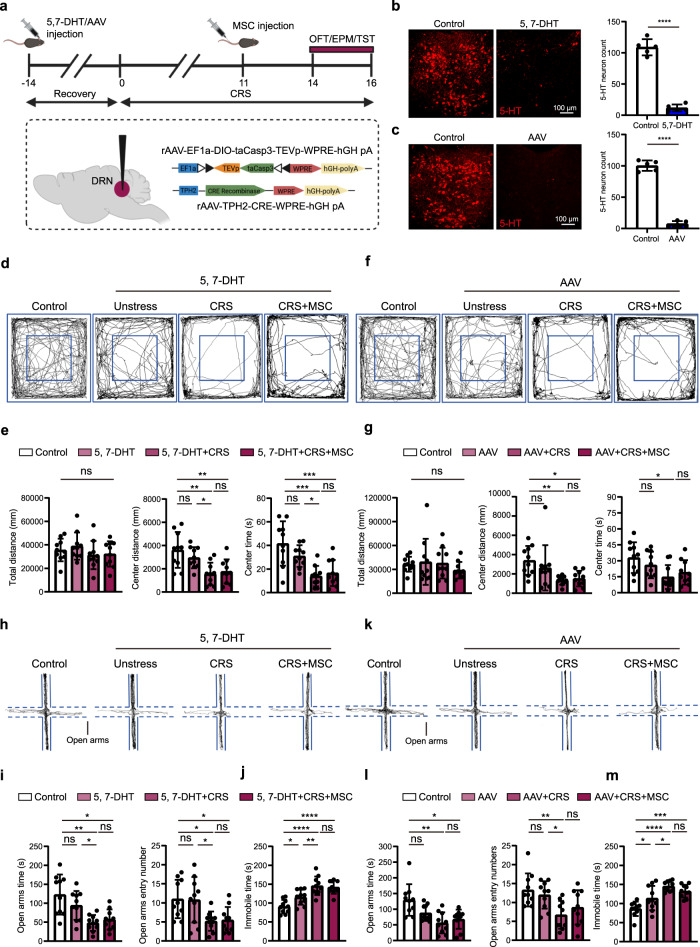
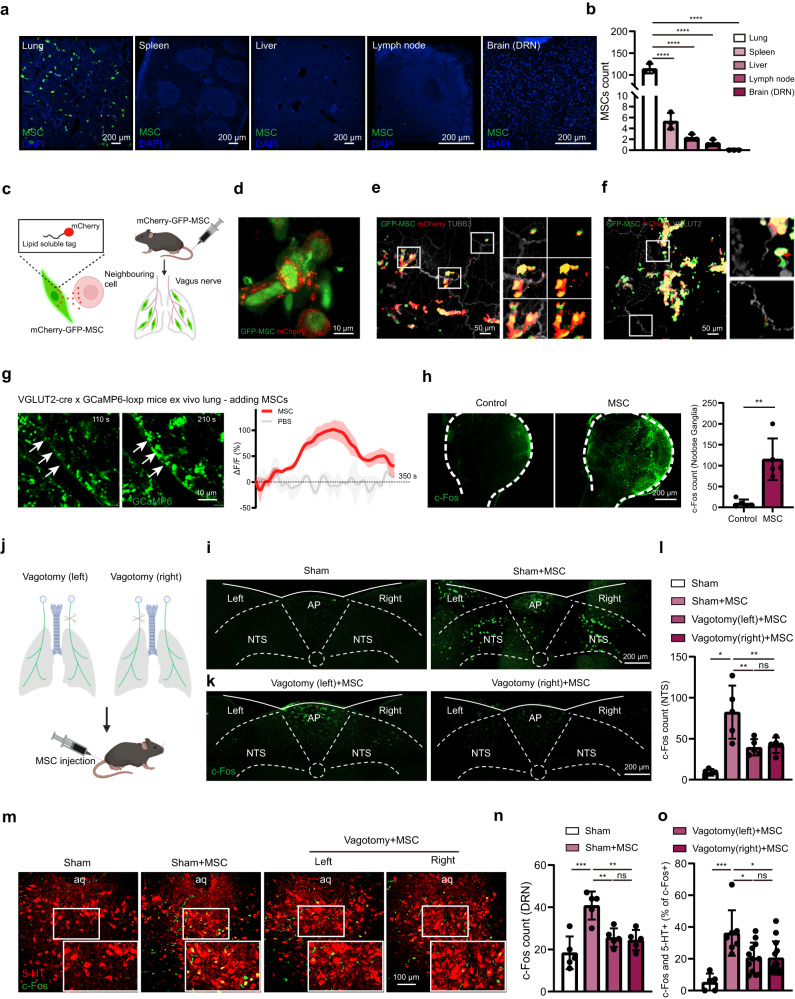
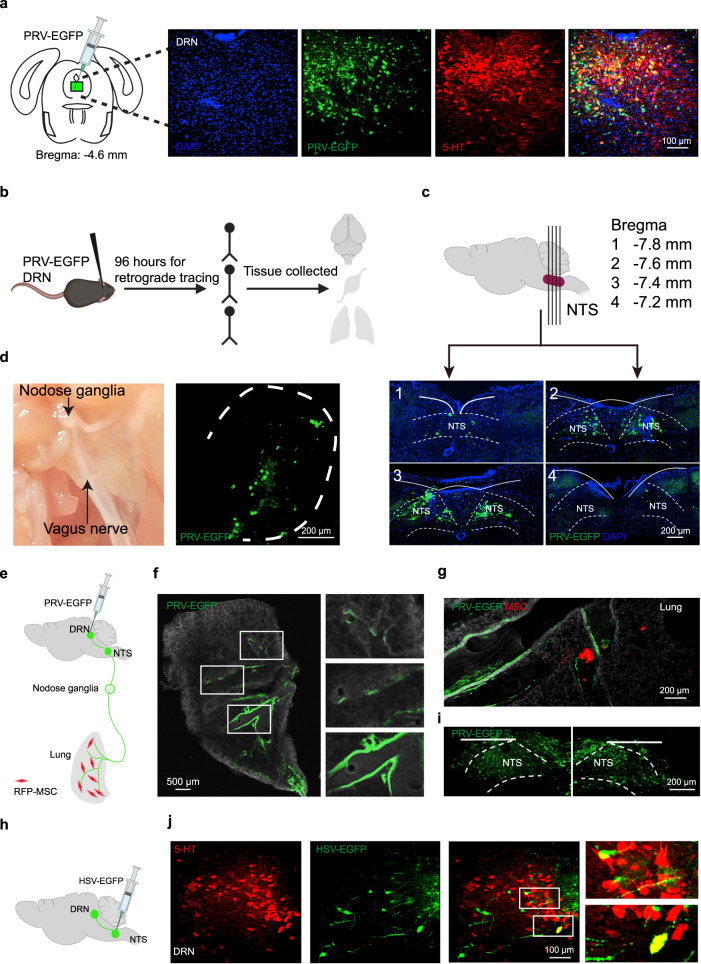
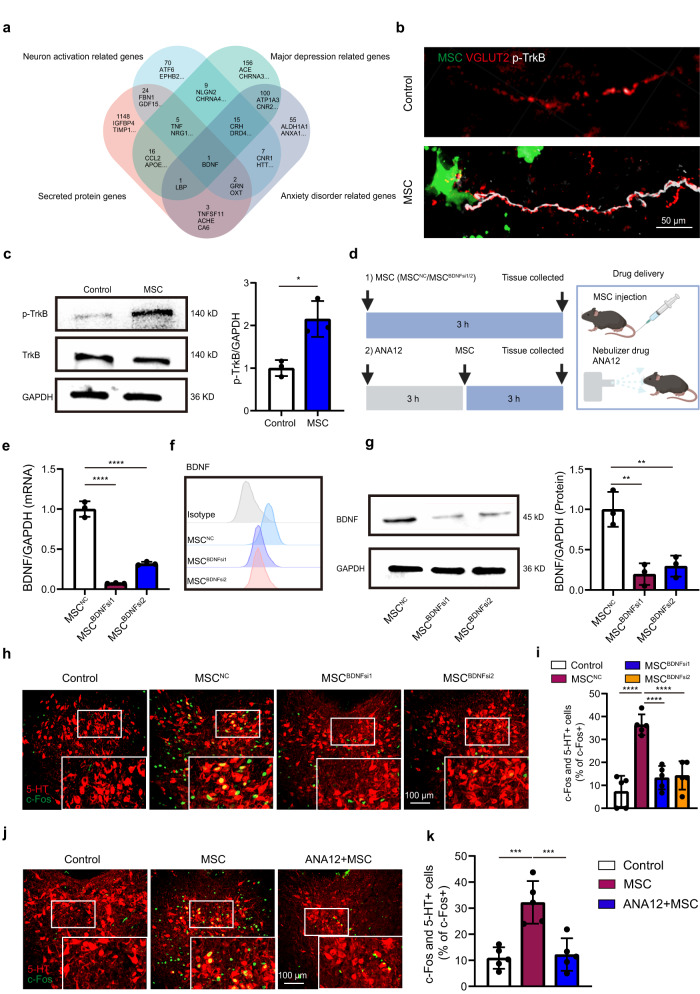
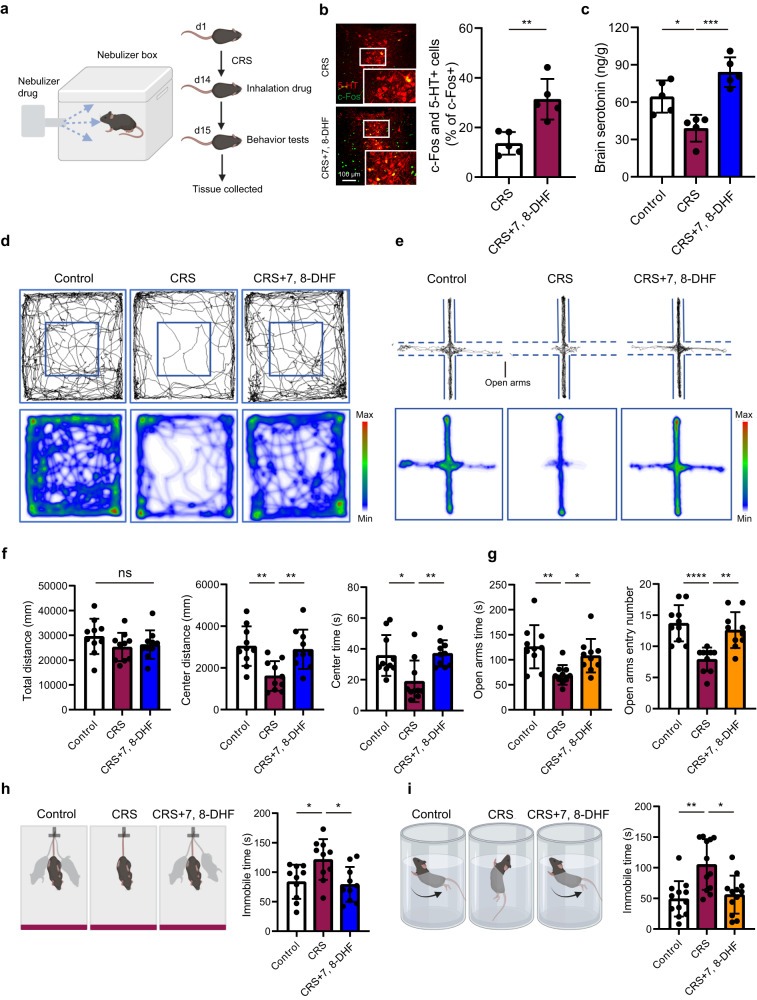
Major depressive disorder (MDD) is one of the most common and disabling mental disorders, and current strategies remain inadequate. Although mesenchymal stromal cells (MSCs) have shown beneficial effects in experimental models of depression, underlying mechanisms remain elusive. Here, using murine depression models, we demonstrated that MSCs could alleviate depressive and anxiety-like behaviors not due to a reduction in proinflammatory cytokines, but rather activation of dorsal raphe nucleus (DRN) 5-hydroxytryptamine (5-HT) neurons. Mechanistically, peripheral delivery of MSCs activated pulmonary innervating vagal sensory neurons, which projected to the nucleus tractus solitarius, inducing the release of 5-HT in DRN. Furthermore, MSC-secreted brain-derived neurotrophic factor activated lung sensory neurons through tropomyosin receptor kinase B (TrkB), and inhalation of a TrkB agonist also achieved significant therapeutic effects in male mice. This study reveals a role of peripheral MSCs in regulating central nervous system function and demonstrates a potential "lung vagal-to-brain axis" strategy for MDD.


Conflict of interest statement

The authors declare no competing interests.

Figures

Fig. 1
Fig. 1. MSCs attenuate depressive and anxiety-like behaviors.
a Schematic of the experimental timeline. HDF, human dermal fibroblast. b Body weight changes after CRS. Kruskal-Wallis test: **** P = 0.0000094. n = 8 mice. c, d Representative traces and statistical analysis of OFT. Total distance, one-way ANOVA: F(3, 44) = 0.46 ns P = 0.71. Center distance, one-way ANOVA: F(3, 44) = 7.4 *** P = 0.00039. Center time, Brown-Forsythe ANOVA test: *** P = 0.00094. n = 12 mice. e, f Representative traces and statistical analysis of EPM. Open arms time, one-way ANOVA: F(3, 44) = 9.9 **** P = 0.000042. Open arms entry number, Kruskal-Wallis test: ** P = 0.0018. n = 12 mice. g Statistical analysis of TST. One-way ANOVA: F(3, 44) = 10.16 **** P = 0.000033. n = 12 mice. h Schematic illustrating experimental protocol. i qRT-PCR detection. One-way ANOVA: F(2, 6) = 27.49 *** P = 0.0010. n = 3 biologically independent samples. j Western blot detection. One-way ANOVA: F(2, 6) = 15.94 ** P = 0.0040. n = 3 biologically independent samples. k, l Representative images and quantification of 5-HT and c-Fos colocalization. Scale bar, 100 µm. c-Fos+ and 5-HT+ count, Brown-Forsythe ANOVA test: ****P = 0.0000044. c-Fos+ and 5-HT+ (% of c-Fos + ), one-way ANOVA: F(3, 24) = 31.38 **** P = 0.000000018. n = 7 mice. m Representative traces of electrical activity in stressed mice. n Firing rates. Two-tailed t test: t = 3.785, df = 18, ** P = 0.0014. n = 10 neurons from three independent experiments. o Schematic diagram for optic fiber recordings. p Representative image showing GCaMP6 expression in DRN. q Representative traces of integrated calcium signals from 5-HTDRN neurons. Statistical analysis. Two-tailed t test: t = 8.036, df = 16, **** P = 0.00000052. n = 9 mice. r The 5-HT level change. One-way ANOVA: F(2, 18) = 26.29 **** P = 0.0000045. n = 7 mice. Illustrations created with BioRender.com. Source data are provided as a Source Data file.
Fig. 2
Fig. 2. MSCs potentially exert an antidepressant effect through 5-HTDRN neurons.
a Schematic diagram showing the experimental procedures. b Representative images and quantification showing that 5-HT neurons in the DRN were eliminated by 5, 7-DHT injection. Scale bar, 100 µm. Two-tailed t test: t = 15.43, df = 8, **** P = 0.00000031. n = 5 mice. 5, 7-DHT, 5,7-Dihydroxytryptamine. c Representative images and quantification showing that 5-HT neurons in the DRN were eliminated by AAV injection to overexpress Caspase3. Scale bar, 100 µm. Two-tailed t test: t = 22.12, df = 8, **** P = 0.000000018. n = 5 mice. d, f Representative activity tracking in the OFT. e, g Statistical analysis of the total distance, the center distance, and the center time. e Total distance, one-way ANOVA: F(3, 36) = 0.9807 ns P = 0.41. e Center distance, one-way ANOVA: F(3, 36) = 7.363 *** P = 0.00057. e Center time, one-way ANOVA: F(3, 36) = 10.50 **** P = 0.000042. g Total distance, Kruskal-Wallis test: ns P = 0.46. g Center distance, Kruskal-Wallis test: ** P = 0.0043. g Center time, one-way ANOVA: Treatment F(3, 36) = 4.097 * P = 0.013. n = 10 mice. h, k Representative activity tracking in the EPM. i, l Statistical analysis of the time spent in and entry numbers to open arms. (i) Open arms time, Brown-Forsythe ANOVA test: *** P = 0.00037. (i) Open arms entry number, one-way ANOVA: F(3, 36) = 5.219 ** P = 0.0043. l Open arms time, Kruskal-Wallis test: ** P = 0.0030. l Open arms entry number, one-way ANOVA: F(3, 36) = 5.485 ** P = 0.0033. n = 10 mice. j, m Statistical analysis of the immobile time in the TST. j Immobile time, one-way ANOVA: F(3, 36) = 16.4 **** P = 0.00000070. m Immobile time, one-way ANOVA: F(3, 36) = 14.25 **** P = 0.0000028. n = 10 mice. Illustrations created with BioRender.com. Source data are provided as a Source Data file.
Fig. 3
Fig. 3. Lung-innervating sensory neurons mediate the activation of 5-HTDRN neurons by peripheral MSCs.
a Representative images from three independent experiments showing GFP-MSC distribution. Scale bar, 200 µm. b Quantification of GFP-MSCs. One-way ANOVA: F(4, 10) = 303.6 **** P = 0.00000000022. n = 3 mice. c Label design for mCherry-GFP-MSCs. d Representative image from three independent experiments showing that GFP-MSCs co-expressed mCherry. Scale bar, 10 µm. e Representative image from three independent experiments showing the colocalization between mCherry secreted from MSCs and pulmonary nerves (TUBB3). Scale bar, 50 µm. f Representative image showing from three independent experiments the colocalization between mCherry secreted from MSCs and pulmonary vagal nerves (VGLUT2). Scale bar, 50 µm. g Representative sequential images from three independent experiments displaying calcium signal response to MSC suspensions inside the ex-vivo lungs of VGLUT2-GCaMP6 mice. Arrow points to a region showing an increase in GCaMP6 fluorescence. Scale bar, 10 µm. n = 3 mice. Right, real-time changes in fluorescence intensity were expressed as percentage changes over baseline ((F-F0)/F0). h Representative images and statistical analysis showing the expression of c-Fos in nodose ganglia. Scale bar, 200 µm. Two-tailed t test: t = 4.685, df = 8 ** P = 0.0016. n = 5 mice. i Representative images from three independent experiments showing the NTS c-Fos expression. Scale bar, 200 µm. AP, area postrema. j The experimental procedures. k Representative images from three independent experiments showing the NTS c-Fos expression. Scale bar, 200 µm. l Statistical analysis of the NTS c-Fos expression. Brown-Forsythe ANOVA test: ** P = 0.0046. n = 5 mice from three independent experiments. m Representative images showing the colocalization of 5-HT and c-Fos in the DRN. Scale bar, 100 µm. aq, mesencephalic aqueduct. n Statistical analysis of the DRN c-Fos expression. One-way ANOVA: F(3, 16) = 12.32 *** P = 0.00020. n = 5 mice. o Statistical analysis of the colocalization of 5-HT and c-Fos. One-way ANOVA: F(3, 33) = 8.545 *** P = 0.00024. n = 5, 7, 12, 13 mice separately. Illustrations created with BioRender.com. Source data are provided as a Source Data file.
Fig. 4
Fig. 4. MSCs relay neural signals to the DRN via pulmonary sensory nerves.
a Polysynaptic pseudorabies PRV-GFP was injected into the DRN (Bregma: −4.6 mm). Representative images show that the infected neurons were mainly 5-HT neurons. Scale bar, 100 µm. b Schematic diagram showing the experimental procedures. c–f Dense retrograde labeling was observed in the NTS from slices 1–4 (Bregma: −7.8 mm,−7.6 mm, −7.4 mm, −7.2 mm, respectively; scale bar, 200 µm) (c), in the nodose ganglion (scale bar, 200 µm) (d), and in the lung (scale bar, 500 µm) (f). Schematic diagram of the retrograde transduction of PRV across synapses from the DRN region to the lung (e). g Representative images showing that RFP-MSCs were located in close proximity to PRV-GFP-marked fibers in the lungs. Scale bar, 200 µm. h, i The polysynaptic herpes simplex virus, HSV-GFP, was injected bilaterally into the NTS. Scale bar, 200 µm. j Representative images showing the HSV-GFP-infected 5-HT neurons within the DRN. Scale bar, 100 µm. Figure 4a, d, f–g, j are the representative images from three independent experiments. Illustrations created with BioRender.com. Source data are provided as a Source Data file.
Fig. 5
Fig. 5. MSCs activate 5-HT neurons via brain-derived neurotrophic factor (BDNF).
a Venn diagram showing that the factors secreted by MSCs are involved in regulating neuron activation, major depression, and anxiety disorders. b Representative immunofluorescence images from three independent experiments showing that MSCs in the lungs activated phosphorylated TrkB (p-TrkB) in VGLUT2 nerves. Scale bar, 50 µm. c Representative image and quantification of western blot showing that MSC injection increased the level of p-TrkB in the lungs. Two-tailed t test: t = 4.324, df = 4, * P = 0.0124. n = 3 biologically independent samples. d Schematic diagram showing the experimental procedures used for MSC treatment and drug inhalation. qRT-PCR analysis (e), flow cytometric analysis (f), and western blot analysis (g) confirming the siRNA-mediated downregulation of BDNF in MSCs. n = 3. e one-way ANOVA: F(2, 6) = 209.6 **** P = 0.0000028. g one-way ANOVA: F(2, 6) = 21.07 ** P = 0.0019. n = 3 biologically independent samples. h Representative stained images of 5-HT and c-Fos colocalization in each group. Scale bar, 100 µm. i Statistical analysis of 5-HT and c-Fos colocalization. One-way ANOVA: F(3, 16) = 209.6 **** P = 0.0000030. n = 5 mice. j Representative immunofluorescence images of 5-HT and c-Fos colocalization in each group. Scale bar, 100 µm. k Statistical analysis of 5-HT and c-Fos colocalization. One-way ANOVA: F(2, 12) = 209.6 *** P = 0.00028. n = 5 mice. Illustrations created with BioRender.com. Source data are provided as a Source Data file.
Fig. 6
Fig. 6. Inhalation of a TrkB agonist as a promising depression and anxiety treatment in CRS mice.
a Schematic diagram showing the experimental procedures related to 7, 8-DHF inhalation by CRS mice. b Representative immunofluorescence images showing 5-HT and c-Fos colocalization changes in the DRN after the inhalation treatment. Scale bar, 100 µm. Bar chart showing the statistical analysis of 5-HT and c-Fos colocalization in the DRN. Two-tailed t test: t = 4.256, df = 8 ** P = 0.0028. n = 5 mice. c Changes in 5-HT levels in the brain homogenate supernatants after 7, 8-DHF inhalation treatment. One-way ANOVA: F(2, 12) = 18.07 *** P = 0.00024. n = 5 mice. d Representative locomotion tracks and heatmaps in OFT evaluating the antidepressant effects of the 7, 8-DHF inhalation treatment in CRS mice. e Representative activity tracks and heatmaps in the EPM for mice of each group. f Statistical analysis of the total distance, the distance traveled in the center field, and the time spent in the center field of the OFT for mice of each group. Total distance, one-way ANOVA: F(2, 27) = 1.307 ns P = 0.29. Center distance, one-way ANOVA: F(2, 27) = 8.054 ** P = 0.0018. Center time, Kruskal-Wallis test: ** P = 0.0066. n = 10 mice. g Statistical analysis of the time spent in and entry numbers to open arms in the EPM for mice of each group. Open arms time, one-way ANOVA: F(2, 27) = 7.380 ** P = 0.0028. Open arms entry numbers, one-way ANOVA: F(2, 27) = 13.97 **** P = 0.000068. n = 10 mice. h Representative tracking of activity in the TST and statistical analysis of the duration of immobility in the TST for mice of each group. One-way ANOVA: F(2, 27) = 5.581 ** P = 0.0094. n = 10 mice. i Representative schematic diagram of the FST and statistical analysis of the duration of immobility in the FST for mice of each group. Kruskal-Wallis test: ** P = 0.0040. n = 12 mice. Illustrations created with BioRender.com. Source data are provided as a Source Data file.

References

    1. Thapar A, Collishaw S, Pine DS, Thapar AK. Depression in adolescence. Lancet. 2012;379:1056–1067. doi: 10.1016/S0140-6736(11)60871-4. - DOI - PMC - PubMed
    1. Lichtenberg P, Belmaker RH. Subtyping major depressive disorder. Psychother. Psychosomatics. 2010;79:131–135. doi: 10.1159/000286957. - DOI - PubMed
    1. Oh S-J, et al. Hippocampal mossy cell involvement in behavioral and neurogenic responses to chronic antidepressant treatment. Mol. Psychiatry. 2020;25:1215–1228. doi: 10.1038/s41380-019-0384-6. - DOI - PubMed
    1. Fox ME, Lobo MK. The molecular and cellular mechanisms of depression: a focus on reward circuitry. Mol. Psychiatry. 2019;24:1798–1815. doi: 10.1038/s41380-019-0415-3. - DOI - PMC - PubMed
    1. Hashimoto K. Rapid-acting antidepressant ketamine, its metabolites and other candidates: A historical overview and future perspective. Psychiatry Clin. Neurosci. 2019;73:613–627. doi: 10.1111/pcn.12902. - DOI - PMC - PubMed

Publication types