. 2024 Nov 14;15(1):9868.
doi: 10.1038/s41467-024-54152-x.

The emergence of Sox and POU transcription factors predates the origins of animal stem cells

Affiliations

The emergence of Sox and POU transcription factors predates the origins of animal stem cells

Ya Gao et al. Nat Commun. .

Abstract

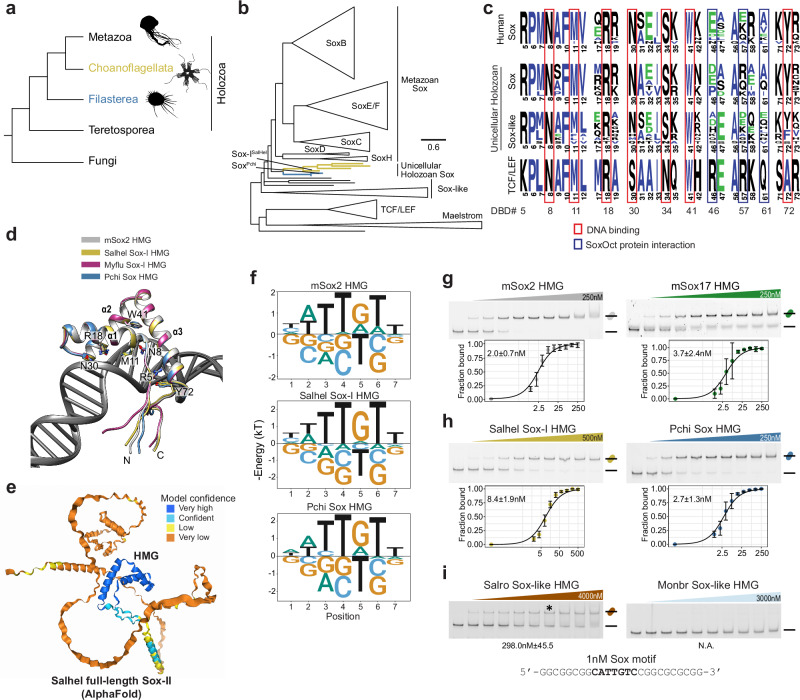
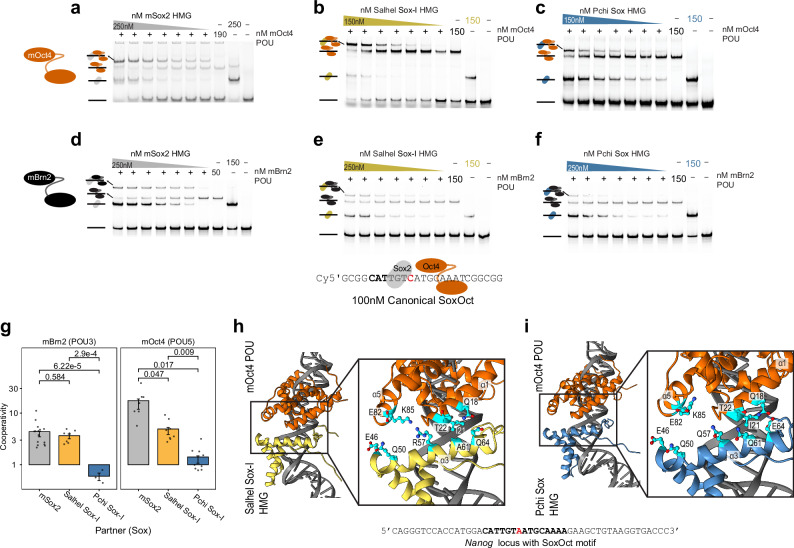
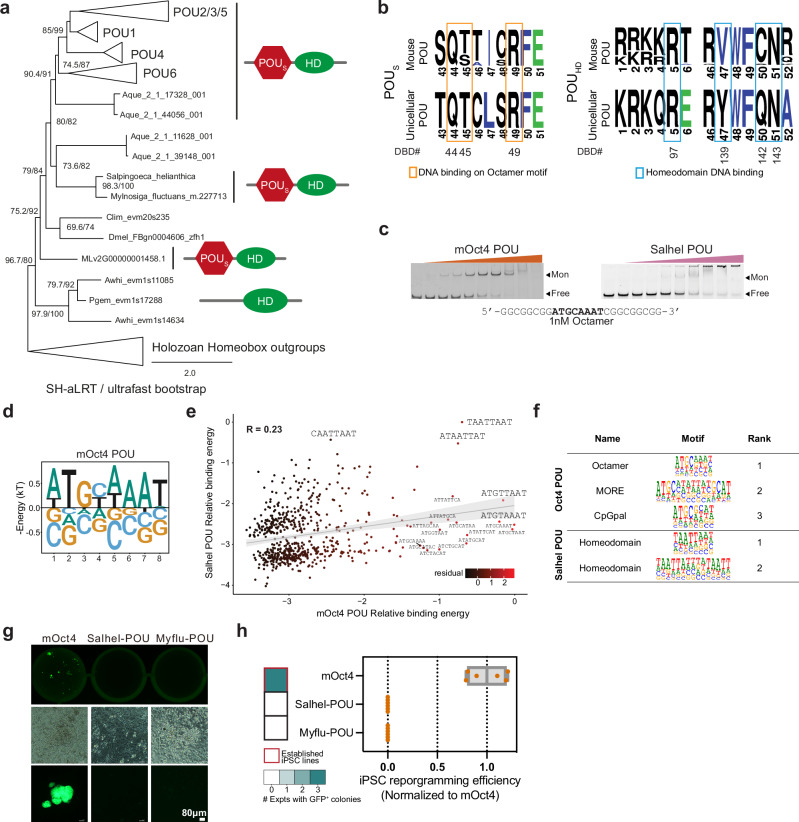
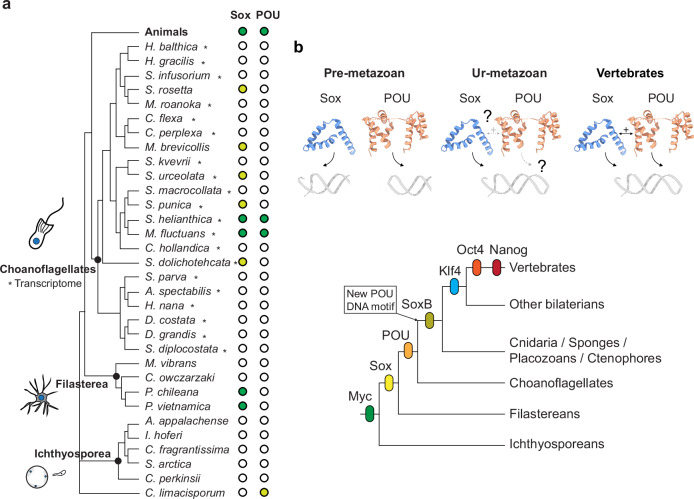
Stem cells are a hallmark of animal multicellularity. Sox and POU transcription factors are associated with stemness and were believed to be animal innovations, reported absent in their unicellular relatives. Here we describe unicellular Sox and POU factors. Choanoflagellate and filasterean Sox proteins have DNA-binding specificity similar to mammalian Sox2. Choanoflagellate-but not filasterean-Sox can replace Sox2 to reprogram mouse somatic cells into induced pluripotent stem cells (iPSCs) through interacting with the mouse POU member Oct4. In contrast, choanoflagellate POU has a distinct DNA-binding profile and cannot generate iPSCs. Ancestrally reconstructed Sox proteins indicate that iPSC formation capacity is pervasive among resurrected sequences, thus loss of Sox2-like properties fostered Sox family subfunctionalization. Our findings imply that the evolution of animal stem cells might have involved the exaptation of a pre-existing set of transcription factors, where pre-animal Sox was biochemically similar to extant Sox, whilst POU factors required evolutionary innovations.


Conflict of interest statement

Competing interests The authors declare no competing interests.

Figures

Fig. 1
Fig. 1. Unicellular relatives of animals encode Sox transcription factors.
a Phylogeny of holozoans and (b) Reduced phylogenetic tree of animal and unicellular Sox. c Sequence logos representing the High Mobility Group (HMG) domain of human Sox genes, Sox-like sequences found in unicellular holozoans, and human TCF/LEF genes. Residues reported to direct DNA and protein interactions are boxed in red and blue, respectively,,. d Structural Models of the Sox2 DNA binding domains (DBD) superimposed with HMG Salpingoeca helianthica (Salhel), Mylnosiga fluctuans (Myflu), and Pigoraptor chileana (Pchi). e The predicted protein structure of full-length Salhel Sox-I by AlphaFold3, with model confidence color-coded. f Energy logos derived from Spec-seq using a set of sequences with one nucleotide difference to the consensus Sox motif (CATTGTT). gi Binding of the HMG box DBD with apparent Kd shown as mean ± SD (n = independent experiments) (g) mouse Sox2 (n = 4), and Sox17 (n = 3), (h) Salhel Sox-I (n = 3) and Pchi Sox (n = 5), and (i) Sox-like sequences from Salpingoeca rosetta (Salro) (The asterisk shows the lane with 250 nM protein which is the highest concentration used for Pchi Sox) and Monosiga brevicollis (Monbr) to consensus Sox DNA (n = 3). The silhouettes of the species are sourced from PhyloPic (http://phylopic.org). Source data and statistics are provided as a Source Data file.
Fig. 2
Fig. 2. Choanoflagellate Sox can induce pluripotency in mammalian cells.
a Schematic illustration of the procedure of mouse induced pluripotent stem cell (iPSC) reprogramming from mouse embryonic fibroblasts (MEFs) carrying an Oct4-GFP reporter (OG2MEFs) and the establishment of clonal iPSC line for pluripotency validation. b Representative microscope images show iPSC colonies generated by mSox2 and Sox factors of Choanoflagellates on reprogramming day 14. Scale bar, 80μm. Chimeric-Salhel-I (Chimeric-Salhel-Sox-I), HMG of Salhel-Sox-I fused with mSox2 NTD and CTD; Salhel-Sox-I, full-length Salhel Sox-I; Salhel-Sox-II, full-length Salhel Sox-II; Myflu-Sox-I, full-length Myflu Sox-I; Myflu-Sox-II, full-length Myflu Sox-II. c Quantification of iPSC reprogramming efficiency by Sox variants. The heatmap depicts the number of experiments with observation of GFP-positive colonies, with the red frame highlighting the ability of the variants to produce iPSCs with confirmed pluripotency through the establishment of stable clonal iPSC lines. Chim-Salhel-I, Chimeric-Salhel-Sox-I; Chim-Pchi, Chimeric-Pchi-Sox. The box plot shows the reprogramming efficiency of Sox variants normalized by the number of iPSC colonies generated by mSox2. (n = 7 technical replicates in total, 2 biological replicates each with 2 technical replicates and 1 biological replicates including 3 technical replicates). The box displays the interquartile range, with the left edge representing the lower quartile (25th percentile) and the right edge indicating the upper quartile (75th percentile). The median value is shown as a line splitting the box. The silhouettes of the species are sourced from PhyloPic (http://phylopic.org). d Representative images of iPSC colonies derived from MEFs carrying a Sox2-GFP reporter on reprogramming day 14. Scale bar, 80 μm. e Expression of pluripotency markers of clonal iPSC lines derived by choanoflagellate Sox examined by immunocytochemistry staining. Scale bar, 40μm. f Immunocytochemistry of differentiated iPSC lines stained for markers of the 3 germ layers: Class III beta-tubulin (Tuj1), Forkhead box protein A2 (FoxA2), α-smooth muscle actin (SMA). Scale bar, 40 μm. g Chimeric mice generated from full-length Salhel-Sox-I iPSC lines displaying black coat patches and eyes (indicated by arrows) representing their iPSC origin, in contrast to the wildtype mouse exhibiting a white coat and red eyes. The illustration for (a) was created in BioRender. Gao, Y. (2022) BioRender.com/z21g065. d n = 2 replicates; (e, f) n = 3 replicates. Source data and statistics are provided as a Source Data file.
Fig. 3
Fig. 3. Choanoflagellate Sox can partner with Oct4 (POU5) and Brn2 (POU3) on DNA elements found in mammalian pluripotency enhancers.
af Heterodimer EMSAs with 50 or 100 nM Cy5 labeled canonical SoxOct DNA elements to monitor the heterodimer formation of POU factors (ac) 150–190 nM mOct4 or (df) 50 nM mBrn2 with Sox factors - (ad) mSox2 (ae) Salhel Sox-I or (cf) Pchi Sox HMG. POU factors are kept at a constant concentration indicated by + signs, triangles indicate different concentrations of Sox with the highest concentration indicated, and – sign indicates absences of either Sox or POU or both for controls. g Quantifications of heterodimer EMSAs and calculation of cooperativity factors according to (Ng et al. 2012) with the y axis depicted in log10 scale (mean ± SEM) with n = independent experiments. Oc4/Sox2 (n = 4), Oc4/Pchi Sox (n = 3), Oct4/Salhel Sox-I (n = 4) and Brn2 with Sox2, Pchi Sox and Salhel Sox-I (n = 3). Adjusted p-values are shown and were determined from a Games-Howell test with a 0.95 confidence interval after Bartlett test of homogeneity for each dataset (mOct4 - p = 2.06E-08, mBrn2 p = 0.003637) and Kruskal-Wallis test(One-way). h, i Structural models of heterodimer complexes on canonical SoxOct motifs of (f) Salhel Sox-I HMG-mOct4 POU complex or (g) Pchi Sox HMG-mOct4 POU complex highlighting differences at the heterodimer interface (i.e. positions 57, 61 and 64 previously predicted to impact dimer formation). Source data and statistics are provided as a Source Data file.
Fig. 4
Fig. 4. Ancestral holozoan and animal Sox factors can induce pluripotency in mice.
a Section of the maximum likelihood phylogeny of holozoan Sox HMG domains used for ancestral sequence reconstruction. Colored spheres mark reconstructed nodes. The full phylogeny is shown in Supplementary Fig. 1. b Sequence alignment showing selected key residues of the ancestral Sox HMG domains reconstructed from the phylogeny shown in (a). The arrow marks residue 57, which is critical for the selective pairing with Oct4. c Representative microscope images of iPSC colonies on day 14. Scale bar, 80 μm. d Quantification of iPSC reprogramming efficiency normalized to the colony numbers of mSox2 on day 14 (n = 5 technical replicates in total, including 2 biological replicates each with 2 technical replicates and 1 biological replicates). The box displays the interquartile range, with the left edge representing the lower quartile (25th percentile) and the right edge indicating the upper quartile (75th percentile). The median value is shown as a line splitting the box. Source data and statistics are provided as a Source Data file.
Fig. 5
Fig. 5. Salhel POU cannot induce pluripotency and is unable to bind octamer DNA.
a Phylogenetic tree of holozoan homeodomains with a focus on POU branches. b Sequence logos of signature amino acids representing the bipartite POU domain of mouse and unicellular POU sequences. Residues reported to be relevant to DNA binding are boxed. c Binding of the POU of mOct4 and Salhel to consensus Octamer DNA (n = 3 independent experiments). d Energy logos derived from Spec-seq using a set of sequences with one nucleotide difference to the consensus Octamer motif (ATGCTAAT). e Correlation scatter plots of the relative binding affinities of mOct4 versus Salhel POU for all 705 sequences tested. R = Pearson’s correlation coefficient. The color indicates the residual score from the correlation line. f Top enriched motifs from high throughput-SELEX (3rd Cycle) for mOct4 and Salhel POU. g Whole well scan and representative microscopy images of generated iPSCs with activated GFP expression on reprogramming day 14. Scale bar, 80 μm. h Quantification of iPSC reprogramming efficiency of choanoflagellate POU factors normalized to the colony numbers of mOct4 on day 14 (n = 6, 3 biological replicates each with 2 technical replicates). The box displays the interquartile range, with the left edge representing the lower quartile (25th percentile) and the right edge indicating the upper quartile (75th percentile). The median value is shown as a line splitting the box. Source data and statistics are provided as a Source Data file.
Fig. 6
Fig. 6. Schematic evolutionary distribution of holozoan pluripotency regulators.
a Phylogenetic distribution of surveyed Holozoan species marked with the presence of Sox and POU factors (green), and Sox-like and POU-like (Homeobox without POUs domain) in yellow. Asterisks indicate that available data for the species is a transcriptome, whereas the rest are genome assemblies. b Schematic for the proposed evolutionary origins of the core members of the mammalian pluripotency regulatory network (Myc, Sox, POU, Klf4 and Nanog), with molecular changes acquired along the evolutionary tree. On top, the proposed model for the evolutionary innovation from pre-metazoans to vertebrates where POU factors became binders for the new octameric POU DNA motif which made them capable of the DNA-dependent heterodimer formation Sox.

References

    1. Sogabe, S. et al. Pluripotency and the origin of animal multicellularity. Nature570, 519–522 (2019). - PubMed
    1. Masui, S. et al. Pluripotency governed by Sox2 via regulation of Oct3/4 expression in mouse embryonic stem cells. Nat. Cell Biol.9, 625–635 (2007). - PubMed
    1. Niwa, H., Miyazaki, J. & Smith, A. G. Quantitative expression of Oct-3/4 defines differentiation, dedifferentiation or self-renewal of ES cells. Nat. Genet24, 372–376 (2000). - PubMed
    1. Dodonova, S. O., Zhu, F., Dienemann, C., Taipale, J. & Cramer, P. Nucleosome-bound SOX2 and SOX11 structures elucidate pioneer factor function. Nature580, 669–672 (2020). - PubMed
    1. Michael, A. K. et al. Mechanisms of OCT4-SOX2 motif readout on nucleosomes. Science368, 1460–1465 (2020). - PubMed

Publication types

MeSH terms

LinkOut - more resources