. 2024 Nov 11;15(1):9586.
doi: 10.1038/s41467-024-53789-y.

Evasion of antiviral bacterial immunity by phage tRNAs

Affiliations

Evasion of antiviral bacterial immunity by phage tRNAs

Aa Haeruman Azam et al. Nat Commun. .

Abstract

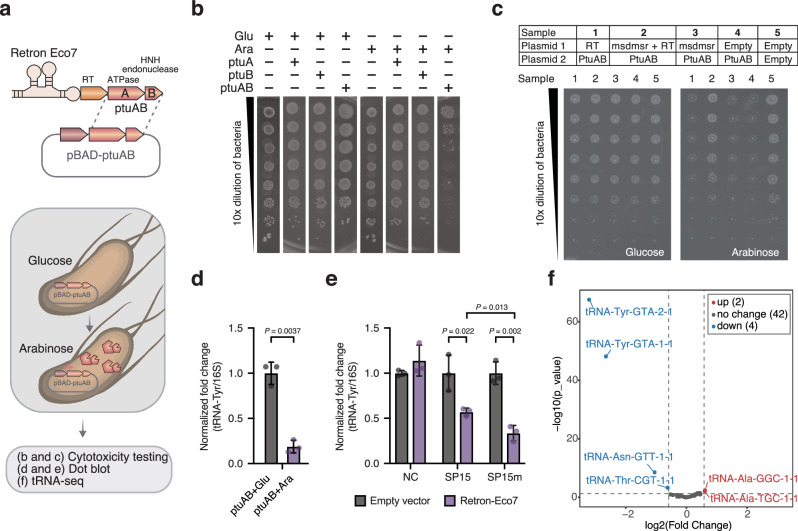
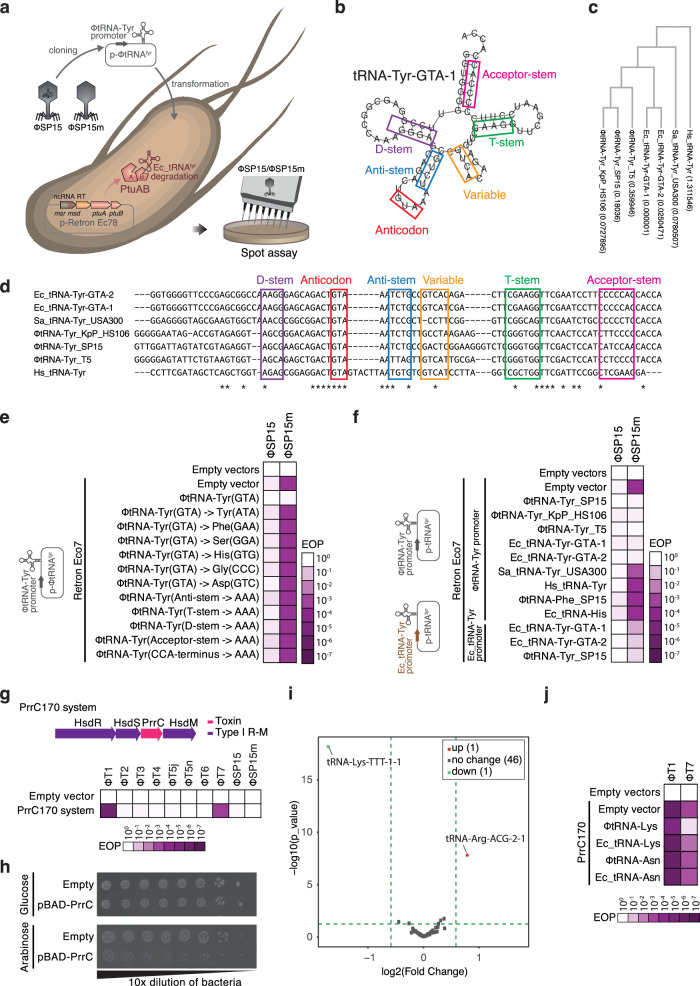
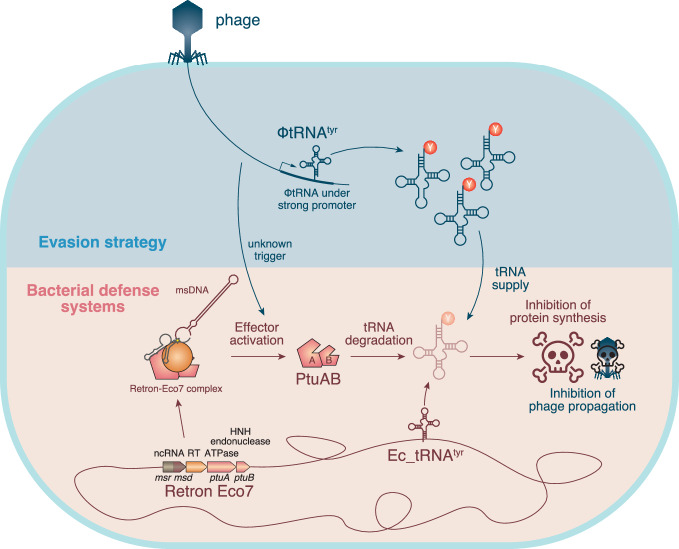
Retrons are bacterial genetic elements that encode a reverse transcriptase and, in combination with toxic effector proteins, can serve as antiphage defense systems. However, the mechanisms of action of most retron effectors, and how phages evade retrons, are not well understood. Here, we show that some phages can evade retrons and other defense systems by producing specific tRNAs. We find that expression of retron-Eco7 effector proteins (PtuA and PtuB) leads to degradation of tRNATyr and abortive infection. The genomes of T5 phages that evade retron-Eco7 include a tRNA-rich region, including a highly expressed tRNATyr gene, which confers protection against retron-Eco7. Furthermore, we show that other phages (T1, T7) can use a similar strategy, expressing a tRNALys, to counteract a tRNA anticodon defense system (PrrC170).


Conflict of interest statement

Competing interests A.H.A., Y.T., K.W., and K.Kiga are co-inventors on a pending patent submitted by the National Institute of Infectious Diseases, which is based on the results reported in this paper. The remaining authors declare no competing interests.

Figures

Fig. 1
Fig. 1. Identification of phage genes involved in retron evasion.
a Genomic comparison of T5 and T5-like phage SP15. The tRNA-rich region (TRR; genomic region of ~8 kb) in T5j and SP15, was missing in T5n and SP15m. Visualized using Clinker, the TRR is marked in green, and the highlighted TRR in SP15 is outlined with a brown box. This boxed line indicates the specific area chosen for further experiments. b Heatmap depicting the change in the efficiency of plating (EOP) of the phage assay on the bacteria carrying the defense system from Gao et al.. Bacteria carrying pLG001, labeled as Empty vector, served as the negative control. EOP was calculated by dividing the number of phage plaques on bacteria carrying the defense system by the number of phage plaques on bacteria carrying the empty vector. The names of retrons, specifically Ec67 (Eco2), Ec78 (Eco7), and Ec86 (Eco1), were updated based on the retron classification and nomenclature introduced by Mestre et al.. The photograph of the spot assay and the phage count graph are provided in Supplementary Fig. 2a, b. c Fragmentation of TRR from SP15. A TRR map, comprising the open reading frame (ORF) indicated in dark green and the tRNA in dark blue, is presented. The numerical annotations above the map correspond to the genomic positions in SP15 (accession number: AP019559). Synthetic fragments of TRR were produced through PCR, assembled into plasmid under pBAD inducible promoter, and subsequently introduced into bacteria that harbor retrons. d Genetic organization of the TRR fragment 6 (F6) and 8 (F8). Heatmap illustrating the EOP of phages on bacteria carrying retron-Eco7 (e) or Eco2 (f) and various TRR fragments; the photograph of the spot assay and the phage count graph are provided in Supplementary Fig. 3a–d. g Heatmap illustrating the EOP of phages on bacteria carrying retron-Eco2 and fragmented F8; the photograph of the spot assay and the phage count graph are provided in Supplementary Fig. 4a, b. h Heatmap illustrating the EOP of phages on bacteria carrying retron-Eco7 and fragmented F8 and F6. The photograph of the spot assay and the phage count graph are presented in Supplementary Fig. 4c–f. The phage assay used to calculate the EOP presented in this figure was performed in triplicate. Source data are provided as a Source Data File.
Fig. 2
Fig. 2. tRNATyr is the cellular target of retron Eco7 effector protein, PtuAB.
a Simplified depiction of the method used to evaluate the cellular targets of PtuAB of Eco7. Effector proteins were expressed under the pBAD inducible promoter. The induced cells were evaluated for their cytotoxicity (b), and the reduction in tRNATyr expression using dot blot RNA hybridization (d, e) and tRNA sequencing (f). b Bacterial growth arrest observed in bacteria overexpressing PtuAB. Single expression of either PtuA or PtuB did not promote growth arrest. To induce or repress the expression of PtuA, PtuB, or PtuAB, 0.2% arabinose (Ara) and 0.2% glucose (Glu) were added, respectively. c Identification of the antitoxin component in retron-Eco7 via co-expression of a plasmid encoding toxin, PtuAB, and plasmid encoding its antitoxin candidate. The toxin component, PtuAB, was expressed under the pBAD inducible plasmid. The antitoxin candidate (msrmsd, RT, or msrmsd-RT) was constitutively expressed under its native promoter from retron-Eco7. d Dot blot RNA hybridization depicting tRNATyr expression levels showed a significant decrease in bacteria where PtuAB was expressed (purple bar) compared to when PtuAB was repressed (dark grey bar). e Dot blot RNA hybridization depicting tRNATyr expression levels showed a significant decrease in bacteria infected with phage SP15 or SP15m in the presence of retron-Eco7 (purple bar) compared to those with the empty vector (dark grey bar). The 16S rRNA was used as the control. The dot blot figures, including the negative control using 16S rRNA sense oligonucleotide, are provided in Supplementary Figs. 6 and  7. The normalized fold change values in (d) and (e) represent the expression of tRNA relative to 16S rRNA, calculated using ImageJ. These values were normalized by dividing each fold change by the average fold change observed in non-induced PtuAB (d) or bacteria expressing an empty vector infected with phage (e). The experiments in (e) and (d) were performed in three biological replicates. Data are presented as mean values ± SD. Statistical significance is indicated by the P-value in the graph. Statistical analysis was performed using a two-tailed Student’s t-test, assuming equal variances. Source data are provided in the Source Data file. f Volcano plot depicting tRNA sequencing of bacteria carrying PtuAB under the pBAD inducible plasmid. Two tRNATyr (tRNA-GTA-1 and tRNA-GTA-2) were significantly downregulated in bacteria where PtuAB was induced compared to when PtuAB was repressed. The fold change was calculated based on the total tRNA expression level in bacteria under induction (arabinose added) versus repression (glucose added). The experiment was conducted in two biological replicates. Additional tRNA sequencing data comparing the induced PtuAB to the induced empty vector is available in Supplementary Fig. 6b. The log2(Fold Change) represents the difference in means between two groups, calculated as PtuAB-induce_CPM (Count per million) minus PtuAB-repress_CPM. The statistical significance was determined using the p-value from the exact test based on a negative binomial distribution. No adjustments for multiple comparisons were made.
Fig. 3
Fig. 3. Supplementation of phage-derived tRNA is strategy employed by phage to evade defense systems.
a Simplified depiction of the method used to evaluate tRNA complementation on bacteria carrying retron-Eco7. The complementation of tRNA was performed in trans by expressing the tRNA under either the phage tRNATyr promoter or the bacterial tRNATyr promoter and introducing it into bacteria carrying retron-Eco7. b RNAFold-based structural prediction of tRNATyr from E. coli (Ec-tRNA-GTA-1). The predicted secondary structure of the tRNA is highlighted with colored box lines: D-stem (purple), anticodon loop (red), anticodon stem (blue), variable loop (orange), T-stem (green), and acceptor stem (pink). c Phylogenetic tree of the tRNATyr used for the complementation experiment. The DNA alignment was performed using ClustalW, and the tree was generated using the bootstrap maximum likelihood method. The value inside the brackets indicates the bootstrap score. d Sequence alignment of tRNATyr from T5 (ΦtRNA-Tyr_T5), SP15 (ΦtRNA-Tyr_SP15), Klebsiella phage KpP_HS106 (ΦtRNA-Tyr_KpP_HS106), S. aureus (Sa_tRNA-Tyr_USA300), Homo sapiens (Hs_tRNA-Tyr), and E. coli tRNATyr (Ec-tRNA_Tyr-GTA-1 or Ec-tRNA_Tyr-GTA-2). Based on the predicted secondary structure of tRNATyr from E. coli, the loop, stem, and anticodon sequences are all highlighted using colored boxes. e Heatmap of phage EOP illustrating the mutation in different stem loops and changing the anticodon sequence of ΦtRNA-Tyr_SP15, which abolished the tRNA ability to rescue the phage from retron-Eco7. SP15 and SP15m were used in the phage assay. f Heatmap of phage EOP illustrating the expression of tRNATyr from different phages (ΦtRNA-Tyr_T5 and ΦtRNA-Tyr_KpP_HS106) or from E. coli in rescuing phages from retron-Eco7 in a promoter-dependent manner. The tRNA was expressed under either the phage tRNATyr promoter (ΦtRNA-Tyr promoter) or the E. coli tRNATyr promoter (Ec_tRNA-Tyr promoter). Hs_tRNA-Tyr, Sa_tRNA-Tyr_USA300, and E. coli tRNAHis (Ec_tRNA-His) were unable to rescue phages from retron-Eco7. The photograph of the spot assay and the phage count graph of the heatmaps in (e) and (f) are presented in Supplementary Fig. 10a–d. Source data are provided as a Source Data File. g Heatmap of phage EOP illustrating the antiphage function of the PrrC170 anticodon nuclease (named after isolate number 170 of carbapenem-resistant Klebsiella quasipneumoniae) against at least two phages, T1 and T7. The PrrC170 system comprises PrrC and an associated restriction-modification system type I, cloned in pLG001 plasmid under its native promoter. The photograph of the spot assay and the phage count graph are available in Supplementary Fig. 13a, b. Source data are provided as a Source Data File. h Growth arrest observed in bacteria expressing the PrrC toxin. The prrC gene was cloned under the pBAD inducible plasmid. i Volcano plot depicting tRNA sequencing of bacteria carrying the pBAD-PrrC toxin. The fold change was calculated based on the total tRNA expression level in bacteria under induction (arabinose added) versus repression (glucose added). The log2(Fold Change) represents the difference in means between two groups, calculated as PrrC-induce_CPM minus PrrC-repress_CPM. The statistical significance was determined using the p-value from the exact test based on a negative binomial distribution. No adjustments for multiple comparisons were made. j Heatmap of phage EOP illustrating the complementation of tRNALys from the SP15 (ΦtRNA-Lys) phage in rescuing phages from the PrrC170 defense system. Complementation of E. coli tRNALys (Ec_tRNA-Lys), E. coli tRNAAsn (Ec_tRNA-Asn), tRNAAsn from SP15 (ΦtRNA-Asn) did not rescue phage from PrrC170. The complementation was performed by expressing the tRNA in trans under phage tRNA promoter and introducing it into bacteria carrying PrrC170. The phage count graph is provided in Supplementary Fig. 13c. Source data are provided as a Source Data File.
Fig. 4
Fig. 4. Proposed mechanism of T5 phages circumventing the retron-Eco7 antiphage defense system.
The retron-Eco7 defense system operates as a tripartite toxin-antitoxin complex, where PtuAB acts as the toxin, and retron msDNA along with RT protein serve as the antitoxins. During phage infection, retron-Eco7 may be triggered by an unknown mechanism, potentially leading to the release and activation of PtuAB, which causes bacterial growth arrest by degrading bacterial tRNATyr, thereby preventing the phage from completing its replication cycle. However, T5 phages produce an abundance of their own tRNATyr using a strong promoter, effectively bypassing retron-Eco7 and ensuring successful phage replication.

References

    1. Millman, A. et al. Bacterial retrons function in anti-phage defense. Cell183, 1551–1561.e12 (2020). - PubMed
    1. Bobonis, J. et al. Bacterial retrons encode phage-defending tripartite toxin–antitoxin systems. Nature609, 144–150 (2022). - PMC - PubMed
    1. Gao, L. et al. Diverse enzymatic activities mediate antiviral immunity in prokaryotes. Science369, 1077–1084 (2020). - PMC - PubMed
    1. Yee, T., Furuichi, T., Inouye, S. & Inouye, M. Multicopy single-stranded DNA isolated from a gram-negative bacterium, Myxococcus xanthus. Cell38, 203–209 (1984). - PubMed
    1. Mestre, M. R., González-Delgado, A., Gutiérrez-Rus, L. I., Martínez-Abarca, F. & Toro, N. Systematic prediction of genes functionally associated with bacterial retrons and classification of the encoded tripartite systems. Nucleic Acids Res.48, 12632–12647 (2020). - PMC - PubMed

Publication types

Associated data