. 2011 Jul 12;20(1):66-78.
doi: 10.1016/j.ccr.2011.06.010.

MLL-rearranged leukemia is dependent on aberrant H3K79 methylation by DOT1L

Affiliations

MLL-rearranged leukemia is dependent on aberrant H3K79 methylation by DOT1L

Kathrin M Bernt et al. Cancer Cell. .

Abstract

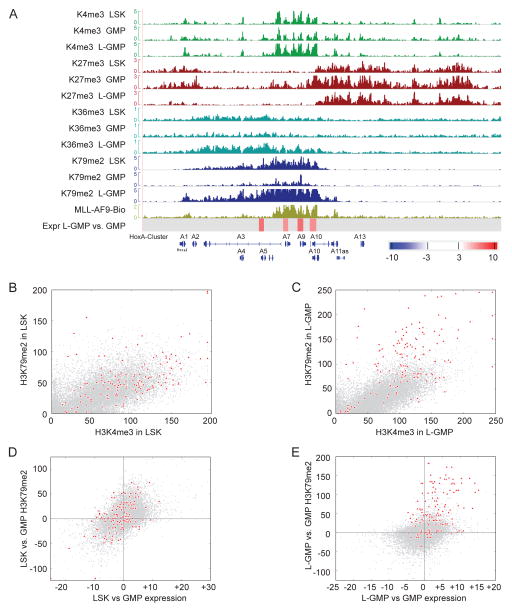
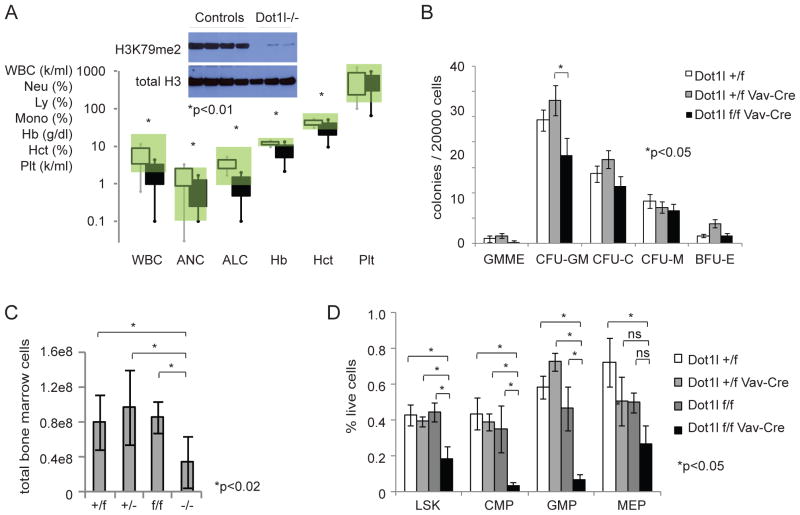
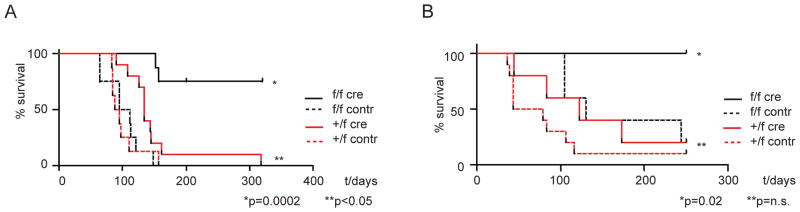
The histone 3 lysine 79 (H3K79) methyltransferase Dot1l has been implicated in the development of leukemias bearing translocations of the Mixed Lineage Leukemia (MLL) gene. We identified the MLL-fusion targets in an MLL-AF9 leukemia model, and conducted epigenetic profiling for H3K79me2, H3K4me3, H3K27me3, and H3K36me3 in hematopoietic progenitor and leukemia stem cells (LSCs). We found abnormal profiles only for H3K79me2 on MLL-AF9 fusion target loci in LSCs. Inactivation of Dot1l led to downregulation of direct MLL-AF9 targets and an MLL translocation-associated gene expression signature, whereas global gene expression remained largely unaffected. Suppression of MLL translocation-associated gene expression corresponded with dependence of MLL-AF9 leukemia on Dot1l in vivo. These data point to DOT1L as a potential therapeutic target in MLL-rearranged leukemia.


Figures

Figure 1
Figure 1. Presence of an H3K79me2 epigenetic lesion on direct MLL-AF9 fusion targets
(A) ChIP-Sequencing for H3K79me2 and MLL-AF9 in MLL-AF9 transformed cells. The whole genome view denotes regions associated with H3K79me2 (5507 genes, p=0.02, light green tracks) and Bio-MLL-AF9 (MLL-AF9 direct targets, 139 genes, p=0.0005, dark green tracks). Venn Diagram demonstrating overlap of MLL-AF9 direct targets and genes associated with H3K79me2. (B) GSEA of the 139 MLL-AF9 direct target genes demonstrating enrichment of gene expression for MLL-AF9 targets in leukemia stem cells (L-GMP) versus normal murine granulocyte macrophage progenitors (GMP) (p<0.001). (C) H3K79me2 ChIP-Seq signal height and position are shown relative to transcription start site (TSS) for genes grouped according to their expression level in MLL-AF9 L-GMP (No = dark blue to high = red). (D) Height and distribution of H3K79me2 profiles around the TSS of MLL-AF9 targets (brown) compared to non-targets with similar expression levels (green). (E) H3K79me2 profiles of selected MLL-AF9 targets and non-targets. (F) H3K79me2 signal height and position similar to (D) in human MLL-rearranged AML. H3K79me2 ChIP Sequencing was performed on a human MLL-AF9 rearranged primary AML sample. The 139 MLL-AF9 target loci determined in (A) converted to 120 MLL-AF9 target loci in the human genome, defining the MLL-AF9 direct targets (brown). Control gene sets with differential expression levels were created from a previously published expression array data set on human MLL-rearranged AML(Ross et al., 2004) (green). (G) H3K79me2 profiles relative to the TSS for a list of “core” targets (turquoise) defined as the overlap of the direct MLL-AF9 targets with a previously published gene set of MLL-AF4 direct targets identified in a human MLL-AF4 rearranged cell line. (H) H3K79me2 profiles relative to the TSS of MLL-fusion target genes expressed in a control AML patient sample with a normal karyotype (no MLL-rearrangement). (I) H3K79me2 profiles relative to the TSS for “core targets” (defined as in G), in a control AML patient sample with a normal karyotype. See also Figure S1 and Table S1.
Figure 2
Figure 2. Relationship between H3K79me2 and other histone modifications on direct MLL-AF9 fusion targets
(A) ChIP-Sequencing for H3K4me3, H3K27me3, H3K36me3, and H3K79me2, in sorted LSK, GMP and L-GMP populations. A screen shot of the HoxA cluster shows changes in these epigenetic marks during normal development (LSK and GMP), and in MLL-AF9 driven leukemogeneis (L-GMP). Also shown: MLL-AF9 fusion ChIP-Seq in MLL-AF9 tansformed cells (MLL-AF9-Bio); differential gene expression in L-GMP versus GMP as assessed by expression array (Expr L-GMP vs. GMP), color legend denotes fold change. (B) Genome wide representation of the relation between H3K4me3 and H3K79me2 in LSK cells on fusion target genes (red) compared to non-fusion target genes (grey). (C) Genome wide representation of the relation between H3K4me3 and H3K79me2 in L-GMP on fusion target genes (red) compared to non-fusion target genes (grey). (D) Changes in expression between LSK and GMP (obtained by expression array, x-axis) in correlation to changes in H3K79me2 (Chip-seq, y-axis). This correlation is shown for MLL-AF9 targets in red, and non-targets in grey. (E) Changes in expression between L-GMP and GMP in correlation with changes in H3K79me2. Shown is the amount of H3K79me2 signal difference for MLL-AF9 target genes (red) compared to genes that show similar differences in expression between L-GMP and GMP, but are not MLL-fusion targets (grey). See also Figure S2.
Figure 3
Figure 3. Loss of Dot1l leads to decreased growth, differentiation and apoptosis of MLL-AF9 murine leukemia cells
(A) Immunoblot analysis for H3K79me2 in MLL-AF9 transformed cells of the indicated geneotype 4 days after transduction with Cre or control retrovirus. (B) Blast colony count of Dot1l-deleted MLL-AF9 transformed cells (−/−) in methylcellulose 10 days after transduction with Cre in comparison to controls. n= at least 3 independent experiments. (C) H3K79me2 ChIP-qPCR from in vivo established MLL-AF9 leukemia cells on day 3, 5 and 7 after transduction with Cre. Loss of H3K79me2 is statistically significant on days 5 and 7 for HoxA7, HoxA9, HoxA11, Meis1 and Actin at p<0.05. n= 2–3 independent experiments for each time point. (D) Morphologic changes (colony morphology in methylcellulose, Wright-Giemsa stain) and H3K79me2 immunofluorescence (Alexa594-H3K79me2 and DAPI nuclear stain) in established MLL-AF9 leukemia cells 10 days after transduction with Cre. (E) Cell cycle changes (BrdU/7-AAD flow cytometry) in MLL-AF9 leukemia cells 7 days after transduction with Cre. n=3 independent experiments, *G0/1 increase significant at p<0.02 (+/f), p<0.04(+/−) and p<0.02 (f/f); decrease in S-phase significant at <0.0002 (+/f), p<0.0009(+/−) and p<0.0003 (f/f). (F) Induction of apoptosis (annexin+/PI) in MLL-AF9 leukemia cells 10 days after transduction with Cre. n=3 independent experiments. Error bars: standard error (SEM) See also Figure S3.
Figure 4
Figure 4. Colony formation of normal hematopoietic progenitors and HoxA9/Meis1a transformed cells is unaffected by loss of Dot1l
(A) Colony formation of normal hematopoietic progenitors 10 days after Cre-mediated excision of exon 5 of Dot1l (Dot1lf/f Cre) compared to controls. 3–5 independent experiments. (B) Blast colony count of HoxA9/Meis1a transformed cells in methylcellulose after transduction with Cre in comparison to controls over 3 weeks of serial replating. 3–5 independent experiments. (C) Serial assessment of H3K79me2 in HoxA9/Meis1a blast colonies over three weeks replating. (D) Blast colony size and morphology in methylcellulose of Dot1l deleted and Dot1l wild type HoxA9/Meis1a transformed cells. (E) Homing (18 hrs) and engraftment (11 days) of Dot1lf/f and Dot1l−/− cells after injection of 5×10⁵ HoxA9/Meis1a transformed cells (3 days after transduction with Cre or MIY). In vivo BrdU labeling demonstrates actively dividing cells. All differences are not statistically significant. Error bars: SEM, *p<0.05, ns = not significant. See also Figure S4.
Figure 5
Figure 5. Loss of Dot1l specifically decreases expression of MLL-fusion driven transcriptional programs
(A) Expression array of MLL-AF9 mouse leukemia cells 5 days after loss of Dot1l. Shown are all probe sets/genes with differential expression at p=0.01, as well as a list of the top 25 differentially expressed genes. (B) Change in relative expression of Actin after loss of H3K79me2 associated with the actin promoter (Figure 3C). (C) Example for overlay of ChIP-Seq results for H3K79me2 (light green) and MLL-AF9 direct targets (dark green) with expression array results for genes that are differentially downregulated (blue, Dot1l-down signature ) after loss of Dot1l (shown: chromosome 17). (D) GSEA showing enrichment of MLL-AF9 direct targets in “Dot1l-down” signature, p=0.01. (E) GSEA showing enrichment of “Dot1l-down” signature in leukemia stem cells (L-GMP) versus normal progenitors (GMP), p<0.01. (F) GSEA showing enrichment of “Dot1l-down” signature in human MLL-rearranged versus non- MLL-rearranged primary patient samples, p=0.034. See also Figure S5 and Table S2.
Figure 6
Figure 6. Hematopoietic development in the absence of Dot1l
(A) Peripheral blood counts of Dot1lf/f Vav-Cre (black squares, n=8) compared to littermate controls (open squares, n=12) at 3–6 weeks of age. Squares and error bars represent 1st and 2nd standard deviation. Normal range is shaded green. Insert: immunoblot for H3K79me2 in peripheral blood nucleated cells of Dot1lf/f Vav-Cre and control mice. (B) Colony formation of normal hematopoietic progenitors from bone marrow of Dot1lf/f Vav-Cre mice. Colonies were scored 7–8 days after plating. Dot1lf/f Vav-Cre: n=5, Dot1l+/f: n=5, Dot1l+/f Vav-Cre: n=3, 3 independent experiments, error bars: SEM. All differences were not statistically significant except Dot1lf/f Vav-Cre versus Dot1l+/f Vav-Cre in CFU-GM. (C) Bone marrow cellularity in Dot1lf/fVav-Cre mice shown as total cells recovered from front and hind legs + pelvis. Dot1lf/f Vav-Cre (−/−) (n=9), Dot1lf/f (f/f) (n=4), Dot1l+/f Vav-Cre (+/−) (n=3) and Dot1l+/f (+/f) (n=10) mice, error bars: SEM. (D) Flow cytometric analysis of hematopoietic stem and progenitor cell compartments in Dot1lf/fVav-Cre mice. Dot1lf/f Vav-Cre (n=4), Dot1lf/f (n=3), Dot1l+/f Vav-Cre (n=4) and Dot1l+/f (n=3) mice from 3 separate litters, error bars: SEM. See also Figure S6.
Figure 7
Figure 7. Dot1l is required for transformation and maintenance of MLL-AF9 fusion driven leukemia in vivo
(A) Survival curves for mice injected with 1×10⁵ MLL-AF9 transformed lineage negative bone marrow cells 2–4 days after transduction with Cre or MIY-control retrovirus and resorting for GFP+/YFP+ cells. (B) Survival curves for secondary recipient mice that received 1×10⁵ MLL-AF9 leukemia cells isolated from leukemic mice that were subsequently transduced with Cre or MIY-control retrovirus 3 days prior to re-injection. Just prior to reinjection cells were resorted for GFP+/YFP+ cells. See also Figure S7.

References

    1. Albert M, Helin K. Histone methyltransferases in cancer. Semin Cell Dev Biol. 2010;21:209–220. - PubMed
    1. Armstrong SA, Staunton JE, Silverman LB, Pieters R, den Boer ML, Minden MD, Sallan SE, Lander ES, Golub TR, Korsmeyer SJ. MLL translocations specify a distinct gene expression profile that distinguishes a unique leukemia. Nat Genet. 2002;30:41–47. - PubMed
    1. Ayton PM, Cleary ML. Molecular mechanisms of leukemogenesis mediated by MLL fusion proteins. Oncogene. 2001;20:5695–5707. - PubMed
    1. Bitoun E, Oliver PL, Davies KE. The mixed-lineage leukemia fusion partner AF4 stimulates RNA polymerase II transcriptional elongation and mediates coordinated chromatin remodeling. Hum Mol Genet. 2007;16:92–106. - PubMed
    1. Bracken AP, Dietrich N, Pasini D, Hansen KH, Helin K. Genome-wide mapping of Polycomb target genes unravels their roles in cell fate transitions. Genes Dev. 2006;20:1123–1136. - PMC - PubMed

Publication types

MeSH terms

Associated data