. 2024 Nov 5;15(1):9550.
doi: 10.1038/s41467-024-53837-7.

Inhibition of GPX4 enhances CDK4/6 inhibitor and endocrine therapy activity in breast cancer

Affiliations

Inhibition of GPX4 enhances CDK4/6 inhibitor and endocrine therapy activity in breast cancer

M T Herrera-Abreu et al. Nat Commun. .

Abstract

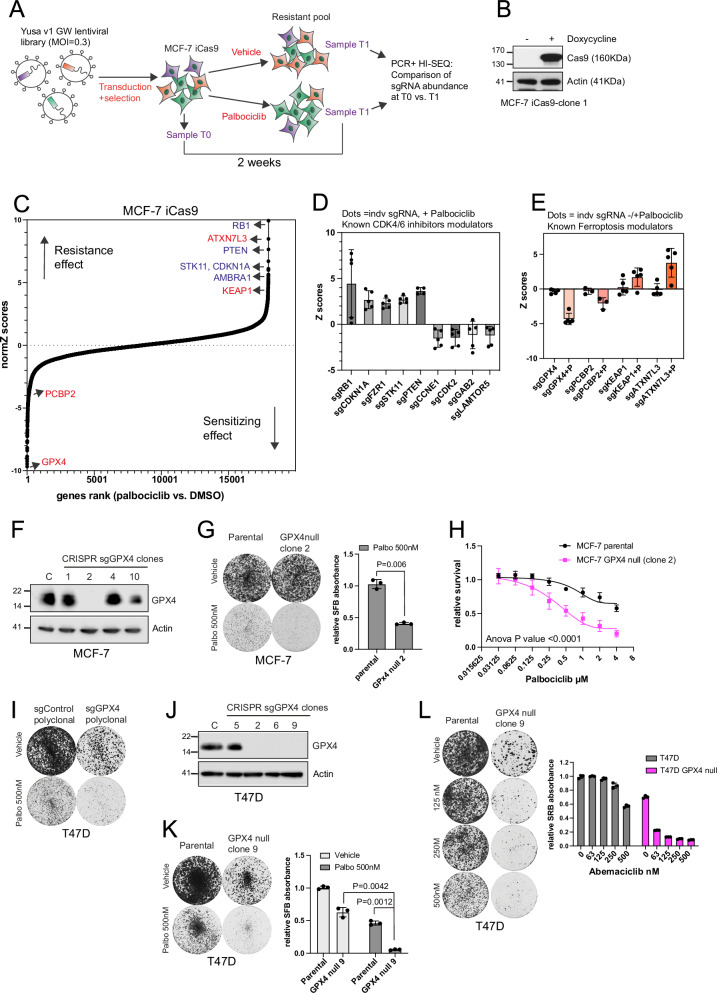
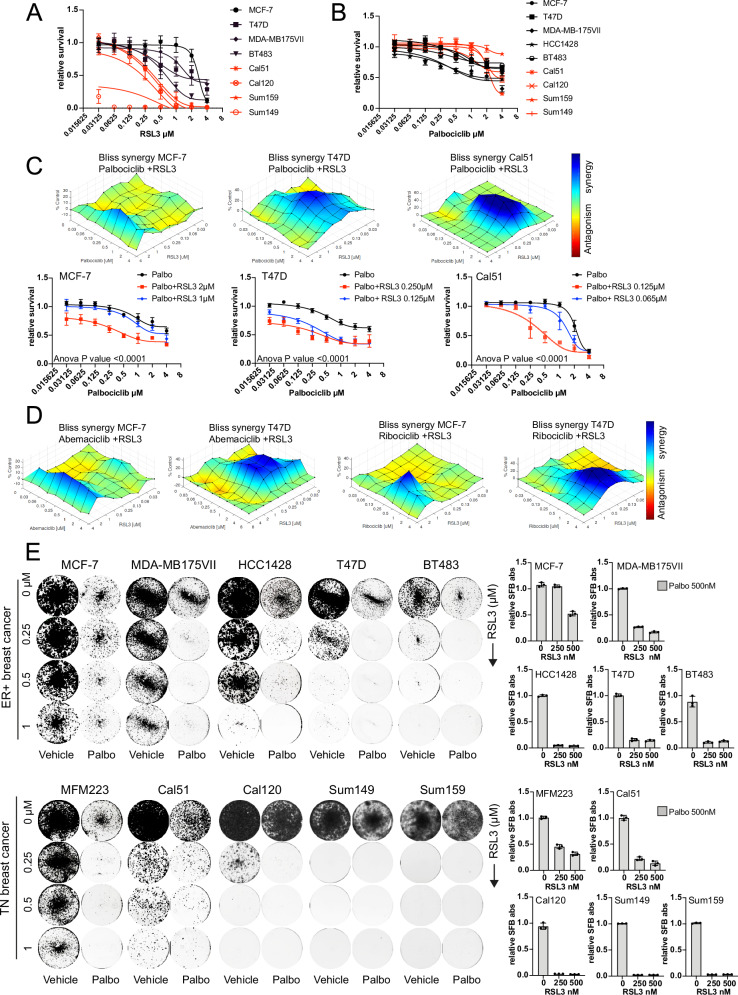
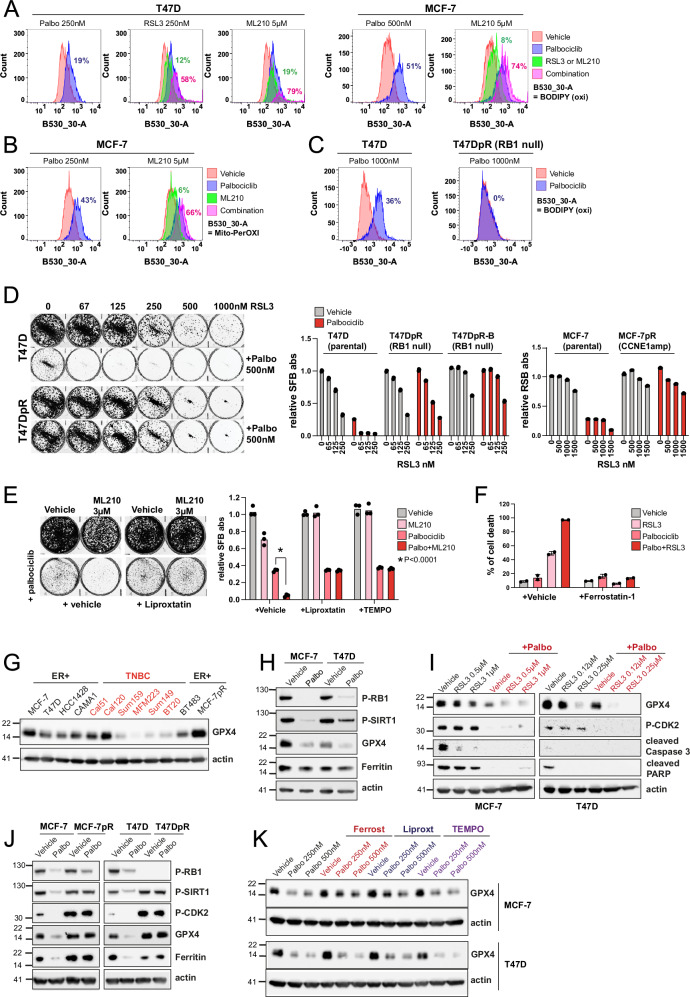
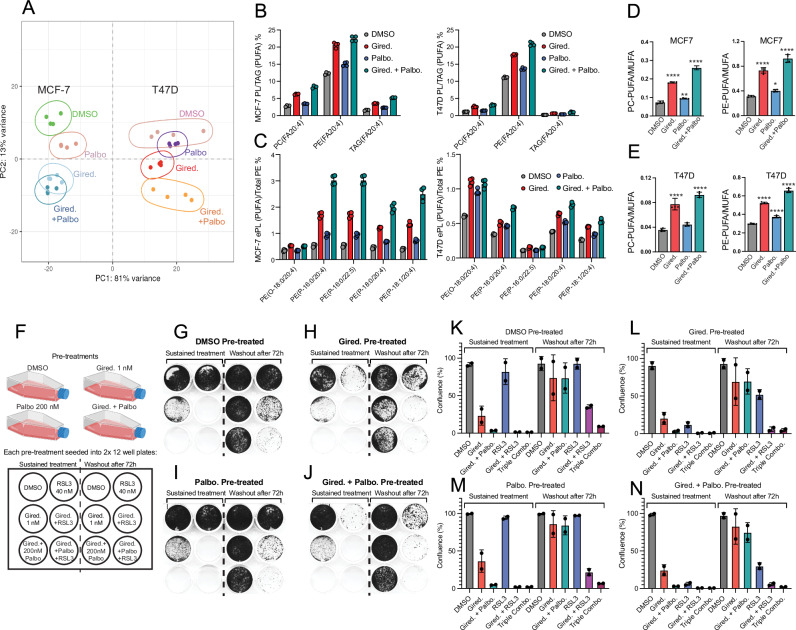
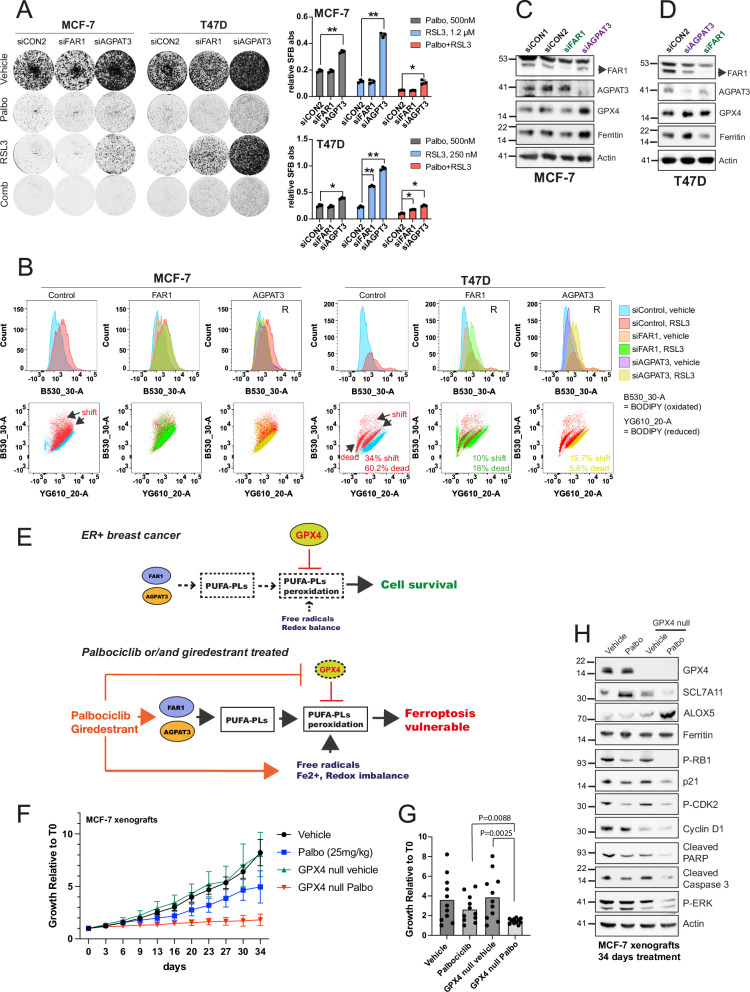
CDK4/6 inhibition in combination with endocrine therapy is the standard of care for estrogen receptor (ER+) breast cancer, and although cytostasis is frequently observed, new treatment strategies that enhance efficacy are required. Here, we perform two independent genome-wide CRISPR screens to identify genetic determinants of CDK4/6 and endocrine therapy sensitivity. Genes involved in oxidative stress and ferroptosis modulate sensitivity, with GPX4 as the top sensitiser in both screens. Depletion or inhibition of GPX4 increases sensitivity to palbociclib and giredestrant, and their combination, in ER+ breast cancer models, with GPX4 null xenografts being highly sensitive to palbociclib. GPX4 perturbation additionally sensitises triple negative breast cancer (TNBC) models to palbociclib. Palbociclib and giredestrant induced oxidative stress and disordered lipid metabolism, leading to a ferroptosis-sensitive state. Lipid peroxidation is promoted by a peroxisome AGPAT3-dependent pathway in ER+ breast cancer models, rather than the classical ACSL4 pathway. Our data demonstrate that CDK4/6 and ER inhibition creates vulnerability to ferroptosis induction, that could be exploited through combination with GPX4 inhibitors, to enhance sensitivity to the current therapies in breast cancer.


Conflict of interest statement

J.C., J-P.F., P.P., A.B., M.R.C, J.G., Q.L., W.R.W., W.S., J.V., M.H., and C.M. are or were employees of Genentech/Roche and hold Roche shares. All other Authors declare no competing interests.

Figures

Fig. 1
Fig. 1. ER+ breast cancer genome-wide CRISPR screen identifies ferroptosis as a modulator of palbociclib sensitivity.
A Schematic illustrating a genome-wide palbociclib CRISPR/Cas9 screen in MCF-7 cell line. B Western blot analysis showing that MCF-7-iCas9 cells expresses Cas9 upon doxycycline. C Scatter plot illustrating sgRNA pools normalised Z-score for palbociclib-sensitivity. Hits previously identified as modifiers of palbociclib sensitivity are highlighted in “blue”. Hits that are ferroptosis modulators are highlighted in “red”. D Graph showing Z scores values for individual sgRNA (n = 4 or 5 different sgRNA per gene) of known hits involved in cell cycle or PI3K-mTOR signalling, MCF-7 cells palbociclib-treated. E Graph showing Z scores values for individual sgRNA (n = 3 to 5 different sgRNA per gene) involved in ferroptosis that modulate palbociclib (P) sensitivity, but do not influence untreated cells. F, J Western blot analysis showing GPX4 expression in MCF-7 and T47D parental (C) and GPX4 null clones developed by CRISPR Edit-R system. G Clonogenics assay following 12 days treatment with 500 nM palbociclib or vehicle for the indicated cell lines. The graph represents relative SFB (sulforhodamine B) absorbance for the palbociclib treated arm, mean with SD for three biological replicates (n = 3, paired t-test, P = 0.0066 for parental vs. GPX4null cells treated with palbociclib). H Dose–response survival assays in MCF-7 parental and MCF-7-GPX4 null clone 2 cells exposed to palbociclib at the indicated concentration for 6 days. Graph shows relative survival, mean with SD for three biological replicates (n = 3, Two-way Anova, P < 0.0001 parental vs. GPX4 null). I Clonogenics assay following 12 days treatment with 500 nM palbociclib or vehicle, in T47D transfected with sgGPX4 or sgControl. K Clonogenic assay following 12 days treatment with 500 nM palbociclib or vehicle for the indicated cell lines. The graph represents relative SFB absorbance normalised with vehicle, mean with SD for three biological replicates (n = 3, paired t-test, P = 0.0012 for parental vs. GPX4null cells treated with palbociclib, and P = 0.0042 for GPX4null cells vehicle vs. palbociclib). L Clonogenics assay following 12 days treatment with vehicle or abemaciclib at the indicated concentrations in T47D and T47D-GPX4 null (clone 9). The graph represents relative SRB absorbance, mean with SD for three biological replicates (n = 3). Source data are provided as a Source Data file.
Fig. 2
Fig. 2. Combination of GPX4 and CDK4/6 inhibition overcomes resistance to the single drugs in breast cancer cell lines.
Dose–response survival curves in ER+ (black) and TNBC (red) breast cancer cell lines, treated with the indicated doses of RSL3 (A) or palbociclib (B). Graphs show relative survival, mean with SD for three to four (n = 3 or 4) biological replicates with two technical repeats. C, D Drug combination-survival experiment performed in 384 well plates with the indicated doses of palbociclib, abemaciclib, or ribociclib in combination with RSL3 (7-days, n = 3 to 4 biological replicates) in the indicated cell lines. The bliss score surface map generated using the software Combenefit is shown, which represent the percentage of synergy (blue) and antagonism (orange or yellow) between RSL3 and palbociclib. C (Below) dose-response survival curves showing reduced survival with the combination versus palbociclib, mean with SD (n = 3 or 4 biological replicates, two-way Anova, P values are shown for palbociclib vs. palbociclib+RSL3). E Clonogenic assays following 12 days treatment with vehicle, RSL3, palbociclib (500 nM) or the combination at the indicated doses, in ER+ and TNBC cell lines. The graph represents relative SFB (clonogenic staining) absorbance for the palbociclib treated arm, mean with SD for three biological replicates (n = 3). Source data are provided as a Source Data file.
Fig. 3
Fig. 3. Combination of GPX4 and CDK4/6 inhibition leads to increased lipid peroxidation and deplete GPX4 levels.
AC MCF-7, T47D, and T47DpR cells treated with the indicated concentrations of RSL3, ML210, palbociclib, or combinations for 5 days, and exposed to C11-BODIPY (581/591) or MitoPerOXI (581/591) to measure general or mitochondria lipid peroxidation respectively by FACS. 10.000 cells per cohort were measured. Alive cells were gated and flow cytometry histograms for the filter B530_30A (FITC) were generated using FlowJo, with a shift to the right indicating oxidation (oxi). The percentage of shift ( = lipid peroxidation) with the treatments vs. vehicle is indicated (same colour). D Clonogenic assay in T47D, T47DpR (RB1 null) and T47pR-B (RB1 null) cells following 12 days treatment with the indicated concentrations of RSL3 plus vehicle or palbociclib (500 nM). The graphs show relative SFB (clonogenic staining) absorbance normalised with vehicle, mean with SD for three technical replicates (n = 3). E Clonogenic assay in T47D cells following 12 days treatment with vehicle, palbociclib (500 nM), ML210 (3 µM) or the combination, with and without TEMPO (10 µM) or liproxstatin-1(0.5 µM). The graph show relative SFB absorbance normalised with vehicle, mean with SD for three biological replicates (n = 3, Multiple unpaired t-test, *P < 0.0001 for palbociclib vs. palbociclib+ML210; no significant when liproxstatin and TEMPO are added). F Propidium Iodide (PI) assay in T47D cells following 6 days treatment with vehicle, palbociclib (500 nM), RSL3 (250 nM), or the combination, with and without ferrostatin-1 (5 µM). Graph shows percentage of cell death, mean with SD for two biological replicates (n = 2). G Western blot assays comparing GPX4 levels in the ER+ and Triple negative breast cancer (TNBC) cell lines indicated, and the palbociclib resistant cell line MCF-7pR (CCNE1 amplification). HK Western blots of MCF-7 or T47D cells treated as indicated for five-seven days and blotted for the indicated total or phosphorylated proteins (P= phospho-specific antibody). Source data are provided as a Source Data file.
Fig. 4
Fig. 4. ER+ breast cancer genome-wide CRISPR screen identifies GPX4 as a modulator of giredestrant sensitivity.
A Normalised Z-scores for sgRNA abundance, with sgRNAs pooled for each gene. Hits that are ferroptosis modulators are highlighted in “red” (B), Relative cell viability, as determined by 7-day CellTiter-Glo, across ER+ cell lines treated with the indicated concentrations of RSL3, giredestrant, or their combination, in the absence or presence of Fer-1 (n = 4 biological replicates). C As in (B), except cells were pre-treated for 7 days with giredestrant (n = 4 biological replicates). D Differential gene expression assessing the consequence of GPX4 versus control sgRNA transduction in DMSO-treated cells (n = 2 for each sgRNA, with 2 control sgRNAs and 2 GPX4-targeting sgRNAs). E Differential gene expression assessing the consequence of GPX4 versus control sgRNA transduction in giredestrant-treated cells (n = 2 for each sgRNA, with 2 control sgRNAs and 2 GPX4-targeting sgRNAs). F Relative abundance of phospholipid and glycerolipid species after 2, 7 or 14 days of giredestrant treatment, relative to DMSO treatment over the same timeframe (n = 4 biological replicates). Source data are provided as a Source Data file.
Fig. 5
Fig. 5. The combined action of giredestrant and palbociclib elevates PUFA-(e)PLs and unlocks cell lethal RSL3 sensitivity.
AE Lipidomics was conducted in a single run, n = 4 biological replicates, graphs show mean with SD, one way ANOVA was used to calculate p values: *P < 0.05, **P < 0.01, ***P < 0.001, ****P < 0.0001 A. Principal component analysis of MCF-7 and T47D cells treated for 7 days with 1 nM giredestrant and/or 200 nM palbociclib. B Relative abundance of AA-containing PLs in MCF-7 and T47D cells. C Relative abundance of AA-containing ePLs in MCF7 and T47D cells. C Relative abundance of PUFA ePLs in MCF-7 and T47D cells. D Quantification of PUFA/MUFA ratio of PC and PE in MCF-7 cells. PC: ****p < 0.0001, **p = 0.003; PE: ****p < 0.0001, *p = 0.025; one-way ANOVA, n = 4 biological replicates. E Quantification of PUFA/MUFA ratio of PC and PE in T47D cells. PC and PE ****p < 0.0001; one-way ANOVA, n = 4 biological replicates. F Schematic showing cell treatments. T47D cells were pre-treated with either DMSO, giredestrant, palbociclib or giredestrant plus palbociclib before seeding equivalent cell numbers in a 12-well plate. Cells in the left wells experienced sustained treatment; drugs plus media were refreshed every 3–4 days. Cells in the right wells were exposed to drugs for only the first 3 days; media was refreshed every 3 to 4 days. All wells were evaluated for confluency using an Incucyte, and were then subject to crystal violet staining (shown in GJ), the experiment was run 2 times (n = 2 biological replicates); values are shown in the bar graphs (means with SD). K 18-day confluency readings of cells treated as shown, in either a sustained manner, or for only 3 days prior to a washout. Cells were pre-treated with DMSO. L As in (E), except cells were pre-treated with 1 nM giredestrant for 1 week prior to seeding. M As in (E), except cells were pre-treated with 200 nM palbociclib. N As in (E), except cells were pre-treated with the combination of 1 nM giredestrant plus 200 nM palbociclib. Source data are provided as a Source Data file.
Fig. 6
Fig. 6. Transcriptome and proteomics data uncover key modulators of oxidative stress and lipid metabolism.
A MCF-7 cells treated with 500 nM palbociclib or vehicle for 12 days, and subjected to RNA sequencing (n = 2 biological replicates). String network of upregulated genes that cluster in Enrichr under the term “lipid metabolism and biological oxidation” is shown. KEGG and Reactome terms are indicated in colour. B MCF-7 cells treated with 500 nM palbociclib or vehicle for 7 days, and subjected to proteomics analysis (n = 3 biological replicates). String network of upregulated proteins that cluster in Enrichr under the term “lipid metabolism and biological oxidation” is shown. Biological Process are indicated in colour. Highlighted in a red circle are proteins involved in the biosynthesis of PUFA-PL. C, D indicated protein abundance in MCF-7 cells treated with vehicle or palbociclib. Graphs shows mean with SD for three biological replicates (n = 3). E Western blots showing ACSL4 and actin for the indicated ER+ or TNBC cell lines. F T47D, MCF-7 and Cal51 cells treated with palbociclib 500 nM (P1) or 1000 nM (P2) for 7 days and blotted for ACSL4 and actin. G Cells transfected with siACSL4 or siControl2 (siCON2) SMARTpools for 48 h, then plated for clonogenics and treated with the indicated concentrations of palbociclib, RSL3, or their combination for 12 days. (Right) Graphs show SFB absorbance relative to siCON2-vehicle, mean with SD for three biological replicates (n = 3, Multiple unpaired t-test, *P < 0.0001 for siCON2 vs. siACSL4 for all treated groups in Cal120 cells). H T47D and Cal120 cells transfected with the indicated siRNA for 48 h, then treated with vehicle or 250 nM RSL3 for 6 days. Flow cytometry histograms for cells stained with BODIPY-C11 (10,000 measured) showing gated alive cells. A shift to the right indicates lipid peroxidation. “R” = the siRNA rescued the RSL3 effect. (Below) scatter plots are shown for filter B530_30A (oxidated BODIPY) vs. YG610_20-A (Reduced BODIPY). The percentage of shift (lipid peroxidation) and cell death with RSL3 vs. vehicle is indicated. I T47D and Cal120 transfected with siACSL4 or siCON1 and 2 for 48 h, and then blotted with the indicated antibodies. Source data are provided as a Source Data file.
Fig. 7
Fig. 7. AGPAT3/FAR1 regulates PUFA peroxidation in ER+ cell lines.
A Clonogenic survival of cells transfected with the indicated siRNAs or siControl2 (siCON2) SMARTpools for 48 h, treated with palbociclib, RSL3, or their combination for 12 days. (Right) Relative SFB absorbance normalised to siCON2-vehicle, mean with SD for three biological replicates (n = 3, multiple unpaired t-test, *P = 0.0032 **P < 0.0001 siCON2 vs. siAGPAT3 in MCF-7; *P < 0.001 **P < 0.0001 siCON2 vs. siAGPAT3 in T47D cells; *P = 0.0004 **P < 0.00001 siCON2 vs. siFAR1 in T47D). B Cells transfected with the indicated siRNA for 48 h, then treated with vehicle or RSL3 (1.2 µM for MCF-7 and 250 nM for T47D) for 6 days. Flow cytometry histograms for cells stained with BODIPY-C11 (10,000 measured) showing gated alive cells. A shift to the right indicates lipid peroxidation. “R” = the siRNA rescued the RSL3 effect. (Below) scatter plots are shown for filter B530_30A (oxidated BODIPY) vs. YG610_20-A (Reduced BODIPY). The % of shift (lipid peroxidation) and cell death with RSL3 vs. vehicle is indicated. C, D western blot analysis for MCF-7 and T47D transfected with the indicated siRNA for 48 h, and then treated with vehicle or 500 nM palbociclib for 5 days. E Schematic illustrating PUFA-phospholipids (PUFA-PLs) synthesis and peroxidation in a redox balanced environment, and (below) palbociclib/giredestant induced ferroptosis vulnerability. F Xenografts derived from MCF-7 cells and MCF-7 GPX4 null clones treated with vehicle or palbociclib (25 mg/kg). Tumour volume (mm3) measured at the indicated time points was normalised with the tumour volume at T0. Mean and error bars (SEM) for 5-7 tumours/group are shown. G Dots represent the mean for relative tumour growth (5-7 tumours) for each time point (n = 5 to 7, unpaired T-test, P = 0.0025 for MCF-7-GPX4null cells vehicle vs. palbociclib, P = 0.0088 for MCF-7 parental vs. GPX4null cells treated with palbociclib). H western blot analysis of xenografts tumour samples collected at the end of treatment (34 days). Source data are provided as a Source Data file.

References

    1. Goetz, M. P. et al. MONARCH 3: Abemaciclib as initial therapy for advanced breast cancer. J. Clin. Oncol.35, 3638–3646 (2017). - PubMed
    1. Hortobagyi, G. N. et al. Ribociclib as first-line therapy for HR-Positive, advanced breast cancer. N. Engl. J. Med.375, 1738–1748 (2016). - PubMed
    1. Finn, R. S. et al. Palbociclib and Letrozole in advanced breast cancer. N. Engl. J. Med.375, 1925–1936 (2016). - PubMed
    1. Johnston, S. R. D. et al. Abemaciclib combined with endocrine therapy for the adjuvant treatment of HR+, HER2-, node-positive, high-risk, early breast cancer (monarchE). J. Clin. Oncol.38, 3987–3998 (2020). - PMC - PubMed
    1. Tolaney, S. M. et al. Abemaciclib plus trastuzumab with or without fulvestrant versus trastuzumab plus standard-of-care chemotherapy in women with hormone receptor-positive, HER2-positive advanced breast cancer (monarcHER): a randomised, open-label, phase 2 trial. Lancet Oncol.21, 763–775 (2020). - PubMed

Publication types

MeSH terms

Associated data

LinkOut - more resources