. 2024 Dec 5;15(1):10594.
doi: 10.1038/s41467-024-54354-3.

CDK9 recruits HUWE1 to degrade RARα and offers therapeutic opportunities for cutaneous T-cell lymphoma

Affiliations

CDK9 recruits HUWE1 to degrade RARα and offers therapeutic opportunities for cutaneous T-cell lymphoma

Chen-Hui Luo et al. Nat Commun. .

Abstract

Cutaneous T-cell lymphoma (CTCL) is a heterogeneous non-Hodgkin lymphoma originating in the skin and invading the systemic hematopoietic system. Current treatments, including chemotherapy and monoclonal antibodies yielded limited responses with high incidence of side effects, highlighting the need for targeted therapy. Screening with small inhibitors library, herein we identify cyclin dependent kinase 9 (CDK9) as a driver of CTCL growth. Single-cell RNA-seq analysis reveals a CDK9high malignant T cell cluster with a unique actively proliferating feature. Inhibition, depletion or proteolysis targeting chimera (PROTAC)-mediated degradation of CDK9 significantly reduces CTCL cell growth in vitro and in murine models. CDK9 also promotes degradation of retinoic acid receptor α (RARα) via recruiting the E3 ligase HUWE1. Co-administration of CDK9-PROTAC (GT-02897) with all-trans retinoic acid (ATRA) leads to synergistic attenuation of tumor growth in vitro and in xenograft models, providing a potential translational treatment for complete eradication of CTCL.


Conflict of interest statement

Competing interests: The authors declare no competing interests.

Figures

Fig. 1
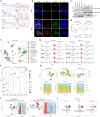
Fig. 1. Chemical biology screening identifies a vulnerability to CDK9 inhibition of CTCL.
a HH and Hut78 cells were treated with compounds (2 µM) from inhibitor library (L1200) and cell viability was evaluated using CCK8 assay after treatment for 48 hours. CDK Cyclin-dependent kinase, JAK/STAT Janus kinase-signal transducer and activator of transcription, PI3K Phosphoinositide 3-kinases, mTOR mammalian target of rapamycin complex. b The most effective kinase inhibitors (cell viability < 25%) identified from compound screening for HH and Hut78 cells. c Numbers of effective (red, cell viability < 25%) and ineffective (gray, cell viability25%) CDK inhibitors from each different CDK subfamilies were shown. d IC50 curve of five representative CDK9 inhibitors, AT7519, Dinaciclib, Flavopiridol, SNS-032 and P276-00 in HH and Hut78 cells. Cell viability was counted by trypan blue staining. Results represent biologically independent experiments of n  =  3. eh Nude mice were subcutaneously injected with HH cells and randomly divided into Vehicle, Flavopiridol and SNS-032 groups (n = 8). Tumor volumes were measured at different time points (e, g). At 17 days after subcutaneous injection, tumors were harvested and weighed (f, h). i Western blot analysis of indicated proteins from Hut78 cells infected with lentivirus encompassing shNC, shCDK9-1 or shCDK9-2. j Growth curve of Hut78 cells upon CDK9 depletion. Cell number was counted by trypan blue. Experiments were performed in triplicate and repeated twice with similar results. k Western blot analysis of indicated proteins from HH cells infected with lentivirus encompassing shNC, shCDK9-1, or shCDK9-2. l Growth curve of HH cells upon CDK9 depletion. Cell number was counted by trypan blue. Experiments were performed in triplicate and repeated twice with similar results. m, n HH cells were infected with shNC, shCDK9-1, or shCDK9-2 lentiviruses, and subcutaneously injected into nude mice (n = 6). Tumor volumes were measured at different time points (m). At 12 days after subcutaneous injection, tumors were harvested and weighed (n). Data are presented as mean ± SEM. Unpaired, two-tailed Student’s t-test. Source data are provided as a Source Data file. i, k n = 3, independent experiments, a representative example is shown. The samples derive from the same experiment each but different gels for CDK9 and another for β-actin were processed in parallel. Band intensities were analyzed and compared using Image J. Relative densitometric values are provided below the blot images.
Fig. 2
Fig. 2. CDK9 is overexpressed in CTCL and defines a unique malignant T cell population.
a Immunohistochemistry (IHC) staining of CDK9 of tissues collected from healthy donors (Normal) and CTCL patients. b Immunofluorescent staining of tissue sections from Normal and CTCL patients using antibodies against CD4 and CDK9. DAPI (4’,6-diamidino-2-phenylindole) was used for nucleus staining. c Western blot analysis of samples from healthy donors (Normal) and CTCL cell lines using indicated antibodies. n = 3, independent experiments, a representative example is shown. Band intensities were analyzed and compared using Image J. Relative densitometric values are provided below the blot images. d Differential expression of CDK9 in patients with CTCL from the indicated datasets. NLCT non large-cell transformation. P values were calculated by one-tailed t test. e UMAP projection of CTCL dataset GSE165623 including cells from skin, blood and lymph node across a patient with advanced MF. f Dot plot of CTCL dataset GSE165623 showing the average expression levels and cell expression proportions of selected cell lineage markers. g Violin plots of T cell clusters in CTCL datasets GSE165623 and GSE171811 exhibiting the specific expression of CDK9 and proliferating markers. CDK9high cluster number was labeled in red. h UMAP projections of three cell cycle phases in CTCL datasets GSE165623, GSE171811, and GSE128531 respectively, T cell clusters were labeled using the bold black text and CDK9high cluster was indicated by the dotted oval (top panel). Percentage of cells in each phase of cell cycle was shown, with CDK9high cluster number labeled in red (bottom panel). i UMAP plots of T cells from GSE165623 and GSE171811 datasets, cells with the top expanded TCR α or β chain CDRs amino acid sequence per patient are colored in red (malignant), the polyclonal α or β TCRs are labeled in blue (polyclonal), and cells without detectable TCR are displayed in gray (remaining). Cell distribution was presented with contour graphs and summarized in the accompanying bar chart. The CDK9high cluster was labeled in red (right panel). j UMAP representation split by tissues of T cells from GSE165623. Malignant T cells from skin, blood, and lymph node are colored by dark cyan, red, and purple. CDK9high cluster number was labeled using the bold black text and cells were indicated by the dotted oval.
Fig. 3
Fig. 3. CDK9-targeting PROTACs induce selective degradation of CDK9 in CTCL cells.
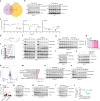
a RNA-seq analysis of Hut78 cells treated with Flavopiridol or knocked down CDK9 expression with shCDK9. The Venn diagram showed the genes differentially expressed in each group. b MOLT-4 and HH cells were treated with THAL-SNS-032 and western blots were conducted. c HH cells were treated with DMSO or candidate PROTACs. Cell viability was measured using the CCK8. d Chemical structure of 23 (GT-02897). e Cell viability of Hut78 cells treated with DMSO or 19, 23, 24, 25, 26, and 27. Viability was counted by trypan blue. P value was calculated by two-tailed Student’s t-test. f Western blot analysis of indicated proteins in Hut78 cells treated with DMSO or 23, 24, 25, and 26. g, Western blot analysis of CDK9 in Hut78 cells upon THAL-SNS-032 or 23 (GT-02897) treatment. h 293T cells were treated with DMSO or 23 (GT-02897). Viability was counted by trypan blue. i Hut78 were treated with 23 (GT-02897) in the presence or absence of MG132 followed by Western blot analysis. j Hut78 cells were pre-exposed to SNS-032 or PHA-767491 followed by treatment with 23 (GT-02897). Then CDK9 protein was analyzed by Western blot. k Quantitative proteomic analysis and volcano plot of proteins that were differently regulated in Hut78 cells upon 23 (GT-02897) treatment. CDK9 was labeled. P value was derived by Wilcoxon rank-sum test. l Hut78 cells were treated with 23 (GT-02897) and Q-PCR analysis was performed for CDK9 (55 kDa) and CDK9 (42 kDa). P value was calculated by two-tailed Student’s t-test. m The regulated proteins in (k) were annotated and analyzed for the most significantly enriched pathways using Metascape. nr Western blot analysis of indicated proteins in Hut78 cells upon 23 (GT-02897) treatment. s Hut78 cells were treated with different doses of 23 (GT-02897) for 10 h and DC50 was calculated. Results in (e, h, s) represent biologically independent experiments of n = 3. Results in (l), n = 4 for CDK9(55 kDa) and n = 3 for CDK9(42 kDa). Data are presented as mean ± SEM. Source data are provided as a Source Data file. b, f, g, i, j, nr n = 3, independent experiments, a representative example is shown. The samples in (f) derive from the same experiment but different gels for CDK9, β-actin, another for CDK7, another for CDK2 and another for CDK6 were processed in parallel. Band intensities were analyzed and compared using ImageJ. Relative densitometric values are provided below the blot images.
Fig. 4
Fig. 4. GT-02897 degrades CDK9 and suppresses tumor in CTCL xenograft model.
ac NSG mice were subcutaneously injected with Hut78 cells (8 × 106 cells for each mouse) and randomly divided into two groups receiving intraperitoneal injection of Vehicle or 23 (GT-02897) (n = 4). Tumor volumes were measured at different time points (a). At 14 days after subcutaneous injection, tumors were harvested and weighed (b), followed by IHC staining of human CDK9 (c). P value was calculated by two-tailed Student’s t-test. d, e NSG mice were subcutaneously injected with Hut78 cells (8 × 106 cells for each mouse) and randomly divided into two groups receiving subcutaneously injection of Vehicle or 23 (GT-02897) (n = 5). Tumor volumes were measured at different time points (d) and survival curves were shown (e). P value of tumor volumes was calculated by two-tailed Student’s t-test, P value of survival curve was calculated by log-rank test. fh NSG mice were subcutaneously injected with Hut78 cells introduced with shNC, shCDK9-1 or shCDK9-2 (8 × 106 cells for each mouse) and treated with 23 (GT-02897) (n = 6). Tumor volumes were measured at different time points (f). At 12 days after subcutaneous injection, tumors were harvested and weighed (g, h). P value was calculated by two-tailed Student’s t-test. Data are presented as mean ± SEM. Source data are provided as a Source Data file.
Fig. 5
Fig. 5. CDK9 suppresses RARα protein expression and physically interacts with RARα.
a Quantitative proteomic analysis and volcano plot of Hut78 cell proteins upon 23 (GT-02897) treatment, with P values derived from Wilcoxon rank-sum test. b Western blotting of indicated proteins in Hut78 under 23 (GT-02897) treatment. Western blot analysis of indicated proteins in HH and Hut78 (c) or 293T (d) cells after CDK9 depletion via lentiviruses. e A doxycycline (Dox)-inducible knockdown system was applied in HH and Hut78 cells, followed by Western blotting post Dox treatment. f Volcano plot revealing differentially expressed genes in Hut78 post CDK9 depletion, with P values derived by Wilcoxon rank-sum test. g Q-PCR assessment of CDK9 and RARA levels in Hut78 cells after CDK9 depletion. h Western blot analysis of proteins in Hut78 after CDK9 depletion, with or without MG132 treatment. i 293T cells were co-transfected with RARα and CDK9 constructs, followed by co-immunoprecipitation (Co-IP) and Western blot analysis. j GST-tagged CDK9 was incubated with HA-RARα from the WCL of 293T cells transfected with 3 × HA-tagged RARα, followed by GST pulldown and Western blot analysis. WCL: whole cell lysate. k Schematic diagram of full-length CDK9 protein (top). GST pulldown assay was performed using GST-tagged CDK9 and WCL of 293T cells transfected with 3 × HA-tagged RARα. l Lentiviral infection of Hut78 with shNC or shCDK9-1, followed by transfection of EV, 3 × Flag-tagged WT, T186A, and S347A CDK9, and Western blotting of indicated proteins. m Western blotting of indicated proteins in Hut78 post CDK9 depletion or Flavopiridol treatment. n Q-PCR analysis of RARA in Hut78 cells treated with Flavopiridol. o Schematic diagram of full-length RARα protein (top). Co-transfection of 3×Flag-tagged CDK9 with full-length or mutant RARα constructs in 293T, followed by Co-IP and immunoblotting (bottom). Results in (g, n) represent biologically independent experiments of n = 3, with P values calculated by two-tailed Student’s t-test. Data are presented as mean ± SEM, with source data provided as a Source Data file. be, hm, o n = 3, independent experiments, a representative example is shown. The samples derive from the same experiment each but different gels for CDK9, β-actin and another for RARα (b, d, e, h), for RARα, β-actin and another for CDK9 (c), for HA-RARα, β-actin and another for Flag-CDK9 (i), for RARα, β-actin and another for Flag-CDK9 (l) were processed in parallel. Band intensities in (be, h, l, m) were analyzed and compared using Image J. Relative densitometric values are provided below the blot images.
Fig. 6
Fig. 6. CDK9 recruits HUWE1 E3 ligase to trigger RARα ubiquitination at K360.
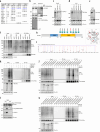
a Hut78 cells were transfected with 3 × Flag-tagged WT, T186A, or S347E CDK9, followed by Co-IP with anti-Flag antibody. Mouse IgG was used as negative control. Samples were then analyzed via LC-MS/MS and E3 ligases interacting with 3 × Flag-tagged WT, T186A, or S347E CDK9 were listed. b Bacterially expressed GST-tagged CDK9 was incubated with Hut78 WCL, followed by GST pulldown and Western blot analysis. WCL: whole cell lysate. ce Western blot analysis of indicated proteins in Hut78 (c) and 293T (d) cells with HUWE1 depletion, as well as in wild-type (WT) and HUWE1 knockout (KO) MEF cells (e). f Hut78 cells overexpressing RARα were infected with shNC or shHUWE1 lentiviruses. After 6 h of treatment with MG132 (10 µM) or DMSO, Co-IP with anti-RARα or mouse IgG was conducted, followed by immunoblotting. g In 293T cells transfected with 3 × HA-tagged RARα, Myc-tagged ubiquitin, and HUWE1, Co-IP and immunoblotting were conducted after MG132 (10 µM) or DMSO treatment. h Schematic of RARα ubiquitination K sites (left) and protein structure of RARα ligand binding domain (LBD) (in white) bound to ATRA (in blue) (PDB ID: 3A9E) (right). i Tandem mass spectrum of a RARα-derived peptide confirmed ubiquitin conjugation at residue K360. j Myc-tagged ubiquitin was co-transfected with wild-type or mutant RARα (HA-RARαWT, HA-RARαK244R, and HA-RARαK360R) into 293T cells with or without infection of HUWE1. Following 6 h of MG132 (10 µM) treatment, Co-IP and immunoblotting were performed. k, Myc-tagged ubiquitin was co-transfected with wild-type or mutant RARα with deletion of the Hinge domain (HA-ΔH-RARαWT, HA-ΔH-RARαK244R, and HA-ΔH-RARαK360R) into 293T cells with or without infection of HUWE1. Following 6 h of MG132 (10 µM) treatment, Co-IP and immunoblotting were performed. l Western blot analysis of indicated proteins in wild-type (WT) and HUWE1 knockout (KO) MEF cells with or without infection of 3×Flag-tagged CDK9. bg and jl n = 3, independent experiments, a representative example is shown. The samples derive from the same experiment each but different gels for RARα, β-actin, another for HUWE1 and another for GST-CDK9, GST (b), for RARα, β-actin and another for HUWE1 (ce), for RARα, β-actin and another for Ub (f), for HA-RARα, β-actin, another for HUWE1 and another for Myc (g, j, k), for RARα, β-actin, another for Flag-CDK9 and another for HUWE1 (l) were processed in parallel. Band intensities in (ce, l) were analyzed and compared using Image J. Relative densitometric values are provided below the blot images.
Fig. 7
Fig. 7. GT-02897 induces RARα accumulation which sensitizes CTCL to ATRA and displays synergistic activity with ATRA in treating CTCL.
a Western blotting in Hut78 cells upon HA-RARα overexpression. b Growth curve of Hut78 cells infected with EV or HA-RARα lentivirus. Cell number was counted by trypan blue. c A doxycycline (Dox)-inducible knockdown system (shNC or shRARα) was introduced into Hut78 cells via lentiviruses, followed by Dox administration and Western blot analysis. d Growth curves of Hut78 cells with Dox-inducible shNC or shRARα post-Dox treatment, with cell counts via trypan blue. e Western blot analysis of CDK9 and RARα in CDK9-depleted Hut78 cells with or without RARα depletion. f Growth curve of control and CDK9-depleted Hut78 cells infected with or without shRARα lentivirus. Cell number was counted by trypan blue. g Hut78 cells were treated with ATRA or DMSO. Viability and cell number were measured by trypan blue. h RNA-seq analysis of HH and Hut78 cells upon ATRA treatment, with a Venn diagram showing common differentially expressed genes (left), and enriched pathways analyzed via Metascape (right). i Heatmap of regulated genes upon ATRA treatment in HH and Hut78 cells. j Schematic of CTCL cell differentiation into T cell lineages after ATRA treatment. k Q-PCR analysis of indicated genes in Hut78 cells after ATRA treatment. l Flow cytometry analysis of CD25, CD5 and CD7 expression on HH (top) and Hut78 (bottom) cells upon ATRA or DMSO treatment. m Growth curves of Hut78 cells infected with shNC or shCDK9 lentiviruses upon ATRA or DMSO treatment. Cell number was counted by trypan blue. n Hut78 cells were treated with ATRA and GT-02897 alone or combined and the cell number was counted by trypan blue. oq NSG mice were subcutaneously injected with Hut78 cells and randomly divided into four groups (Vehicle, GT-02897, ATRA or ATRA + GT-02897, n = 10). Tumor volumes were measured over time (o).Tumors were harvested at 21 days, weighed (p), and analyzed by IHC for human CD25 (q). Results in (b, d, f, g, k, m, n) represent biologically independent experiments of n = 3, with P values calculated by two-tailed Student’s t-test. Data are presented as mean ± SEM. Source data are provided as a Source Data file. a, c, e n = 3, independent experiments, a representative example is shown. The samples in (e) derive from the same experiment but different gels for CDK9, β-actin, and another for RARα were processed in parallel. Band intensities in (a, c, e) were analyzed and compared using Image J. Relative densitometric values are provided below the blot images.
None
None
None

References

    1. Whittaker, S., Hoppe, R. & Prince, H. M. How I treat mycosis fungoides and Sezary syndrome. Blood127, 3142–3153 (2016). - PubMed
    1. Horwitz, S. M. et al. Activity of the PI3K-delta, gamma inhibitor duvelisib in a phase 1 trial and preclinical models of T-cell lymphoma. Blood131, 888–898 (2018). - PMC - PubMed
    1. Dummer, R. et al. Cutaneous T cell lymphoma. Nat. Rev. Dis. Prim.7, 61 (2021). - PubMed
    1. Kamijo, H. et al. Aberrant CD137 ligand expression induced by GATA6 overexpression promotes tumor progression in cutaneous T-cell lymphoma. Blood132, 1922–1935 (2018). - PubMed
    1. Wang, L. et al. RARalpha/RXR synergism potentiates retinoid responsiveness in cutaneous T-cell lymphoma cell lines. Exp. Dermatol.26, 1004–1011 (2017). - PMC - PubMed

Publication types

MeSH terms

Associated data