. 2011 Mar 23;3(75):75ra25.
doi: 10.1126/scitranslmed.3001875.

Breast cancer methylomes establish an epigenomic foundation for metastasis

Affiliations

Breast cancer methylomes establish an epigenomic foundation for metastasis

Fang Fang et al. Sci Transl Med. .

Abstract

Cancer-specific alterations in DNA methylation are hallmarks of human malignancies; however, the nature of the breast cancer epigenome and its effects on metastatic behavior remain obscure. To address this issue, we used genome-wide analysis to characterize the methylomes of breast cancers with diverse metastatic behavior. Groups of breast tumors were characterized by the presence or absence of coordinate hypermethylation at a large number of genes, demonstrating a breast CpG island methylator phenotype (B-CIMP). The B-CIMP provided a distinct epigenomic profile and was a strong determinant of metastatic potential. Specifically, the presence of the B-CIMP in tumors was associated with low metastatic risk and survival, and the absence of the B-CIMP was associated with high metastatic risk and death. B-CIMP loci were highly enriched for genes that make up the metastasis transcriptome. Methylation at B-CIMP genes accounted for much of the transcriptomal diversity between breast cancers of varying prognosis, indicating a fundamental epigenomic contribution to metastasis. Comparison of the loci affected by the B-CIMP with those affected by the hypermethylator phenotype in glioma and colon cancer revealed that the CIMP signature was shared by multiple human malignancies. Our data provide a unifying epigenomic framework linking breast cancers with varying outcome and transcriptomic changes underlying metastasis. These findings significantly enhance our understanding of breast cancer oncogenesis and aid the development of new prognostic biomarkers for this common malignancy.


Conflict of interest statement

Competing interests: S.B.B. is a consultant for MDX in regard to MSP (methylation-specific polymerase chain reaction) assays and receives unrestricted grant support from the company. MDX has no known financial interests associated with this work. The other authors declare that they have no competing interests.

Figures

Fig. 1
Fig. 1
Identification of a CIMP by clustering of breast cancer samples. Unsupervised clustering was performed with the Infinium DNA methylation probes whose β values varied most across the breast tumor samples (top 5% most variant probes). (A) K-means consensus clustering (K = 2). Tumors (n = 39) are listed in the same order along the x and y axes. Clusters 1 and 2 are noted in purple and green, respectively, and B-CIMP status is noted on the black and white bars. Consensus index values range from 0 to 1, with 0 being highly dissimilar and 1 being highly similar. (B) 2D hierarchical clustering of the tumors using the same methylation probes as in (A). Each row represents a tumor and each column represents a probe. The level of DNA methylation (normalized and transformed β value) is represented with a color scale (red, methylated; blue, nonmethylated). Data for normal breast (n = 3) and DKO (a cell line with global loss of methylation) are shown but did not contribute to the clustering analysis (62). HR, HER2, and distant recurrence status is shown along the left side of the heat map. Failed, developed distant metastases. Horizontal bars along the bottom of plot denote genes that have decreased or increased methylation in B-CIMP.
Fig. 2
Fig. 2
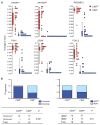
Characterization of B-CIMP and clinical co-variates. (A) Selected genes with differential methylation between CIMP groups in breast tumors. Average β values for the genes are shown on the y axis. Data are presented for CIMP+ (red) and CIMP (blue) tumors. Whisker box plots summarizing each data set are shown (mean ± SD). The boxes delineate the 25th to 75th percentile range. (B) B-CIMP+ tumors are highly associated with HR positivity but not with HER2 status (χ2 test).
Fig. 3
Fig. 3
B-CIMP and metastatic risk. (A) Relative methylation (normalized and transformed β value) of the genes analyzed in Fig. 1 in CIMP+ versus CIMP tumors. Whisker box plots summarizing each data set are shown (mean ± SD). The boxes delineate the 25th to 75th percentile range. The P value indicates significance determined using ANOVA. (B) Relative methylation of the genes in ER/PR+ versus ER/PR tumors. Whisker box plots summarizing each data set are shown (mean ± SD). Significance determined using ANOVA. (C) Relative methylation of the genes in hormone+, CIMP+ versus hormone+, CIMP tumors. Whisker box plots summarizing each data set are shown (mean ± SD). Significance determined using ANOVA. (D) Relative methylation of the genes in CIMP+ versus CIMP tumors (all probes). Whisker box plots summarizing each data set are shown (mean ± SD). Significance determined using ANOVA. (E) Kaplan-Meier curve for distant metastasis–free survival for B-CIMP+ and B-CIMP subtypes. P value calculated by log-rank analysis. Data from discovery set tumors (Fig. 1). (F) Validation of B-CIMP and its impact on metastatic risk in an independent set of breast tumors (n = 132). EpiTYPER assays were developed for three of the most predictive genes for B-CIMP as indicated in the panel. Samples were analyzed and categorized as CIMP+ if at least two of three genes were methylated, as shown in the heat map. Red, methylated; blue, unmethylated; purple, B-CIMP+. (G and H) Kaplan-Meier curves for (G) distant metastasis–free survival and (H) overall survival by B-CIMP status. P value calculated by log-rank analysis. (I) B-CIMP predicted metastatic risk in ER/PR+ breast cancers. Kaplan-Meier curve for distant metastasis–free survival for B-CIMP+ and B-CIMP subtypes. P value calculated by log-rank analysis.
Fig. 4
Fig. 4
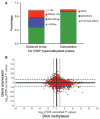
Methylation landscape of breast cancer. (A) Characteristics of the hypermethylated sites in the B-CIMP. The plot on the left [distance to transcriptional start site (tss)] shows the proportion of probes that are within the indicated distances from the tss. The plot on the right (composition) shows the proportion of hypermethylated probes that are located in CpG islands, in shores, or in neither CpG islands nor shores. (B) Starburst plot for comparison of DNA methylation and gene expression. Log10(FDR-corrected P value) is plotted for DNA methylation (x axis) and gene expression (y axis) for each gene. Along the y axis, data for fold expression <0 are log10(FDR-corrected P value) and data for fold expression ≥0 are −log10(FDR-corrected P value). Along the x axis, data for β value <0 are log10(FDR-corrected P value) and data for β value ≥0 are −log10(FDR-corrected P value). The black line indicates the FDR-adjusted P value threshold of 0.05. Data points other than red indicate genes that are significantly up-regulated (green) or down-regulated (blue and purple) and also significantly hypo- or hypermethylated in B-CIMP tumors. Points in blue indicate genes that are significantly down-regulated and hypermethylated in B-CIMP+ tumors versus B-CIMP tumors.
Fig. 5
Fig. 5
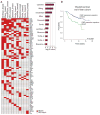
B-CIMP and the metastasis transcriptome. (A) Differentially expressed B-CIMP genes in breast cancer metastasis transcriptomes. Concepts mapping of B-CIMP–repressed genes across multiple data sets associated with metastasis. Each row shows individual gene sets from which a breast prognostic expression signature has been described. The top 10% of the most overexpressed genes from these gene sets were used for the concept mapping. Genes that are significantly hypermethylated and down-regulated in B-CIMP+ tumors (n = 102) correspond to genes whose overexpression is predictive of metastasis (left panel). Red, matching gene between B-CIMP gene and gene predictive of metastatic behavior. Q value calculated as in Materials and Methods (right panel). (B) Kaplan-Meier survival curve showing that the CIMP repression signature (hypermethylated and down-regulated in B-CIMP tumors) predicts survival in the van’t Veer cohort (17). P value calculated by log-rank.
Fig. 6
Fig. 6
Consensus between the PRC2 and methylome landscapes in B-CIMP. Significance and locations of methylation enrichment in B-CIMP+ tumors are plotted across the genome and indicated by the blue bars. Significance and locations of PRC2 enrichment are shown by the red bars. The horizontal axis indicates level of significance (FDR-corrected, ANOVA).
Fig. 7
Fig. 7
Consensus target genes of the CIMP across multiple human cancers. (A) Venn diagram showing common gene targets between the PRC2 targets described in (47) and CIMP in the three indicated cancers. Numbers in parentheses indicate number of genes in common between PRC2 target genes and CIMP targets in each cancer type. The table next to the diagram shows the level of significance between these overlapping gene lists (P value, hypergeometric distribution). The numbers in the Venn diagram show the number of CIMP/PRC2 common targets that are shared between the cancer types. (B) Same as in (A), except PcG targets are from the Suz12 targets described in (46). (C) The left diagram shows the 33 most significant CIMP targets common to all three malignancies. Significance [−log10(FDR-corrected P value)] was plotted for DNA methylation along the y axis, and genomic location or chromosome number was plotted along the x axis. Genes are shown in a separate color for each tumor type according to the legend. The right diagram shows a Kaplan-Meier curve depicting the survival of patients with GBM tumors in which the 33-gene CIMP signature was present versus tumors in which the signature was absent. P value calculated by log-rank. TCGA, The Cancer Genome Atlas.

References

    1. Noushmehr H, Weisenberger DJ, Diefes K, Phillips HS, Pujara K, Berman BP, Pan F, Pelloski CE, Sulman EP, Bhat KP, Verhaak RG, Hoadley KA, Hayes DN, Perou CM, Schmidt HK, Ding L, Wilson RK, Van Den Berg D, Shen H, Bengtsson H, Neuvial P, Cope LM, Buckley J, Herman JG, Baylin SB, Laird PW, Aldape K. Cancer Genome Atlas Research Network, Identification of a CpG island methylator phenotype that defines a distinct subgroup of glioma. Cancer Cell. 2010;17:510–522. - PMC - PubMed
    1. Weisenberger DJ, Siegmund KD, Campan M, Young J, Long TI, Faasse MA, Kang GH, Widschwendter M, Weener D, Buchanan D, Koh H, Simms L, Barker M, Leggett B, Levine J, Kim M, French AJ, Thibodeau SN, Jass J, Haile R, Laird PW. CpG island methylator phenotype underlies sporadic microsatellite instability and is tightly associated with BRAF mutation in colorectal cancer. Nat Genet. 2006;38:787–793. - PubMed
    1. Perou CM, Sørlie T, Eisen MB, van de Rijn M, Jeffrey SS, Rees CA, Pollack JR, Ross DT, Johnsen H, Akslen LA, Fluge O, Pergamenschikov A, Williams C, Zhu SX, Lønning PE, Børresen-Dale AL, Brown PO, Botstein D. Molecular portraits of human breast tumours. Nature. 2000;406:747–752. - PubMed
    1. Jemal A, Siegel R, Ward E, Hao Y, Xu J, Murray T, Thun MJ. Cancer statistics, 2008. CA Cancer J Clin. 2008;58:71–96. - PubMed
    1. Saal LH, Gruvberger-Saal SK, Persson C, Lövgren K, Jumppanen M, Staaf J, Jönsson G, Pires MM, Maurer M, Holm K, Koujak S, Subramaniyam S, Vallon-Christersson J, Olsson H, Su T, Memeo L, Ludwig T, Ethier SP, Krogh M, Szabolcs M, Murty VV, Isola J, Hibshoosh H, Parsons R, Borg A. Recurrent gross mutations of the PTEN tumor suppressor gene in breast cancers with deficient DSB repair. Nat Genet. 2008;40:102–107. - PMC - PubMed

Publication types

Substances

Associated data