. 2011 Oct 28;147(3):577-89.
doi: 10.1016/j.cell.2011.09.044.

Lineage regulators direct BMP and Wnt pathways to cell-specific programs during differentiation and regeneration

Affiliations

Lineage regulators direct BMP and Wnt pathways to cell-specific programs during differentiation and regeneration

Eirini Trompouki et al. Cell. .

Abstract

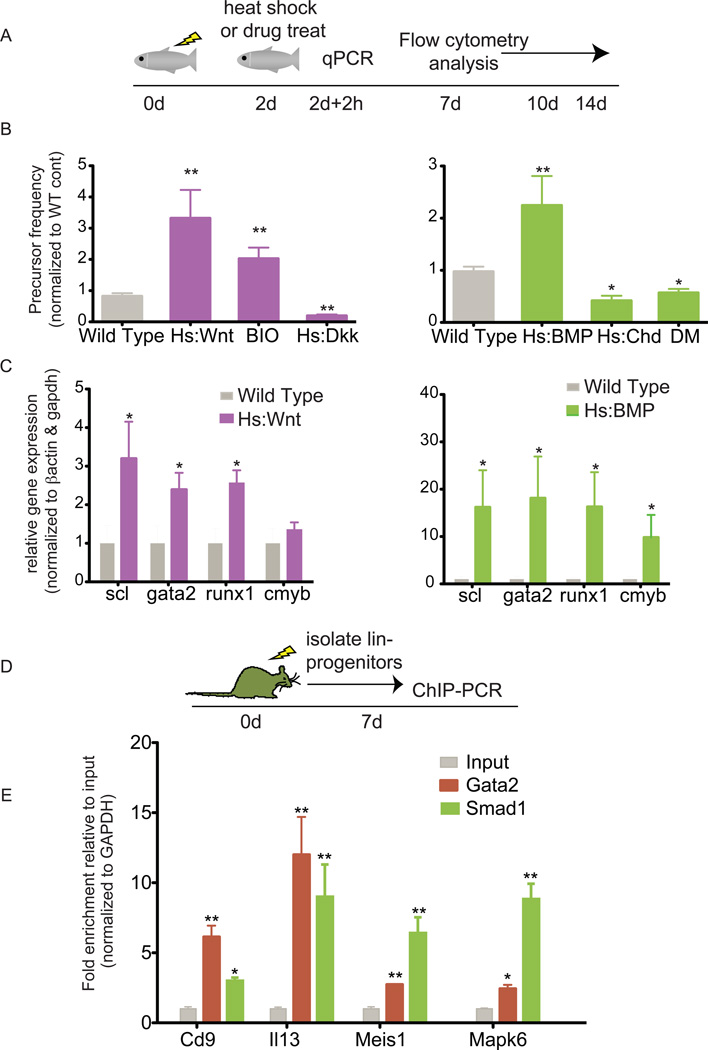
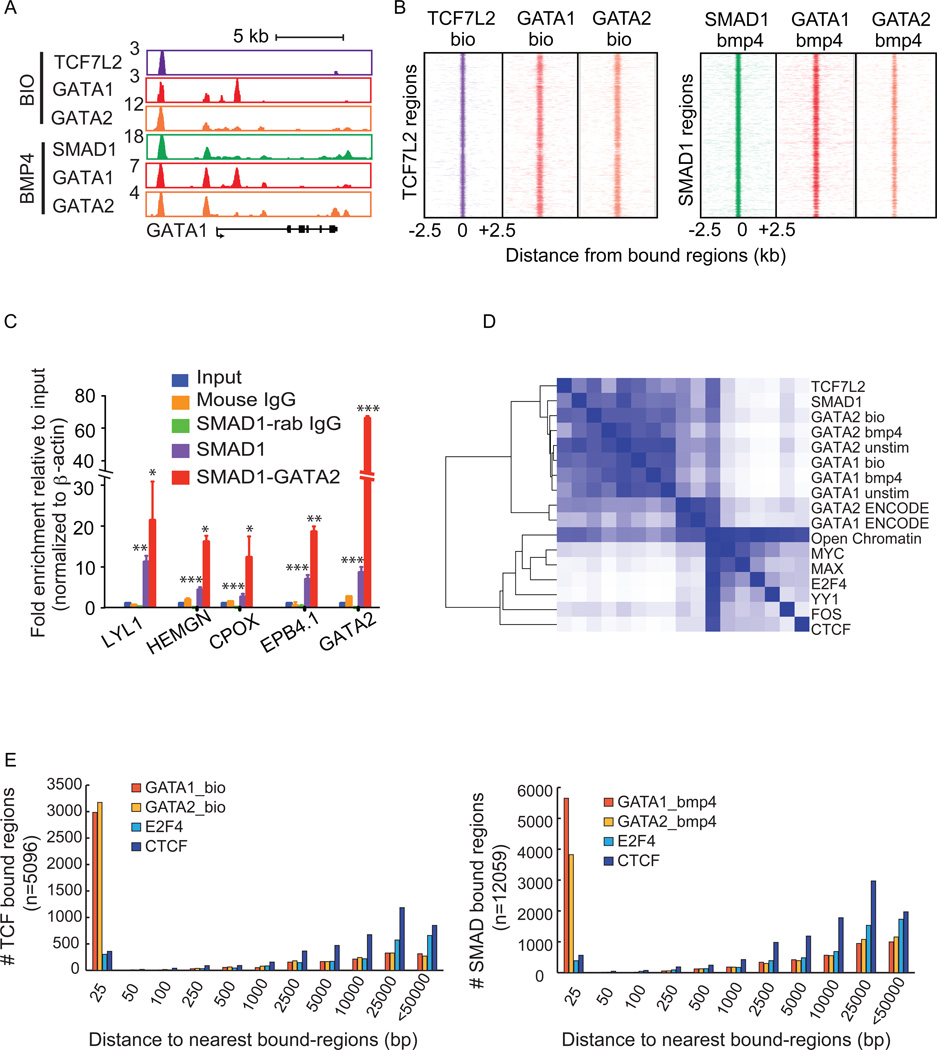
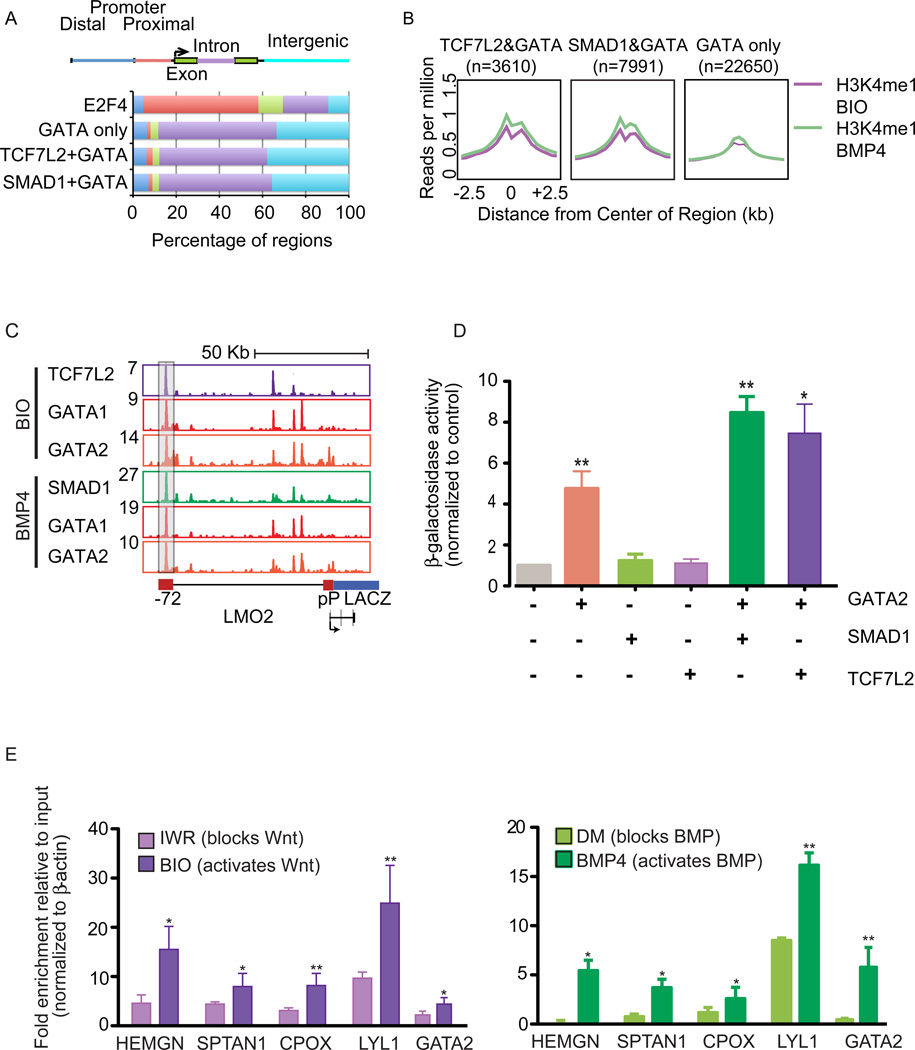
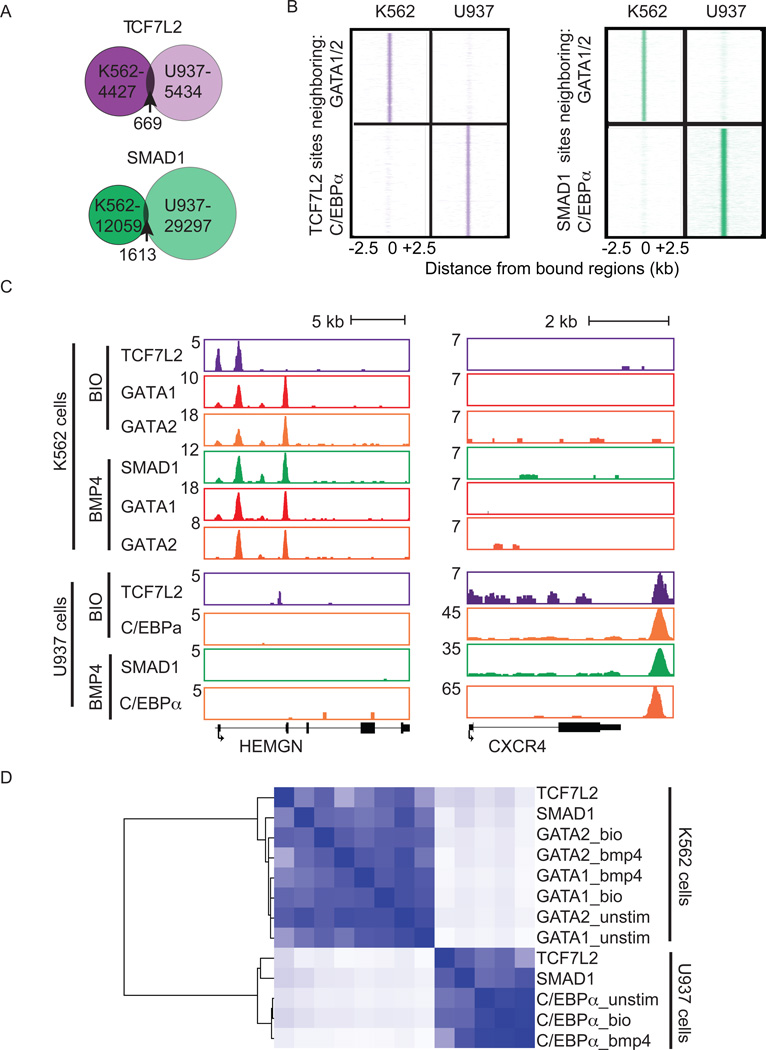
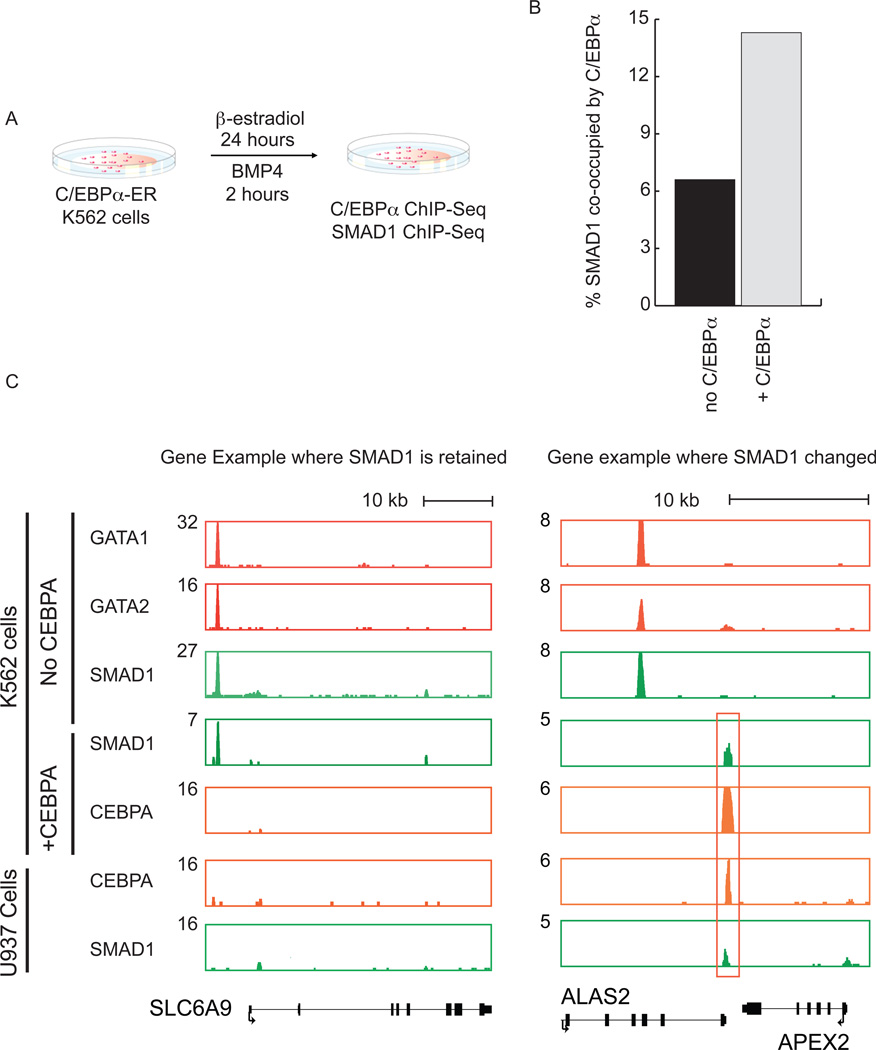
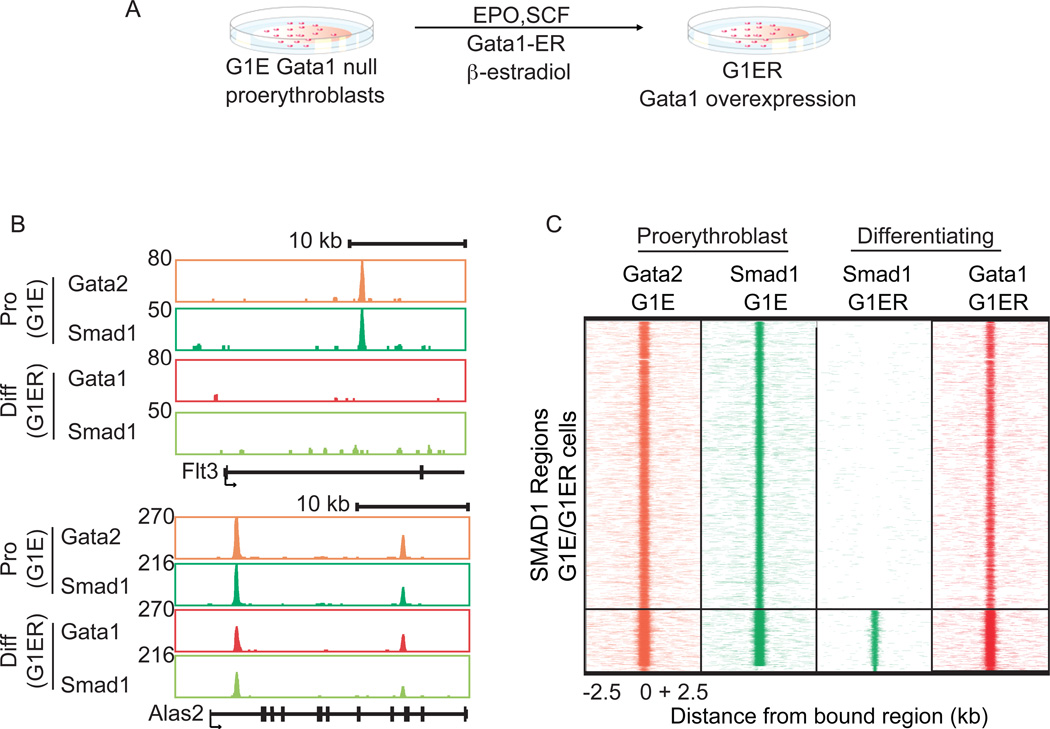
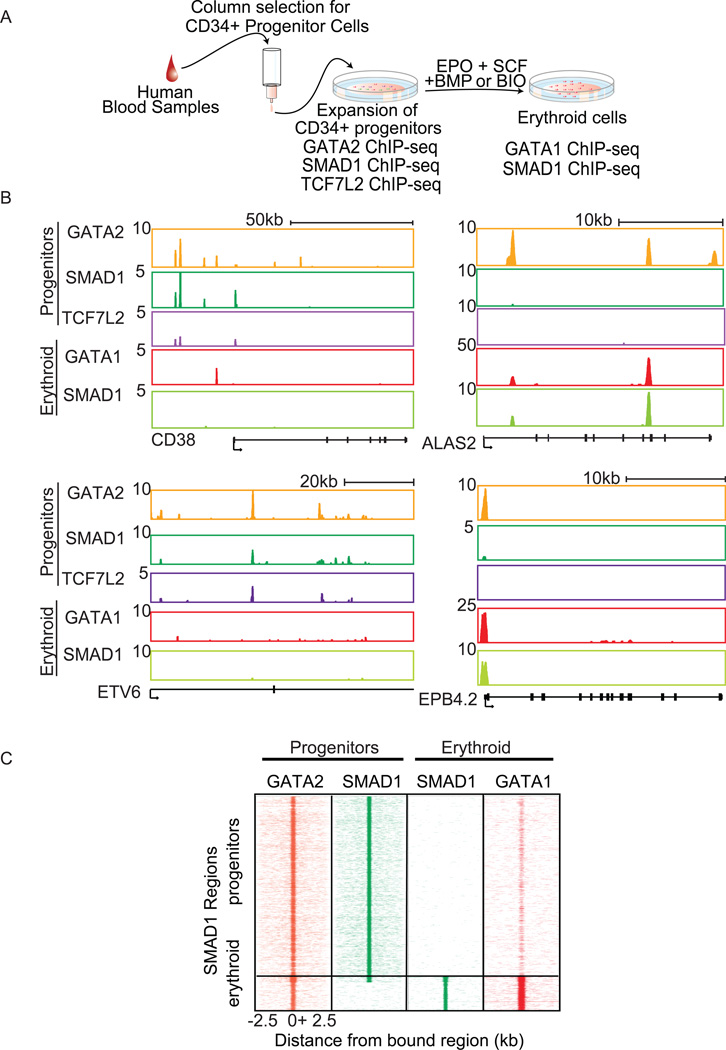
BMP and Wnt signaling pathways control essential cellular responses through activation of the transcription factors SMAD (BMP) and TCF (Wnt). Here, we show that regeneration of hematopoietic lineages following acute injury depends on the activation of each of these signaling pathways to induce expression of key blood genes. Both SMAD1 and TCF7L2 co-occupy sites with master regulators adjacent to hematopoietic genes. In addition, both SMAD1 and TCF7L2 follow the binding of the predominant lineage regulator during differentiation from multipotent hematopoietic progenitor cells to erythroid cells. Furthermore, induction of the myeloid lineage regulator C/EBPα in erythroid cells shifts binding of SMAD1 to sites newly occupied by C/EBPα, whereas expression of the erythroid regulator GATA1 directs SMAD1 loss on nonerythroid targets. We conclude that the regenerative response mediated by BMP and Wnt signaling pathways is coupled with the lineage master regulators to control the gene programs defining cellular identity.


Conflict of interest statement

Conflicts of interest: L.I.Z. is a founder and stock holder of Fate, Inc. and a scientific advisor for Stemgent. G.Q.D. is a member of the Scientific Advisory Boards of MPM Capital, Inc., Epizyme, Inc., and iPierian, Inc.

Figures

Figure 1
Figure 1. BMP and Wnt pathways regulate hematopoietic regeneration
A. Schematic of an irradiation-induced hematopoietic regeneration model. Adult zebrafish are irradiated with 20Gy γ-irradiation at day 0, treated on day 2, and then whole kidney marrow (WKM) are dissected and analyzed by flow cytometry or by QPCR. B. Activation of the Wnt and BMP pathways enhances regeneration in zebrafish. Graphs depicting the relative frequency +/− SEM of precursors in WKM relative to wild type controls following manipulations to the Wnt (left) and BMP (right) pathways. * p<0.05 and **p<0.005, p-values calculated using student’s t-test comparing wild type control treated siblings to treated group. C. Activation of the Wnt (left) and BMP (right) pathways leads to up-regulation of key hematopoietic genes. QPCR graphs of relative gene expression +/− SEM in WKM cells from wild type, Hs:Wnt, or Hs:BMP two days post irradiation following a two hour heat shock induction of Wnt8a or BMP2b transgene expression, respectively. * p<0.05, p-values calculated using student’s t-test comparing wild type control treated siblings to treated group. D–E. Gata2 co-localizes with Smad1 on hematopoietic targets in murine progenitor cells during regeneration. D. Schematic of irradiation model. ChIP for Smad1 and Gata2 was performed on lineage negative progenitors isolated from mice 7 days after a 6.5 Gy irradiation. E. QPCR of whole cell extracts (input), Gata2, and Smad1 ChIP. The bars show relative enrichment +/− SEM compared to input control. * p<0.05 and **p<0.005, p-values calculated using student’s t-test comparing ChIP DNA to input control. See also Figure S1.
Figure 2
Figure 2. SMAD1 and TCF7L2 co-occupy the genome with key regulators of the erythroid lineage
A. Gene track of the GATA1 locus showing TCF7L2 (purple), GATA1 (red), GATA2 (orange), and SMAD1 (green) binding of specific genomic regions along the x-axis and the total number of reads per million on the y-axis. B. SMAD1 and TCF7L2 co-occupy genomic regions with GATA1 and GATA2. Region plots representing the distribution of GATA1 and GATA2 bound regions −2.5 to +2.5 kb relative to all TCF7L2 or SMAD1 bound regions in K562 cells. C. QPCR of whole cell extracts (input), SMAD1 and control mouse IgG, sequential ChIP for GATA2 and control rabbit IgG on the SMAD1 ChIP. The bars show relative enrichment +/− SEM compared to input control. * p<0.08 and **p<0.04, ***p<0.0005, p-values calculated using student’s t-test comparing SMAD1 ChIP to input and SMAD1 ChIP to SMAD1-GATA2 sequential ChIP. D. Co-localization of SMAD1 and TCF7L2 are specific to lineage regulators. Heat map depicting the relative level of co-localization of indicated factors, in K562 cells together with open chromatin data in this cell line. E. E2F4 and CTCF binding is not associated with TCF7L2 or SMAD1. The distance from the center of each TCF7L2 site (left) and SMAD1 site (right) to the center of the nearest site bound by the indicated transcription factor was determined. These distances were grouped into bins (x-axis). The sum of bound sites in each bin is shown (y-axis). See also Figure S2.
Figure 3
Figure 3. Signaling factors cooperate with lineage regulators at distal enhancers
A. TCF7L2 and SMAD1 regions co-localize with GATA factors in intronic and intergenic regions. The groups of enriched regions occupied by GATA factors in K562 cells were divided into those occupied by GATA only, TCF7L2 and GATA, or SMAD1 and GATA. E2F4 is shown as a control. Each region was mapped to their closest RefSeq gene: distal promoter (blue), proximal promoter (red), exons (green), introns (purple) and intergenic regions (light blue) B. TCF7L2 and SMAD1 regions that co-localize with GATA factors occupy mainly enhancer regions. Composite H3K4me1-BIO (purple) and H3K4me1-BMP4 (green) enrichment profile for TCF7L2 and GATA co-bound regions, SMAD1 and GATA co-bound regions or regions occupied only by GATA in K562 cells. C. Gene track of the LMO2 locus. A graph of the LMO2 reporter indicating the enhancer and promoter regions included in the construct is shown below. D. SMAD1 and TCF7L2 co-operate with GATA2 and enhance transcription of target genes. Graph depicting β-galactosidase activity of the reporter +/− SEM following overexpression of the transcription factors listed under each bar. *p<0.06, **p<0.01, p-values calculated using student’s t-test comparing mock transfected controls to GATA2 alone and SMAD1/GATA2 or TCF7L2/GATA2 co-transfections to GATA2 alone. E. Wnt and BMP signaling enhance p300 recruitment to blood-specific targets. ChIP-PCR graphs showing p300 occupancy after activation or inhibition of the Wnt (left) and the BMP (right) pathways. *p<0.06, **p<0.01, p-values calculated using student’s t-test comparing inhibitor-treated samples to activator-treated samples.
Figure 4
Figure 4. TCF7L2 and SMAD1 co-occupy genomic regions with cell-type-specific lineage regulators
A. Venn diagrams depicting the overlap of regions bound in K562 and U937 cells for TCF7L2 (top) and SMAD1 (bottom). Numbers of regions bound by each factor in each cell line or in the overlap of both are shown. B. Region plots comparing the enriched regions of TCF7L2 and SMAD1 in K562 and U937 cells compared to GATA1 and GATA2 (top) or C/EBPα (bottom) regions. C. Gene tracks of HEMGN (left) and CXCR4 (right) showing differential binding of TCF7L2, SMAD1, GATA1, GATA2 and C/EBPα in K562 cells (top) and U937 cells (bottom). D. Heat map depicting the co-localization of GATA1, GATA2, TCF7L2, and SMAD1 in K562 cells and C/EBPα, TCF7L2, and SMAD1 in U937 cells. See also Figure S4.
Figure 5
Figure 5. C/EBPα expression re-positions SMAD1 binding in K562 cells
A. Schematic of C/EBPα-ER K562 experimental model. B. The percentage of SMAD1 sites in K562 cells that are co-occupied by C/EBPα (y-axis) is shown for K562 cells (no C/EBPα) and those induced by C/EBPα (+C/EBPα). The top 1000 SMAD1 binding sites in each condition were used for this calculation. C. Gene tracks of SLC6A9 (left) and ALAS2/APEX2 (right) showing differential binding of GATA1, GATA2 and SMAD1 in K562 cells (top) SMAD1 and C/EBPα in K562 cells expressing C/EBPα (middle) and U937 cells (bottom).
Figure 6
Figure 6. Smad1 localization is directed by Gata1
A. Schematic of the G1E, G1ER experiment. B. Gene tracks of Flt3 (top) and Alas2 (bottom) showing differential binding of Gata2 and Smad1 in G1E Gata1-null cells (Proerythroblast), and Gata1 and Smad1 in G1ER erythroid cells (Differentiating). C. Overexpression of Gata1 re-defines the targets of Smad1. ChIP-seq region plots representing the distribution of regions bound by Smad1 and Gata2 in G1E, and Gata1 and Smad1 in G1ER cells −2.5 and +2.5 kb relative to all Smad1 bound sites in G1E and G1ER combined.
Figure 7
Figure 7. Binding of signaling factors changes during differentiation
A. Schematic of CD34+ experiment. B. Gene tracks of CD38, ETV6, ALAS2, and EPB4.2 showing differential binding of GATA2, SMAD1 and TCF7L2 in undifferentiated CD34+ progenitors, and GATA1 and SMAD1 in differentiated erythroblasts. C. SMAD1 binding becomes restricted to mainly erythroid genes after differentiation of CD34+ hematopoietic cells towards erythrocytes. ChIP-seq region plots representing the distribution of SMAD1 occupied regions in CD34 progenitors (pro) and in vitro differentiated erythroblasts (ery). GATA2 and SMAD1 in CD34+ progenitors and SMAD1 and GATA1 in erythroid differentiated CD34 cells −2.5 to +2.5 kb relative to all SMAD1 bound regions in CD34 progenitors and differentiated erythroblasts. See also Figure S7.

References

    1. Birney E, Stamatoyannopoulos JA, Dutta A, Guigo R, Gingeras TR, Margulies EH, Weng Z, Snyder M, Dermitzakis ET, Thurman RE, et al. Identification and analysis of functional elements in 1% of the human genome by the ENCODE pilot project. Nature. 2007;447:799–816. - PMC - PubMed
    1. Bresnick EH, Lee HY, Fujiwara T, Johnson KD, Keles S. GATA switches as developmental drivers. J Biol Chem. 2010;285:31087–31093. - PMC - PubMed
    1. Burns CE, Traver D, Mayhall E, Shepard JL, Zon LI. Hematopoietic stem cell fate is established by the Notch-Runx pathway. Genes Dev. 2005;19:2331–2342. - PMC - PubMed
    1. Cantor AB. GATA transcription factors in hematologic disease. Int J Hematol. 2005;81:378–384. - PubMed
    1. Chen CR, Kang Y, Siegel PM, Massague J. E2F4/5 and p107 as Smad cofactors linking the TGFbeta receptor to c-myc repression. Cell. 2002;110:19–32. - PubMed

Publication types

Substances

Associated data