. 2024 Dec 3:13:e101702.
doi: 10.7554/eLife.101702.

TPR is required for cytoplasmic chromatin fragment formation during senescence

Affiliations

TPR is required for cytoplasmic chromatin fragment formation during senescence

Bethany M Bartlett et al. Elife. .

Abstract

During oncogene-induced senescence there are striking changes in the organisation of heterochromatin in the nucleus. This is accompanied by activation of a pro-inflammatory gene expression programme - the senescence-associated secretory phenotype (SASP) - driven by transcription factors such as NF-κB. The relationship between heterochromatin re-organisation and the SASP has been unclear. Here, we show that TPR, a protein of the nuclear pore complex basket required for heterochromatin re-organisation during senescence, is also required for the very early activation of NF-κB signalling during the stress-response phase of oncogene-induced senescence. This is prior to activation of the SASP and occurs without affecting NF-κB nuclear import. We show that TPR is required for the activation of innate immune signalling at these early stages of senescence and we link this to the formation of heterochromatin-enriched cytoplasmic chromatin fragments thought to bleb off from the nuclear periphery. We show that HMGA1 is also required for cytoplasmic chromatin fragment formation. Together these data suggest that re-organisation of heterochromatin is involved in altered structural integrity of the nuclear periphery during senescence, and that this can lead to activation of cytoplasmic nucleic acid sensing, NF-κB signalling, and activation of the SASP.

Keywords: cell biology; chromosomes; gene expression; genome integrity; heterochromatin; human; inflammation; nuclear periphery; oncogene; senescence.


Conflict of interest statement

BB, YK, SB, TC, AQ, CB, JA, WB No competing interests declared

Figures

Figure 1.
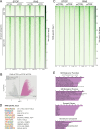
Figure 1.. Senescence-specific accessible chromatin sites dependent on TPR are near senescence-associated secretory phenotype (SASP) genes and are enriched in binding sites for SASP-related transcription factors.
(A) Model of the nuclear pore showing the location of TPR in the nuclear basket and heterochromatin exclusion at the pore. (B) Schematic of experimental protocol for senescence induction in IMR90 cells. After 8 days of treatment with 4-hydroxytamoxifen (4-OHT), the control (STOP) line continues to proliferate while the RAS line becomes senescent due to induction of RASG12V expression. (C) Heatmap showing ATAC-seq signal in control (STOP) and OIS (RAS) cells 8 days after treatment with 4-OHT and transfection with either control (CTRL) or TPR siRNAs. SEN+ indicates signal specific to senescent cells and TPR+ indicates dependence on TPR. Intensity scale represents reads per kilobase per million mapped reads (RPKM). (D) Track views of ATAC-seq data from STOP and RAS cells treated with CTRL or TPR siRNAs at IL1B (top) and IL8 (bottom) gene loci. (E) HOMER motif analysis of the senescence and TPR-dependent ATAC-seq peaks (SEN+ TPR+) and the peaks that are dependent on senescence but not TPR (SEN+ TPR-). The top 10 motifs are shown for each category of peaks. For both analyses all motifs have a p-value<10–13.
Figure 1—figure supplement 1.
Figure 1—figure supplement 1.. TPR-dependent senescence-specific accessible chromatin peaks are enriched in H3K27ac and associated with genes relevant to inflammation.
Related to Figure 1. (A) Volcano plot of differential accessibility analysis of day 8 (d8) ATAC-seq peaks in RAS siCTRL vs STOP siCTRL. The horizontal dashed line indicates an adjusted p-value (FDR) of 0.05. Peaks with a significant increase in accessibility in senescent cells (SEN+) are coloured blue if their accessibility decreases on siTPR treatment (SEN+ TPR+), or pink if their accessibility does not change on siTPR treatment (SEN+ TPR-). (B) Heatmap of H3K27 acetylation (H3K27ac) ChIP-seq data from growing and senescent IMR90 cells (Parry et al., 2018) for the TPR-dependent (TPR+) and TPR-independent (TPR-) peaks defined in Figure 1C. (C) Top ranking results of gene ontology analysis of genes close to SEN+TPR+ peaks using the Genomic Regions Enrichment of Annotations Tool (GREAT) package (McLean et al., 2010). (D) As in (C) but for genes close to SEN+ TPR- peaks.
Figure 2.
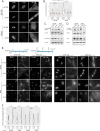
Figure 2.. Prolonged loss of TPR during senescence blocks NF-κB activation.
(A) TPR and NF-κB immunostaining in control (STOP) and oncogene-induced senescence (OIS) (RAS) cells after 4-hydroxytamoxifen (4-OHT) and siRNA (control and TPR) treatment for 8 days. Scale bar: 10 μm. (B) Quantification of NF-κB nucleocytoplasmic ratios in experiment described in (A). Kruskal-Wallis testing was used to determine statistical significance followed by Dunn’s post hoc testing. n.s. p>0.05, ***<0.001. (n) indicates the number of cells analysed for each sample. Data from a biological replicate are in Figure 2—figure supplement 1A. Statistical data are in Figure 2—source data 1. (C) Immunoblots of extracts from control (STOP) and OIS (RAS) cells after 4-OHT and siRNA treatment for 8 days for phosphorylated (pS536) and total NF-κB with vinculin as a loading control. Numbers below indicate the ratio of band intensity for NF-κBpS536 or NF-κB and the vinculin loading control with the ratio for RAS siCTRL normalised to 1.00. (D) As in (C) but for phosphorylated (pS176/180) IKKα/β and total IKKα and with β-actin as a loading control. Data from biological replicates of (C) and (D) are in Figure 2—figure supplement 1B and C. (E) Above: Schematic of controlled media experiment to investigate whether TPR loss causes a general defect in NF-κB transport. STOP and RAS cells were grown for 8 days and treated with 4-OHT and siRNAs. On day 8 (d8) they were treated for 45 min with conditioned media (CM) taken from either STOP or RAS cells grown in 4-OHT-containing media for 8 days. Below left: NF-κB immunostaining in STOP or RAS cells treated with CM harvested from STOP (left) or RAS (right) cells. Scale bar: 50 μm. Below right: Same experiment with images shown at greater magnification. Scale bar: 10 μm. (F) Quantification of NF-κB nucleocytoplasmic ratios for experiment shown in (E). Data from a biological replicate are in Figure 2—figure supplement 1D. Statistical data are in Figure 2—source data 1.
Figure 2—figure supplement 1.
Figure 2—figure supplement 1.. TPR depletion blocks NF-κB activation during senescence.
Related to Figure 2. (A) Quantification of NF-κB nucleocytoplasmic ratios by immunofluorescence in STOP and RAS cells after 4-hydroxytamoxifen (4-OHT) and siRNA treatment for 8 days. Kruskal-Wallis testing was used to determine statistical significance followed by Dunn’s post hoc testing. n.s. p>0.05, ***<0.001. (n) indicates the number of cells analysed for each sample. Data are from a biological replicate of the experiment shown in Figure 2B. Statistical data are in Figure 2—source data 1. (B) Immunoblots in extracts from control (STOP) and OIS (RAS) cells after 4-OHT and siRNA (control and TPR) treatment for 8 days for phosphorylated (pS536) and total NF-κB with vinculin as a loading control. Numbers below indicate the ratio of band intensity for NF-κBpS536 or NF-κB and the vinculin loading control with the ratio for RAS siCTRL normalised to 1.00. Biological replicate of data in Figure 2C. (C) As in (B) but for phosphorylated (pS176/180) IKKα/β and total IKKα and with GAPDH as a loading control. Biological replicate of data in Figure 2D. (D) Quantification of NF-κB nucleocytoplasmic ratios in d8 STOP and RAS treated for 45 min with conditioned media (CM) from either STOP or RAS cells grown in 4-OHT-containing media for 8 days. Data are from a biological replicate of experiment in Figure 2F. Statistical data are in Figure 2—source data 1.
Figure 3.
Figure 3.. Decreased NF-κB activation upon TPR knockdown precedes the senescence-associated secretory phenotype (SASP).
(A) Schematic showing positive feedback loop in SASP signalling. Secreted IL-1α and IL-1β bind IL-1R1 at the cell membrane, leading to increased NF-κB activation and increased IL-1α and IL-1β secretion. (B) NF-κB immunostaining in control (STOP) and oncogene-induced senescence (OIS) (RAS) cells after 4-hydroxytamoxifen (4-OHT) and siRNA treatment for either 3 or 5 days. Scale bar: 10 μm. (C and D) Quantification of (C) nucleocytoplasmic ratios of NF-κB or (D) NF-κB nuclear intensity from experiment shown in (B). (n) indicates the number of cells analysed for each sample. Kruskal-Wallis testing was used to determine statistical significance followed by Dunn’s post hoc testing. n.s. p>0.05, *<0.05, ***<0.001. (E) Immunoblots for phosphorylated (pS536) and total NF-κB (p65) in STOP and RAS cells treated with 4-OHT for 3 or 5 days and with control (CTRL) or TPR siRNAs. Vinculin was used as a loading control. Numbers below indicate the ratio of band intensity for NF-κBpS536 or NF-κB and the vinculin loading control with the ratio for RAS siCTRL normalised to 1.00. (F) As in (E) but blotting to detect phosphorylated (pS176/180) IKKα/β and total IKKα. GAPDH was used as a loading control. Data from a biological replicate of the data in (A–E) are in Figure 3—figure supplement 1. Statistical data are in Figure 3—source data 1.
Figure 3—figure supplement 1.
Figure 3—figure supplement 1.. Decreased NF-κB activation upon TPR knockdown at days 3 and 5.
Related to Figure 3. (A and B) Quantification of (A) nucleocytoplasmic ratios of NF-κB or (B) nuclear NF-κB intensity from a biological replicate of the experiment shown in Figure 3B–D. (n) indicates the number of cells analysed for each sample. Kruskal-Wallis testing was used to determine statistical significance followed by Dunn’s post hoc testing. n.s. p>0.05, *<0.05, ***<0.001. Statistical data are in Figure 3—source data 1. (C) Immunoblots for phosphorylated (pS536) and total NF-κB (p65) in STOP and RAS cells treated with 4-hydroxytamoxifen (4-OHT) for 3 or 5 days and with control (CTRL) or TPR siRNAs. Vinculin was used as a loading control. Numbers below indicate the ratio of band intensity for NF-κBpS536 or NF-κB and the vinculin loading control with the ratio for RAS siCTRL normalised to 1.00. Biological replicate of data in Figure 3E. (D) As in (C) but blotting to detect phosphorylated (pS176/180) IKKα/β and total IKKα. GAPDH was used as a loading control. Biological replicate of data in Figure 3F.
Figure 3—figure supplement 2.
Figure 3—figure supplement 2.. TPR knockdown does not affect chromatin accessibility at day 3 (d3).
(A) Heatmap showing ATAC-seq signal in control (STOP) and oncogene-induced senescence (OIS) (RAS) cells 3 days after 4-hydroxytamoxifen (4-OHT) treatment and transfected with either CTRL or TPR siRNAs. Peak categories are those defined from the d8 ATAC-seq data in Figure 1C. Intensity scale represents reads per kilobase per million mapped reads (RPKM). (B) Volcano plot of differential accessibility analysis of d3 ATAC-seq peaks in RAS siCTRL vs STOP siCTRL. The horizontal dashed line indicates an adjusted p-value (FDR) of 0.05. Peaks with a significant increase in accessibility in RAS cells are coloured pink if their accessibility does not change on siTPR treatment. Any peaks that did change would have been coloured blue as in Figure 1—figure supplement 1A. (C) Heatmap showing ATAC-seq signal in control (STOP) and OIS (RAS) cells 3 days after 4-OHT treatment and transfected with either CTRL or TPR siRNAs. Peaks that gain accessibility in RAS cells are shown. Intensity scale represents RPKM. (D) HOMER motif analysis of the d3 RAS-specific ATAC-seq peaks. The top 10 motifs are shown for each category of peaks. All motifs have a p-value<10–197. (E) Top ranking results of gene ontology analysis of genes close to d3 RAS-specific peaks using the Genomic Regions Enrichment of Annotations Tool (GREAT) package (McLean et al., 2010).
Figure 4.
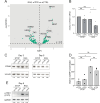
Figure 4.. Decreased STING expression and TBK1 activation upon TPR knockdown during early stages of oncogene-induced senescence (OIS).
(A) Volcano plot of differential expression analysis of RNA isolated from RAS cells at day 3 (d3) of OIS and treated with siTPR vs siCTRL. Genes showing a significant change in expression in RAS, but not in STOP cells are indicated in green and the 10 most significant of these are labelled. Horizontal dashed line indicates an adjusted p-value (FDR) of 0.05. Axes are truncated for clarity so the change in TPR expression is not shown. (B) RT-qPCR for STING1 mRNA in RNA prepared from STOP and RAS cells treated with 4-hydroxytamoxifen (4-OHT) for 3 days and with control (siCTRL) and TPR siRNAs. Expression is relative to STOP cells treated with siCTRL and normalised to levels of GAPDH mRNA. Individual data points are the mean of three technical replicates for each of four biological replicates. Statistical data are in Figure 4—source data 1. (C) Immunoblots detecting STING in STOP and RAS cells treated with 4-OHT for 3 or 5 days and with control (siCTRL) or TPR siRNAs. Vinculin was used as a loading control. Numbers below indicate the ratio of band intensity for STING and the vinculin loading control with the ratio for RAS siCTRL normalised to 1.00. (D) ELISA for 2’3’-cGAMP in STOP and RAS cells treated with 4-OHT for 5 days and with control (siCTRL) or TPR siRNAs. cGAMP concentration was normalised to total protein concentration calculated using BCA assay. Statistical data are in Figure 4—source data 1. *p<0.05. (E) As in (C) but detecting phosphorylated TBK1 (pS172) in STOP and RAS cells at d5 of OIS. GAPDH was used as a loading control. Data from biological replicates for (C) and (E) are in Figure 4—figure supplement 1C and D.
Figure 4—figure supplement 1.
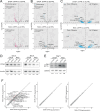
Figure 4—figure supplement 1.. Decreased abundance of mRNAs for intronless genes and for STING1 in RAS cells upon TPR knockdown at day 3 (d3).
Related to Figure 4. (A) Volcano plots of differential expression analysis of d3 STOP (top) and RAS (bottom) cells treated with TPR vs CTRL siRNAs with intronless genes coloured pink. Horizontal dashed line indicates an adjusted p-value (FDR) of 0.05. Axes are truncated for clarity so change in expression for TPR is not shown. Fisher’s exact test (p) was carried out to determine whether the number of downregulated intronless genes was greater than expected by chance. (B) As in (A) but with histone genes labelled in blue. (C) Volcano plot showing differential expression analysis comparing siTPR vs siCTRL in d3 STOP (top) or RAS (bottom) cells. Blue dots indicate differentially expressed genes and the dashed horizontal line indicates an adjusted p-value of 0.05. The 10 genes with the most significant p-values are labelled. (D) Immunoblots detecting STING in STOP and RAS cells treated with 4-hydroxytamoxifen (4-OHT) for 3 or 5 days and with control (siCTRL) or TPR siRNAs. Vinculin was used as a loading control. Numbers below indicate the ratio of band intensity for STING and the vinculin loading control with the ratio for RAS siCTRL normalised to 1.00. Biological replicate of the data in Figure 4C. (E) As in (D) but detecting phosphorylated TBK1 (pS172) in STOP and RAS cells at d5 of oncogene-induced senescence (OIS). GAPDH was used as a loading control. Biological replicate of the data in Figure 4D. (F) Log-transformed RNA sequencing (RNA-seq) counts for RNAs transcribed from transposable elements comparing (left) RAS vs STOP cells at d3 and treated with control siRNAs; (middle) d3 STOP cells treated with control vs TPR siRNAs; (right) d3 RAS cells treated with control vs TPR siRNAs. Transposable elements with absolute fold changes>1.5 and adjusted p-values<0.05 are highlighted in red and labelled.
Figure 5.
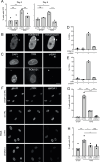
Figure 5.. TPR and HMGA1 are required for the induction of cytoplasmic chromatin fragments (CCFs) during the early phase of oncogene-induced senescence (OIS).
(A) Mean percentage of cells containing CCFs in STOP and RAS cells at day 3 (d3) or d5 of OIS and treated with either control (siCTRL) or TPR siRNAs. Data points are for three biological replicates. Data were fitted to a generalised linear model before carrying out pairwise comparisons between samples. n.s. p>0.05, *<0.05, ***<0.001. (B) Immunostaining for H3K9me3 and H3K27me2/3 in a DAPI-stained d5 RAS cell with a CCF. Scale bar: 10 μm. (C) As in (B) but in d5 RAS cells containing CCFs and staining for γH2AX and either TPR (top) or POM121 (bottom). Scale bar: 10 μm. (D) Mean percentage of CCFs that show +ve or -ve staining for POM121 or γ-H2AX in d5 RAS cells. Data are from two biological replicates (n=49 and 67 CCFs). (E) Mean percentage of CCFs that show +ve or -ve staining for TPR or γ-H2AX in d5 RAS cells. Data are from two biological replicates (n=56 and 36 CCFs). (F) TPR and HMGA1 immunostaining in control (STOP) and OIS (RAS) cells after 4-hydroxytamoxifen (4-OHT) and siRNA (control, TPR and HMGA1) treatment for 5 days. Scale bar: 10 µm. (G) Mean percentage of cells containing senescence-associated heterochromatic foci (SAHF) in STOP and RAS cells at d5 of OIS and treated with either control (siCTRL), TPR, or HMGA1 siRNAs. Data points are for four biological replicates. Data were fitted to a generalised linear model before carrying out pairwise comparisons between samples. *** p<0.001. (H) Mean percentage of cells containing CCFs in cells treated as in (G). Data points are for four biological replicates. Data were fitted to a generalised linear model before carrying out pairwise comparisons between samples. n.s. p>0.05, *<0.05, ***<0.001. Statistical data from (A–G) are in Figure 5—source data 1.
Author response image 1.
Author response image 2.

Update of

  • doi: 10.1101/2024.04.18.590085

References

    1. Abe T, Barber GN. Cytosolic-DNA-mediated, STING-dependent proinflammatory gene induction necessitates canonical NF-κB activation through TBK1. Journal of Virology. 2014;88:5328–5341. doi: 10.1128/JVI.00037-14. - DOI - PMC - PubMed
    1. Acosta JC, O’Loghlen A, Banito A, Guijarro MV, Augert A, Raguz S, Fumagalli M, Da Costa M, Brown C, Popov N, Takatsu Y, Melamed J, d’Adda di Fagagna F, Bernard D, Hernando E, Gil J. Chemokine signaling via the CXCR2 receptor reinforces senescence. Cell. 2008;133:1006–1018. doi: 10.1016/j.cell.2008.03.038. - DOI - PubMed
    1. Acosta JC, Banito A, Wuestefeld T, Georgilis A, Janich P, Morton JP, Athineos D, Kang TW, Lasitschka F, Andrulis M, Pascual G, Morris KJ, Khan S, Jin H, Dharmalingam G, Snijders AP, Carroll T, Capper D, Pritchard C, Inman GJ, Longerich T, Sansom OJ, Benitah SA, Zender L, Gil J. A complex secretory program orchestrated by the inflammasome controls paracrine senescence. Nature Cell Biology. 2013;15:978–990. doi: 10.1038/ncb2784. - DOI - PMC - PubMed
    1. Aksenova V, Smith A, Lee H, Bhat P, Esnault C, Chen S, Iben J, Kaufhold R, Yau KC, Echeverria C, Fontoura B, Arnaoutov A, Dasso M. Nucleoporin TPR is an integral component of the TREX-2 mRNA export pathway. Nature Communications. 2020;11:4577. doi: 10.1038/s41467-020-18266-2. - DOI - PMC - PubMed
    1. Boumendil C, Hari P, Olsen KCF, Acosta JC, Bickmore WA. Nuclear pore density controls heterochromatin reorganization during senescence. Genes & Development. 2019;33:144–149. doi: 10.1101/gad.321117.118. - DOI - PMC - PubMed

MeSH terms

Associated data