. 2024 Sep 4;15(1):7730.
doi: 10.1038/s41467-024-51884-8.

Cannabidiol ameliorates mitochondrial disease via PPARγ activation in preclinical models

Affiliations

Cannabidiol ameliorates mitochondrial disease via PPARγ activation in preclinical models

Emma Puighermanal et al. Nat Commun. .

Abstract

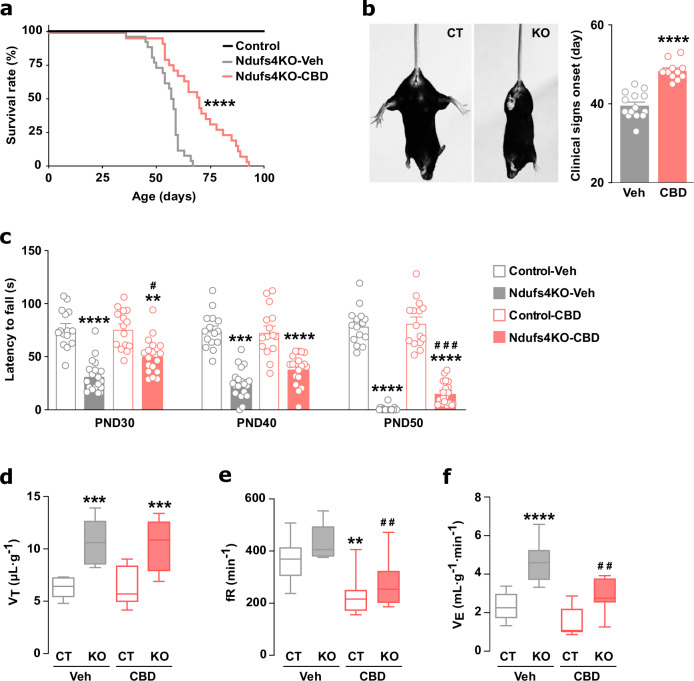
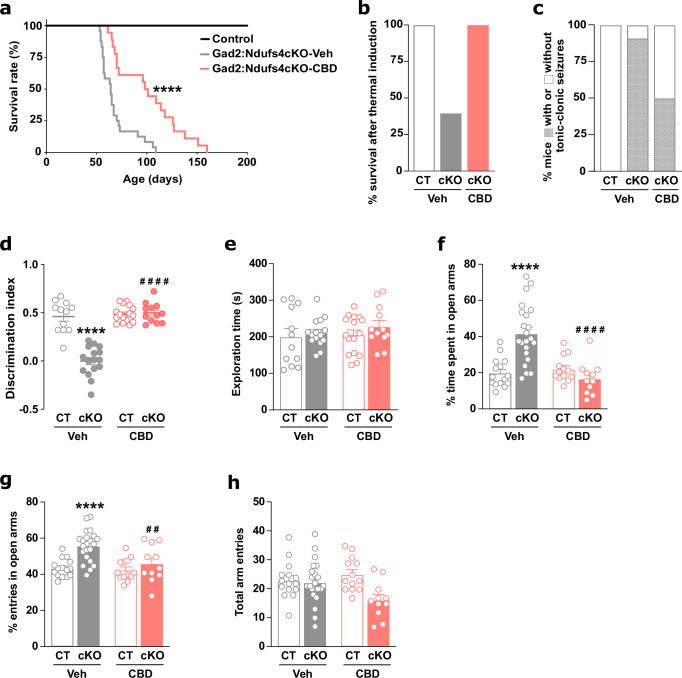
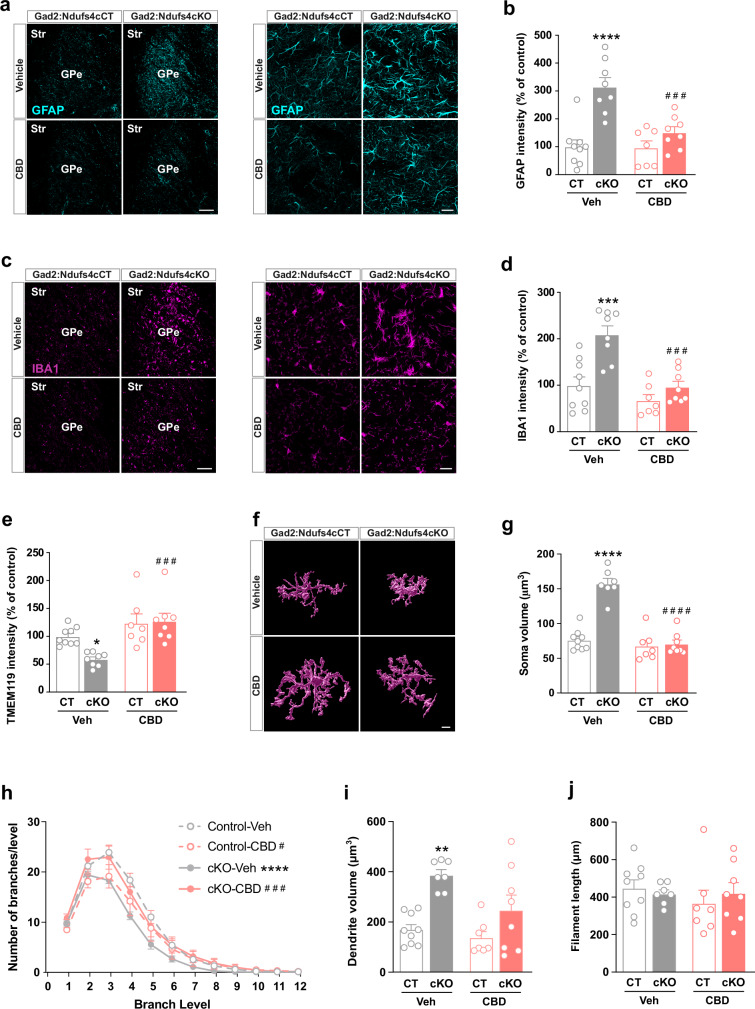
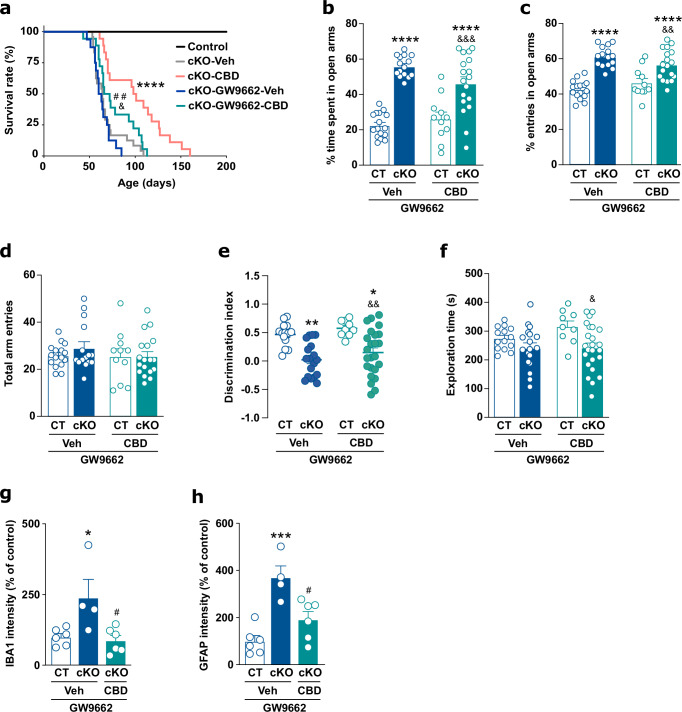
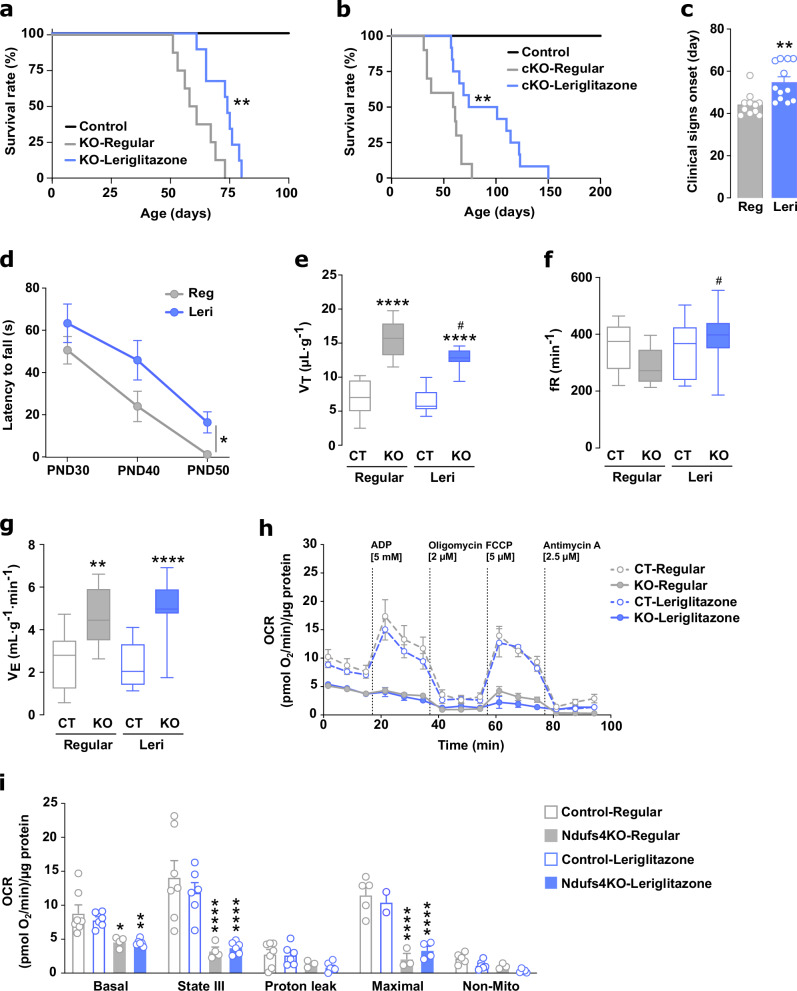
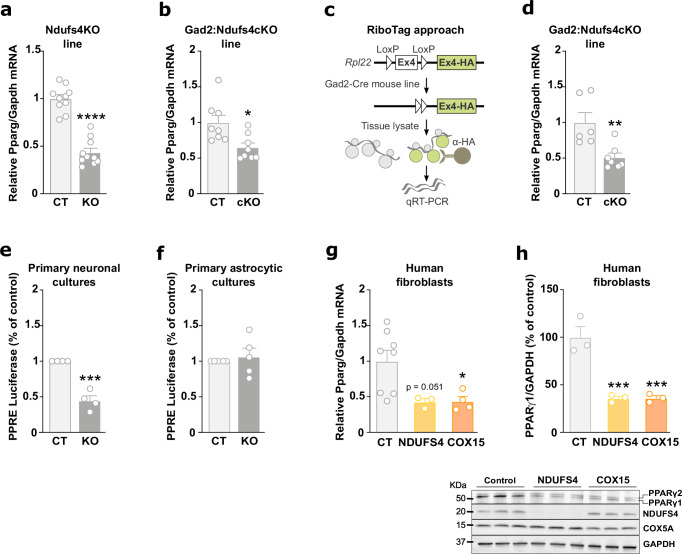
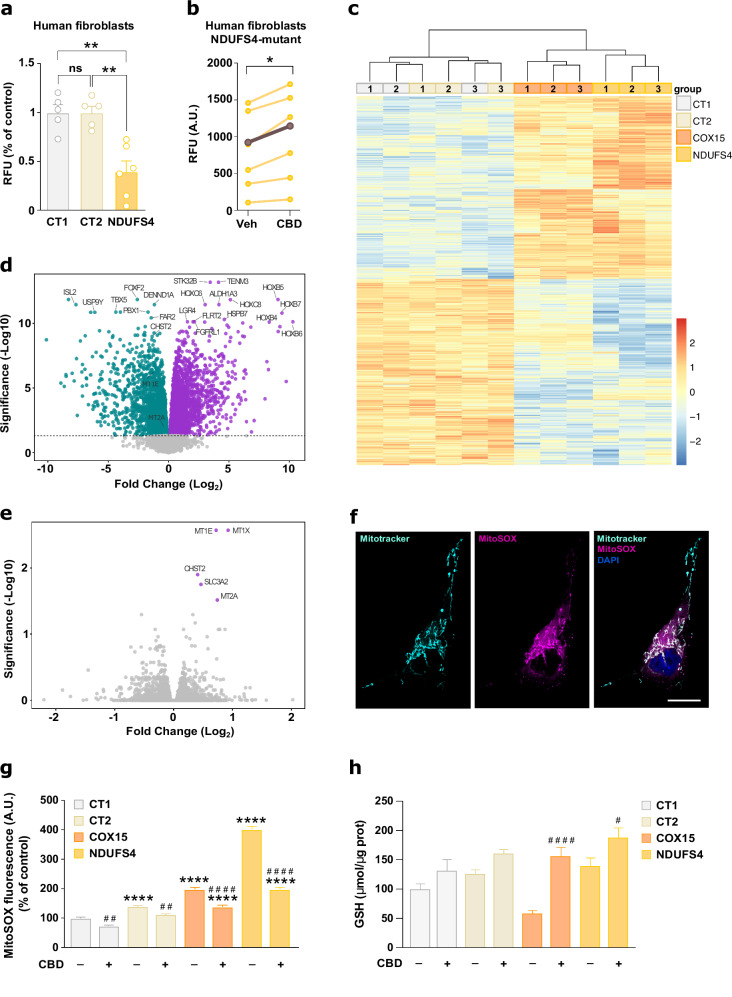
Mutations in mitochondrial energy-producing genes lead to a heterogeneous group of untreatable disorders known as primary mitochondrial diseases (MD). Leigh syndrome (LS) is the most common pediatric MD and is characterized by progressive neuromuscular affectation and premature death. Here, we show that daily cannabidiol (CBD) administration significantly extends lifespan and ameliorates pathology in two LS mouse models, and improves cellular function in fibroblasts from LS patients. CBD delays motor decline and neurodegenerative signs, improves social deficits and breathing abnormalities, decreases thermally induced seizures, and improves neuropathology in affected brain regions. Mechanistically, we identify peroxisome proliferator-activated receptor gamma (PPARγ) as a key nuclear receptor mediating CBD's beneficial effects, while also providing proof of dysregulated PPARγ expression and activity as a common feature in both mouse neurons and fibroblasts from LS patients. Taken together, our results provide the first evidence for CBD as a potential treatment for LS.


Conflict of interest statement

E.P., E.S., and A.Q. are listed as inventors on a patent application submitted by Autonomous University of Barcelona for the use of CBD described in this paper. L.R-P., P.P., C.V., and M.M. are current employees at Minoryx Therapeutics. The remaining authors declare no competing interests.

Figures

Fig. 1
Fig. 1. Repeated CBD treatment (100 mg/kg) prolongs survival and improves motor and breathing alterations in Ndufs4KO mice.
a Kaplan–Meier survival curve of Ndufs4KO mice treated with vehicle (n = 26, gray) and CBD (n = 25, red, Log-rank test ****p < 0.0001), and control mice (n = 20, black). b Clasping/twisting onset in Ndufs4KO treated with vehicle (n = 14, gray) and CBD (n = 11, red, unpaired two-tailed t-test, ****p < 0.0001). c Rotarod performance in vehicle- and CBD-treated Ndufs4KO (n = 19 mice/group) and control mice (n = 15 mice/group, three-way ANOVA followed by Tukey’s multiple comparisons test, **p = 0.0076, ***p = 0.0003, ****p < 0.0001 [genotype effect]; #p = 0.0278, ###p = 0.0004 [treatment effect]). Time to fall off is represented among the 3 tested days (PND30, 40, and 50). Respiratory tidal volume (d), frequency (e), and total ventilation (f) of vehicle- (n = 6 mice) and CBD-treated Ndufs4KO (n = 7 mice) and control mice (n = 11 mice/group, two-way ANOVA followed by Tukey’s multiple comparisons test, **p < 0.01, ***p < 0.001, ****p < 0.0001 [genotype effect]; #p < 0.05, ##p < 0.01, ####p < 0.0001 [treatment effect]). Boxplots show the median (horizontal line), upper and bottom quartiles (box outlines) and the maximum and minimum non-outlier data points (whiskers). All data are presented as mean values ±  SEM. All source data are provided as a source data file. Veh vehicle, CT control mice, KO Ndufs4KO mice, VT Tidal volume, fR Respiratory frequency, VE Total ventilation.
Fig. 2
Fig. 2. CBD treatment (100 mg/kg) extends lifespan, reduces seizures, and ameliorates associated comorbidities in a MD-fatal epilepsy mouse model.
a Kaplan–Meier survival curve of Gad2:Ndufs4cKO mice treated daily with vehicle (n = 24, gray) and CBD (n = 18, red, Log-rank test ****p < 0.0001), and control mice (n = 20, black). b % of Gad2:Ndufs4cKO mice acutely treated with vehicle (n = 5) or CBD (100 mg/kg, n = 7) upon thermally induced seizure onset that survived for the next 8 h. c % of Gad2:Ndufs4cKO mice acutely treated with vehicle (n = 5) or CBD (100 mg/kg, n = 5) 1 h before thermally inducing seizures that displayed (gray) or not (white) tonic-clonic seizures at some point during the next 4 h after seizure onset. Discrimination index of the time exploring a stranger mouse over an empty wire cage (d) and total exploration time (e) in the 3-chamber social interaction test of Gad2:Ndufs4cKO and control mice treated daily with vehicle or CBD (n = 12 [control-vehicle and Gad2:Ndufs4cKO-CBD], 16 [control-CBD and Gad2:Ndufs4cKO-vehicle], two-way ANOVA followed by Tukey’s multiple comparisons test, ****p < 0.0001 [genotype effect]; ####p < 0.0001 [treatment effect]). % of time spent in open arms (f), % of entries in open arms (g), and total arm entries (h) in the elevated plus maze test of Gad2:Ndufs4cKO and control mice treated daily with vehicle or CBD (n = 15 [control-vehicle], 22 [Gad2:Ndufs4cKO-vehicle], 13 [control-CBD], 11 [Gad2:Ndufs4cKO-CBD], two-way ANOVA followed by Tukey’s multiple comparisons test, ****p < 0.0001 [genotype effect]; ##p = 0.0055, ####p < 0.0001 [treatment effect]). All data are presented as mean values ±  SEM. All source data are provided as a source data file. Veh vehicle, CT control mice, cKO Gad2:Ndufs4cKO mice.
Fig. 3
Fig. 3. Repeated CBD treatment (100 mg/kg) reduces neuroinflammation in the GPe of a LS mouse model.
Representative immunofluorescence images (left) and z-stack of higher magnification images (right) (a) and quantification of GFAP fluorescence signal intensity (b) of the astroglial marker GFAP in the GPe of daily CBD- or vehicle-treated control (Gad2:Ndufs4cCT) and Gad2:Ndufs4cKO mice (n = 9 [control-vehicle], 7 [control-CBD], 8 [Gad2:Ndufs4cKO-treated groups], two-way ANOVA/Tukey’s multiple comparisons test, ****p < 0.0001 [genotype effect]; ###p = 0.0008 [treatment effect]). Representative immunofluorescence images (left) and z-stack of higher magnification images (right) (c) and quantification of IBA1 fluorescence signal intensity (d) of the microglia/macrophage marker IBA1 in the GPe of daily CBD- or vehicle-treated Gad2:Ndufs4cCT and Gad2:Ndufs4cKO mice (n = 9 [control-vehicle], 7 [control-CBD], 8 [Gad2:Ndufs4cKO-treated groups], two-way ANOVA/Tukey’s multiple comparisons test, ***p = 0.0002 [genotype effect]; ###p = 0.0002 [treatment effect]). e Quantification of TMEM119 fluorescence signal intensity in the GPe of daily CBD- or vehicle-treated control and Gad2:Ndufs4cKO mice (n = 9 [control-vehicle], 7 [control-CBD], 8 [Gad2:Ndufs4cKO-treated groups], two-way ANOVA/Tukey’s multiple comparisons test, *p = 0.0446 [genotype effect]; ###p = 0.0006 [treatment effect]). f Representative 3D microglia reconstruction using Imaris of each group. g Quantification of soma volume/cell of IBA1+ cells (n = 9 [control-vehicle], 7 [control-CBD and Gad2:Ndufs4cKO-vehicle], 8 [Gad2:Ndufs4cKO-CBD], two-way ANOVA/Tukey’s multiple comparisons test, ****p < 0.0001 [genotype effect]; ####p < 0.0001 [treatment effect]). h Distribution plot of microglial ramification (n = 9 [control-vehicle], 7 [control-CBD and Gad2:Ndufs4cKO-vehicle], 8 [Gad2:Ndufs4cKO-CBD], two-way ANOVA/Tukey’s multiple comparisons test, ****p < 0.0001 [genotype effect]; #p = 0.0477, ###p = 0.0001 [treatment effect]). i Quantification of total dendrite volume/cell of IBA1+ cells (n = 9 [control-vehicle], 7 [control-CBD and Gad2:Ndufs4cKO-vehicle], 8 [Gad2:Ndufs4cKO-CBD], two-way ANOVA/Tukey’s multiple comparisons test, **p = 0.0013 [genotype effect]). j Quantification of total dendrite length/cell of IBA1+ cells (n = 9 [control-vehicle], 7 [control-CBD and Gad2:Ndufs4cKO-vehicle], 8 [Gad2:Ndufs4cKO-CBD]). All data are presented as mean values ±  SEM. All source data are provided as a source data file. Veh vehicle, CT control mice, cKO Gad2:Ndufs4cKO mice. Scale bars: a, c: 100 μm (left) and 20 μm (right), f: 8 μm.
Fig. 4
Fig. 4. A PPARγ antagonist pretreatment prevents CBD-mediated lifespan extension and most disease comorbidities.
a Kaplan–Meier survival curve of Gad2:Ndufs4cKO mice treated daily with vehicle (n = 24, gray), CBD (n = 18, red), GW9662+Veh (n = 16, blue), GW9662 + CBD (n = 18, green), and control mice (n = 20, black). GW9662 (1 mg/kg) was administered 20 min before each CBD or vehicle injection (Long-rank test, ****p < 0.0001 vs Veh-treated Gad2:Ndufs4cKO mice; ##p = 0.0040 vs CBD-treated Gad2:Ndufs4cKO mice; &p = 0.0112 vs GW9662-Veh-treated Gad2:Ndufs4cKO mice). Survival graphs of Gad2:Ndufs4cKO-Veh (gray) and Gad2:Ndufs4cKO-CBD (red) are also displayed in Fig. 2a. % of time spent in open arms (b), % of entries in open arms (c), and total arm entries (d) in the elevated plus maze of Gad2:Ndufs4cKO and control mice pretreated daily with GW9662 20 min before vehicle (blue, n = 16 [control], 15 [Gad2:Ndufs4cKO]) or CBD (green, n = 11 [control], 18 [Gad2:Ndufs4cKO]) administration (two-way ANOVA followed by Tukey’s multiple comparisons test, ****p < 0.0001 vs Veh-treated control; &&p = 0.0028, &&&p = 0.0002 vs CBD-treated control). Discrimination index of the time exploring a stranger mouse over an empty wire cage (e) and total exploration time (f) in the 3-chamber social interaction test of Gad2:Ndufs4cKO and control mice pretreated daily with GW9662 20 min before vehicle (blue, n = 14 [control], 18 [Gad2:Ndufs4cKO]) or CBD (green, n = 9 [control], 24 [Gad2:Ndufs4cKO]) administration (two-way ANOVA followed by Tukey’s multiple comparisons test, *p = 0.0178, **p = 0.0010 vs Veh-treated control; &p = 0.0322, &&p = 0.0048 vs CBD-treated control). Quantification of IBA1 (g) or GFAP (h) fluorescence signal intensity in the GPe of Gad2:Ndufs4cKO and control mice pretreated daily with GW9662 20 min before vehicle (blue, n = 6 [control], 4 [Gad2:Ndufs4cKO]) or CBD (green, n = 6) administration (one-way ANOVA followed by Tukey’s multiple comparisons test, *p = 0.0404, ***p = 0.0007 vs Veh-treated control; #p < 0.05 vs Veh-treated cKO). All data are presented as mean values ±  SEM. All source data are provided as a source data file. Veh vehicle, CT control mice, cKO Gad2:Ndufs4cKO mice.
Fig. 5
Fig. 5. The PPARγ agonist leriglitazone mimics CBD’s beneficial effects in LS mouse models.
a Kaplan–Meier survival curve of Ndufs4KO mice exposed to regular (n = 8, gray) or leriglitazone-containing food (n = 9, blue, Log-rank test **p = 0.0048), and control mice (n = 20, black). b Kaplan–Meier survival curve of Gad2:Ndufs4cKO mice exposed to regular food (n = 10, gray) or leriglitazone-containing food (n = 12, blue, Log-rank test **p = 0.0045), and control mice (n = 20, black). c Clasping/twisting onset in Ndufs4KO mice exposed to regular (n = 11, gray) or leriglitazone-containing food (n = 12, blue, unpaired two-tailed t-test, **p = 0.0026). d Rotarod performance in Ndufs4KO exposed to regular (n = 11, gray) or leriglitazone-containing food (n = 12, blue, two-way ANOVA followed by Sidák’s multiple comparisons test, *p = 0.0313 treatment effect). Time to fall off is represented among the 3 tested days (PND 30, 40, and 50). Respiratory tidal volume (e), frequency (f), and total ventilation (g) of Ndufs4KO and control mice exposed to regular or leriglitazone-containing food (n = 14 [control groups], 10 [Ndufs4KO-regular], 11 [Ndufs4KO-leriglitazone], two-way ANOVA followed by Tukey’s multiple comparisons test, **p = 0.0018, ****p < 0.0001 [genotype effect]; #p < 0.05 [treatment effect]). Boxplots show the median (horizontal line), upper and bottom quartiles (box outlines) and the maximum and minimum non-outlier data points (whiskers). h Representative oxygen consumption rate (OCR) curves of purified mitochondria from the olfactory bulb of control (empty circles) and late-stage disease Ndufs4KO mice (filled circles) that were daily exposed to regular (gray) or leriglitazone-containing food (blue). OCR was normalized to the total protein amount. i OCR quantification from Fig. 5h, including: basal respiration, after adding ADP (state III), after adding the ATP synthase inhibitor oligomycin (proton leak), after adding the uncoupler FCCP (maximal), and after adding the cytochrome C inhibitor antimycin A (non-mito) (n = 7 [control-regular], 4 [Ndufs4KO-regular], 6 [leriglitazone groups], two-way ANOVA followed by Tukey’s multiple comparisons test, *p = 0.0299, **p = 0.0084, ****p < 0.0001 [genotype effect]). All data are presented as mean values ±  SEM. All source data are provided as a source data file. Veh vehicle, CT control mice, KO Ndufs4KO mice, cKO Gad2:Ndufs4cKO mice, VT Tidal volume, fR Respiratory frequency, VE Total ventilation, Reg Regular, Leri Leriglitazone.
Fig. 6
Fig. 6. PPARγ expression is decreased in LS mouse models as well as in patient-derived fibroblasts.
a qRT-PCR for Pparg mRNA expression normalized with Gapdh in the olfactory bulb from control and Ndufs4KO mice (n = 10 mice/group, unpaired two-tailed t-test, ****p < 0.0001). b qRT-PCR for Pparg mRNA expression normalized with Gapdh in the olfactory bulb from control (n = 8 mice/group) and Gad2:Ndufs4cKO mice (n = 8 mice/group, unpaired two-tailed t-test, *p = 0.0111). c Schematic representation of the RiboTag approach to isolate mRNAs from Gad2-positive cells. d qRT-PCR for Pparg mRNA expression normalized with Gapdh after HA-tagged-ribosome immunoprecipitation from Gad2-positive cells in the olfactory bulb from control (n = 6) and Gad2:Ndufs4cKO:RiboTag mice (n = 7, unpaired two-tailed t-test, **p = 0.0060). Luciferase activity assay in primary neuronal (e) and astrocytic (f) cultures from control and Ndufs4KO mice that were transfected with the reporter plasmid PPRE-Luc (n = 4 replicates/condition; unpaired two-tailed t-test, ***p = 0.0002). g qRT-PCR for PPARG mRNA expression normalized with GAPDH in control (n = 8 replicates/condition), NDUFS4-mutant (n = 3 replicates/condition) and COX15-mutant (n = 4 replicates/condition) from 3-independent cultures of patient-derived skin fibroblasts (relative expression with respect to the mean value of controls; one-way ANOVA followed by Dunnett’s multiple comparisons test, *p = 0.0343). h Western Blot analysis of PPARγ1/2, NDUFS4, COX5A, and GAPDH expression levels in control, NDUFS4- and COX15-mutant patient-derived skin fibroblasts (lower panel) and quantification of PPARγ1 normalized to GAPDH (upper panel) (n = 3 replicates/group, one-way ANOVA followed by Dunnett’s multiple comparisons test, ***p = 0.0010). All data are presented as mean values ± SEM. All source data are provided as a source data file. CT control mice, KO Ndufs4KO mice, cKO Gad2:Ndufs4cKO mice.
Fig. 7
Fig. 7. CBD ameliorates the phenotype of LS patients-derived fibroblasts via antioxidant effects.
a Cell proliferation measured as values of relative fluorescence units (RFU) for control and NDUFS4-mutant patient-derived fibroblasts. Values are represented as % of RFU respect to one of the two control fibroblast lines used in this study. Each value is the mean of each biological triplicate/experiment (n = 5 [control], 6 [NDUFS4], one-way ANOVA/Tukey’s multiple comparisons test, **p = 0.0012). b Cell proliferation measured as values of relative fluorescence units (RFU) for NDUFS4-mutant patient-derived fibroblasts treated with vehicle or CBD (5 µM) for 24 h. Each value is the mean of each biological triplicate/experiment (n = 6 independent experiments/condition, paired two-tailed t-test, *p = 0.0111). The average value of each group is represented in brown. Heatmap (c) and volcano plot (d) of the differentially expressed genes between LS patient-derived fibroblasts (both NDUFS4 and COX15 mutations) and two commercial control fibroblasts treated with vehicle for 24 h. Expression values are color coded according to the legend. The dendrogram depicts hierarchical clustering. e Volcano plot of differentially expressed genes between vehicle- and CBD-treated (5 µM) fibroblasts for 24 h. f Immunofluorescence of Mitotracker (cyan) and MitoSOX (magenta) probes, and nuclear cell staining (DAPI, blue) in NDUFS4-mutant fibroblasts. Note the colocalization of both probes. Scale bar: 20 μm. g Quantification of MitoSOX staining in COX15- and NDUFS4-mutant fibroblasts as well as in two control fibroblasts (CT1 and CT2) treated with vehicle or CBD (1 µM) for 24 h (n > 560 cells over three biological independent experiments, two-way ANOVA/Tukey’s multiple comparisons test, ****p < 0.0001 [genotype effect]; ##p < 0.01, ####p < 0.0001 [treatment effect]). h Quantification of total glutathione levels in COX15- and NDUFS4-mutant fibroblasts as well as in two control fibroblasts (CT1 and CT2) treated with vehicle or CBD (1 µM) for 24 h (n = 4 technical replicates for all groups, except CT1-vehicle with n = 5, over three biological independent experiments; two-way ANOVA/Tukey’s multiple comparisons test, #p = 0.0109, ####p < 0.0001 [treatment effect]). All data are presented as mean values ±  SEM. All source data are provided as a source data file. GSH Glutathione, Veh vehicle.

References

    1. Friedman, J. R. & Nunnari, J. Mitochondrial form and function. Nature505, 335–343 (2014). 10.1038/nature12985 - DOI - PMC - PubMed
    1. Vafai, S. B. & Mootha, V. K. Mitochondrial disorders as windows into an ancient organelle. Nature491, 374–383 (2012). 10.1038/nature11707 - DOI - PubMed
    1. Viscomi, C. & Zeviani, M. Experimental therapy for mitochondrial diseases. Handb. Clin. Neurol.194, 259–277 (2023). 10.1016/B978-0-12-821751-1.00013-0 - DOI - PubMed
    1. Arii, J. & Tanabe, Y. Leigh syndrome: serial MR imaging and clinical follow-up. AJNR Am. J. Neuroradiol.21, 1502–1509 (2000). - PMC - PubMed
    1. Finsterer, J. Leigh and Leigh-like syndrome in children and adults. Pediatr. Neurol.39, 223–235 (2008). 10.1016/j.pediatrneurol.2008.07.013 - DOI - PubMed

Publication types

MeSH terms

Associated data