. 2011 Apr 18:4:35.
doi: 10.1186/1755-8794-4-35.

Exon array analysis reveals neuroblastoma tumors have distinct alternative splicing patterns according to stage and MYCN amplification status

Affiliations

Exon array analysis reveals neuroblastoma tumors have distinct alternative splicing patterns according to stage and MYCN amplification status

Xiang Guo et al. BMC Med Genomics. .

Abstract

Background: Neuroblastoma (NB) tumors are well known for their pronounced clinical and molecular heterogeneity. The global gene expression and DNA copy number alterations have been shown to have profound differences in tumors of low or high stage and those with or without MYCN amplification. RNA splicing is an important regulatory mechanism of gene expression, and differential RNA splicing may be associated with the clinical behavior of a tumor.

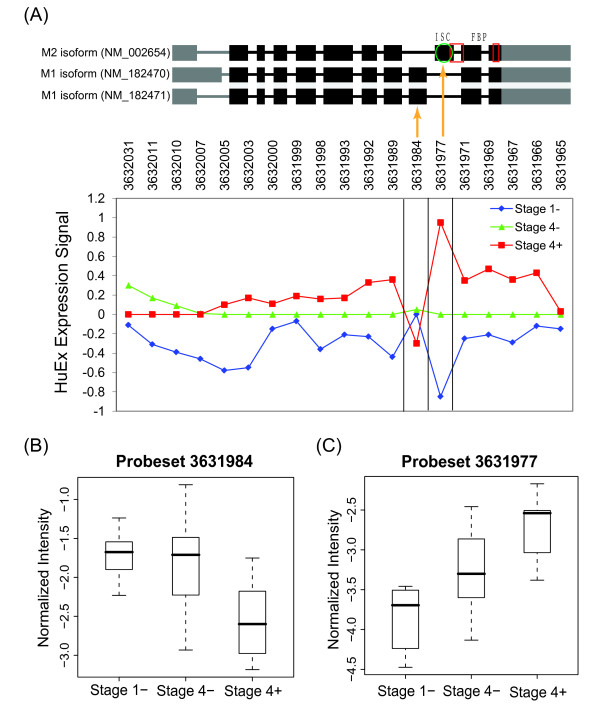
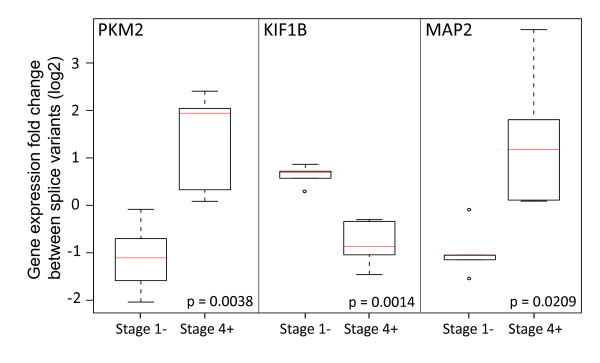
Methods: In this study, we used exon array profiling to investigate global alternative splicing pattern of 47 neuroblastoma samples in stage 1 and stage 4 with normal or amplified MYCN copy number (stage 1-, 4- and 4+). The ratio of exon-level expression to gene-level expression was used to detect alternative splicing events, while the gene-level expression was applied to characterize whole gene expression change.

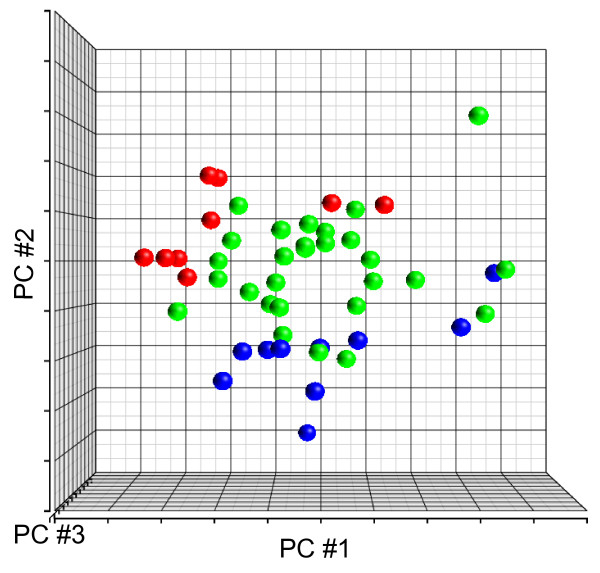
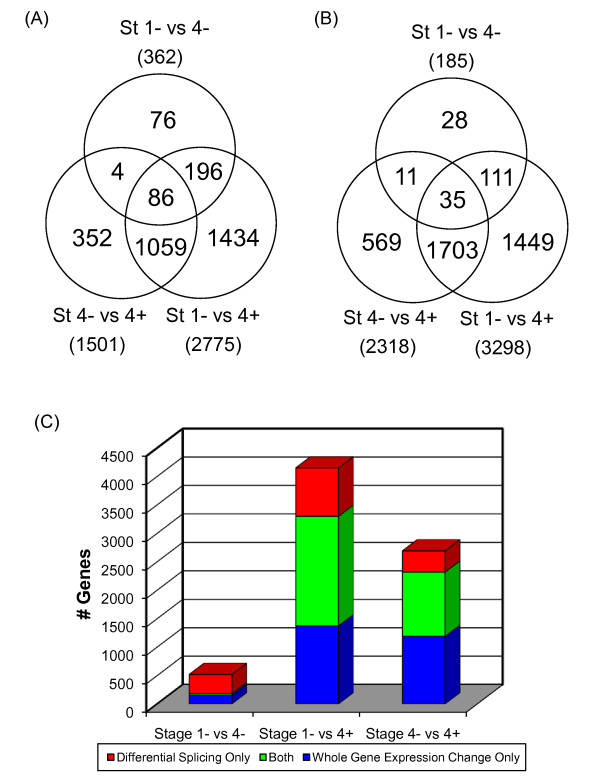
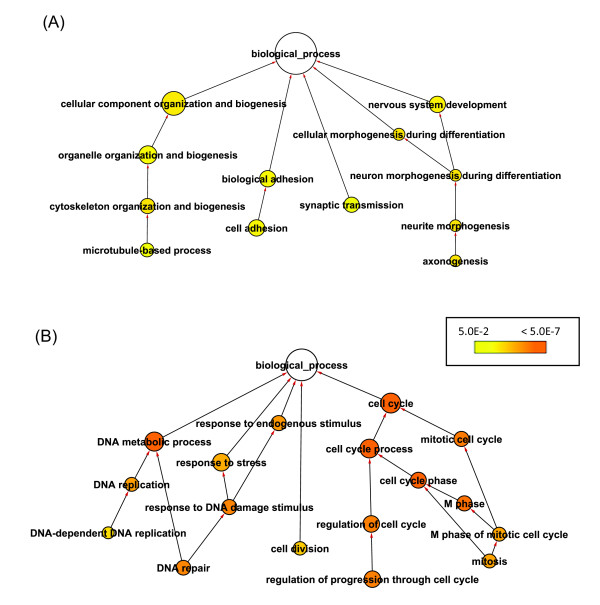
Results: Principal component analysis (PCA) demonstrated distinct splicing pattern in three groups of samples. Pairwise comparison identified genes with splicing changes and/or whole gene expression changes in high stage tumors. In stage 4- compared with stage 1- tumors, alternatively spliced candidate genes had little overlap with genes showing whole gene expression changes, and most of them were involved in different biological processes. In contrast, a larger number of genes exhibited either exon-level splicing, gene-level expression or both changes in stage 4+ versus stage 1- tumors. Those biological processes involved in stage 4- tumors were disrupted to a greater extent by both splicing and transcription regulations in stage 4+ tumors.

Conclusions: Our results demonstrated a significant role of alternative splicing in high stage neuroblastoma, and suggested a MYCN-associated splicing regulation pathway in stage 4+ tumors. The identification of differentially spliced genes and pathways in neuroblastoma tumors of different stages and molecular subtypes may be important to the understanding of cancer biology and the discovery of diagnostic markers or therapeutic targets in neuroblastoma.


Figures

Figure 1
Figure 1
Principal component analysis (PCA) of 47 neuroblastoma samples by log2-transformed normalized intensity of core probesets. PCA was performed using NI values of core probesets (n = 221,809) across all samples after quality filtering. Stage 1- and 4+ samples are clearly separated from each other, while stage 4- samples are located between them. Blue, stage 1-; green, stage 4-; red, stage 4+ tumors.
Figure 2
Figure 2
Comparison of exon level splicing change and gene level expression change. Pairwise comparison of stage 1-, 4-, and 4+ tumors was performed for both exon level splicing change and gene level expression change; the genes with FDR < 0.05 were identified. (A) Venn diagram of alternatively spliced candidate genes. (B) Venn diagram of differentially expressed candidate genes. (C) Comparison of exon level splicing change and gene level expression change. Blue column shows number of genes with whole gene expression change but not splicing change, while red column shows number of genes with splicing change but not whole gene expression change. Green column represents genes with both whole gene expression and splicing changes.
Figure 3
Figure 3
Alternative splicing of pyruvate kinase (PKM2) detected by Affymetrix exon (HuEx) array. (A) Gene structure of known isoforms is shown on the top panel with predicted domains/motifs that differ in protein isoforms. Green oval shows intersubunit contact (ISC) sequence, and red boxes point to fructose 1,6-bisphosphate (FBP) binding regions as defined by UniProt. The HuEx expression is shown on the bottom panel. Each point represents mean log2-expression of each group that was then median-centered across three groups. Orange lines point to probeset 3631984 that mapped to the unique exon in isoform M1 (NM_182470 and NM_182471), and probeset 3631977 that mapped to the unique exon in isoform M2 (NM_002654). While isoform M2-specific probeset showed increased expression in stage 4+ compared to stage 4-/1- tumors, isoform M1-specific probeset indicated lower expression in stage 4+ tumor. (B) Normalized intensity (NI) values for probeset 3631984 in Stage 1-, 4- and 4+ tumors. (C) Normalized intensity values for probeset 3631977 in Stage 1-, 4- and 4+ tumors. The expression for probesets 3631984 and 3631977was significantly different between stage 1- and 4+, suggesting the increased expression of isoform M2 and reduced expression of isoform M1 in MYCN-amplified neuroblastoma.
Figure 4
Figure 4
Enriched Gene Ontology (GO) biological processes in alternatively spliced (A) or differentially expressed (B) genes in stage 4- vs 1- neuroblastomas. GO enrichment analysis was done by DAVID [22], and overrepresented biological processes were shown as a GO graph in which child terms are connected to their parent terms by directed lines. Color scale denotes Benjamini-corrected p-values generated by a hypergeometric test, and node size is proportional to the number of genes annotated to corresponding GO terms.
Figure 5
Figure 5
qRT-PCR validation on splice variants differentialy expressed in stage 1- and stage 4+ tumors. Quantitative RT-PCR was performed for three spliced genes including PKM2 (NM_002654 vs. NM_182470 & NM_182471), KIF1B (NM_015074 vs. NM_183416) and MAP2 (NM_001039538 vs. NM_002374) in 5 stage 1- and 5 stage 4+ tumors. Differential expression of splice variants was evaluated by calculating expression fold changes between splice variants of the spliced gene in each sample, which were further centered by median of values obtained in stage 1- and stage 4+ tumors. The expression of splice variants is significantly different between stage 1- and stage 4+ tumors for all three tested spliced genes.

References

    1. Wang ET, Sandberg R, Luo S, Khrebtukova I, Zhang L, Mayr C, Kingsmore SF, Schroth GP, Burge CB. Alternative isoform regulation in human tissue transcriptomes. Nature. 2008;456(7221):470–476. doi: 10.1038/nature07509. - DOI - PMC - PubMed
    1. Wang GS, Cooper TA. Splicing in disease: disruption of the splicing code and the decoding machinery. Nat Rev Genet. 2007;8(10):749–761. doi: 10.1038/nrg2164. - DOI - PubMed
    1. Thorsen K, Sorensen KD, Brems-Eskildsen AS, Modin C, Gaustadnes M, Hein AM, Kruhoffer M, Laurberg S, Borre M, Wang K, Brunak S, Krainer AR, Tørring N, Dyrskjøt L, Andersen CL, Orntoft TF. Alternative splicing in colon, bladder, and prostate cancer identified by exon-array analysis. Mol Cell Proteomics. 2008. - PubMed
    1. Cheung HC, Baggerly KA, Tsavachidis S, Bachinski LL, Neubauer VL, Nixon TJ, Aldape KD, Cote GJ, Krahe R. Global analysis of aberrant pre-mRNA splicing in glioblastoma using exon expression arrays. BMC Genomics. 2008;9(1):216. doi: 10.1186/1471-2164-9-216. - DOI - PMC - PubMed
    1. Zhang C, Li HR, Fan JB, Wang-Rodriguez J, Downs T, Fu XD, Zhang MQ. Profiling alternatively spliced mRNA isoforms for prostate cancer classification. BMC Bioinformatics. 2006;7:202. doi: 10.1186/1471-2105-7-202. - DOI - PMC - PubMed

Publication types

MeSH terms

Associated data