. 2011 May 9:11:78.
doi: 10.1186/1471-2229-11-78.

Analysis of anther transcriptomes to identify genes contributing to meiosis and male gametophyte development in rice

Affiliations

Analysis of anther transcriptomes to identify genes contributing to meiosis and male gametophyte development in rice

Priyanka Deveshwar et al. BMC Plant Biol. .

Abstract

Background: In flowering plants, the anther is the site of male gametophyte development. Two major events in the development of the male germline are meiosis and the asymmetric division in the male gametophyte that gives rise to the vegetative and generative cells, and the following mitotic division in the generative cell that produces two sperm cells. Anther transcriptomes have been analyzed in many plant species at progressive stages of development by using microarray and sequence-by synthesis-technologies to identify genes that regulate anther development. Here we report a comprehensive analysis of rice anther transcriptomes at four distinct stages, focusing on identifying regulatory components that contribute to male meiosis and germline development. Further, these transcriptomes have been compared with the transcriptomes of 10 stages of rice vegetative and seed development to identify genes that express specifically during anther development.

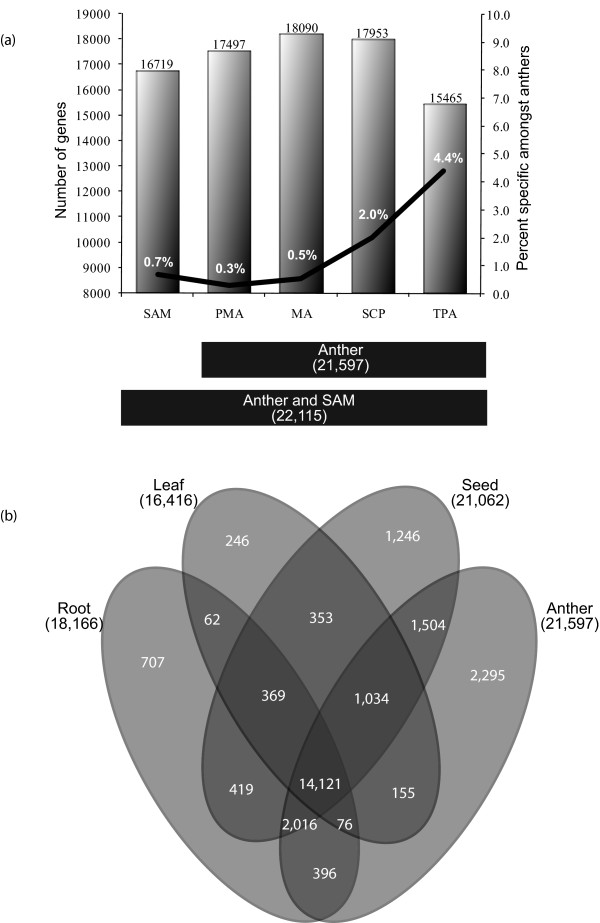
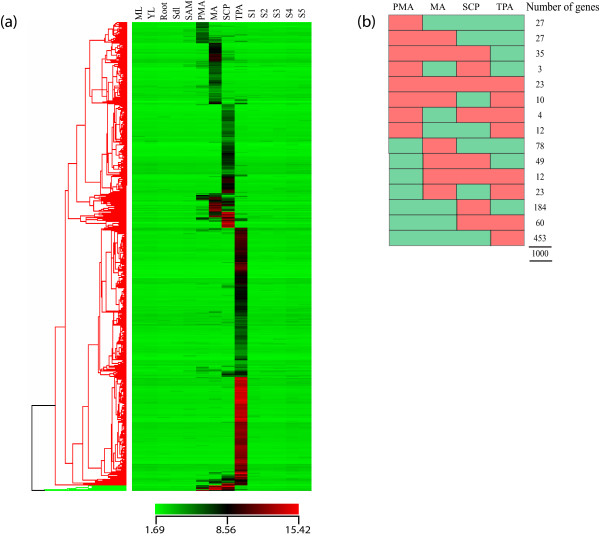
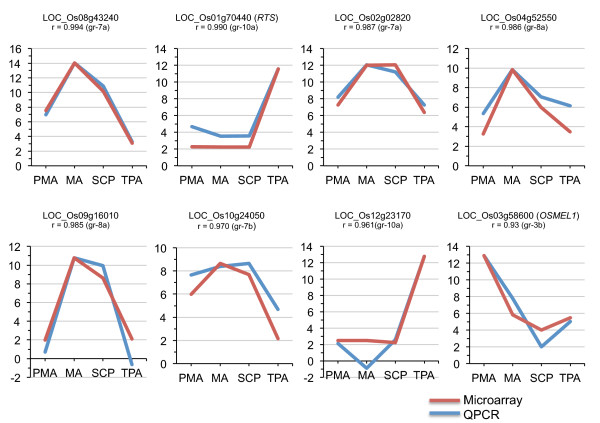
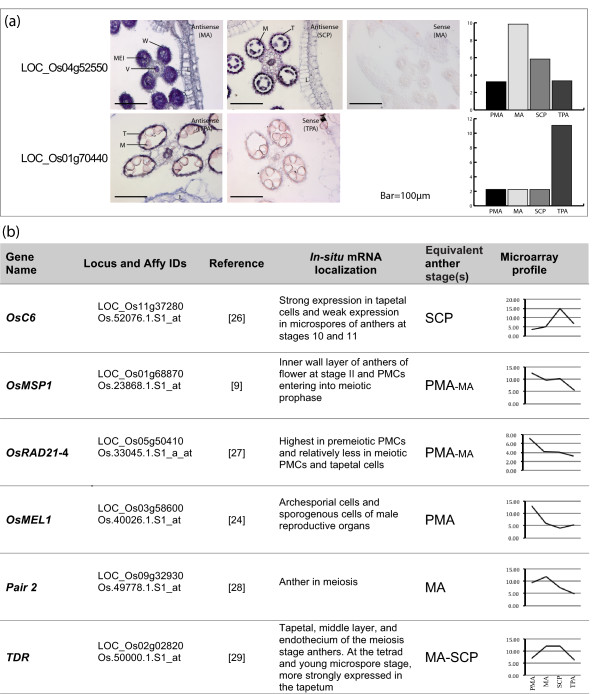
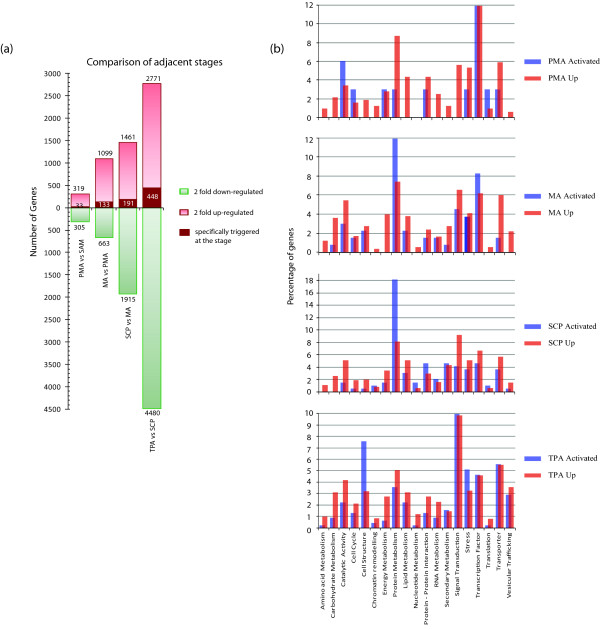
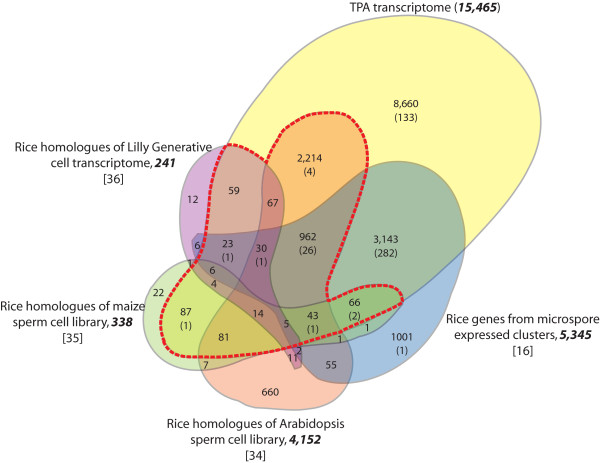
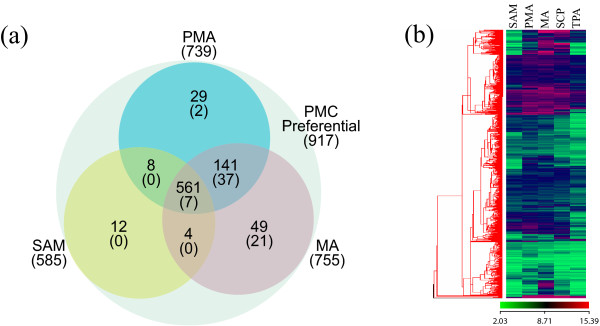
Results: Transcriptome profiling of four stages of anther development in rice including pre-meiotic (PMA), meiotic (MA), anthers at single-celled (SCP) and tri-nucleate pollen (TPA) revealed about 22,000 genes expressing in at least one of the anther developmental stages, with the highest number in MA (18,090) and the lowest (15,465) in TPA. Comparison of these transcriptome profiles to an in-house generated microarray-based transcriptomics database comprising of 10 stages/tissues of vegetative as well as reproductive development in rice resulted in the identification of 1,000 genes specifically expressed in anther stages. From this sub-set, 453 genes were specific to TPA, while 78 and 184 genes were expressed specifically in MA and SCP, respectively. The expression pattern of selected genes has been validated using real time PCR and in situ hybridizations. Gene ontology and pathway analysis of stage-specific genes revealed that those encoding transcription factors and components of protein folding, sorting and degradation pathway genes dominated in MA, whereas in TPA, those coding for cell structure and signal transduction components were in abundance. Interestingly, about 50% of the genes with anther-specific expression have not been annotated so far.

Conclusions: Not only have we provided the transcriptome constituents of four landmark stages of anther development in rice but we have also identified genes that express exclusively in these stages. It is likely that many of these candidates may therefore contribute to specific aspects of anther and/or male gametophyte development in rice. In addition, the gene sets that have been produced will assist the plant reproductive community in building a deeper understanding of underlying regulatory networks and in selecting gene candidates for functional validation.


Figures

Figure 1
Figure 1
Transcriptome profile of anther development. (a) Anther development transcript sizes overlaid with a line graph depicting the percentage of specifically expressed genes in individual stages. The figure highlights that the meiotic anthers have the largest transcriptome, whereas, anthers at the tri-nucleate stage of pollen development show a comparatively smaller transcriptome, but with the largest proportion of specific genes. (b) Venn diagrams showing the constitution of vegetative tissues (leaf and root), seed and anther transcriptomes with component overlaps amongst them.
Figure 2
Figure 2
Gene expression patterns of differentially expressed genes in SAM and the four stages of anther development (PMA, MA, SCP, TPA) categorized into 20 groups using the K-means clustering tool. Groups with similar expression patterns but different expression amplitudes have been grouped together to make 10 clusters. The normalized log transformed signal values were plotted for each of the five stages. The number of genes in the clusters is indicated along the side of the heatmap. The percentage of anther-specific genes in each cluster is specified at the lower left side of the heatmap.
Figure 3
Figure 3
Expression profiles of specifically expressed genes in anthers. (a) Hierarchical cluster diagram representing expression patterns of 1000 genes that show transcript accumulation in at least one of the four stages of anther development and undetectable expression in any of the vegetative (ML, mature leaf; YL, Y-leaf; Root; SDL, 7-day-old seedling) or seed development stages (S1-S5; encompassing 0-30 days of seed development after pollination). (b) A diagrammatic representation of the anther-specific expression profiles with the number of genes under each expression profile.
Figure 4
Figure 4
Q-PCR analysis of eight genes showing anther developmental stage-specific expression and its correlation with microarray data. Three biological replicates were taken for both Q-PCR and microarray analysis. The Y axis represents normalized log2 transformed expression values obtained using microarray analysis and log2 transformed relative transcript amount obtained by Q-PCR. The Q-PCR data has been scaled such that the maximum expression value of Q-PCR equals that of the maximum value of the microarray to ease profile matching. Gene locus IDs and their affiliation to the co-expression groups shown in Figure 3 are mentioned. The correlation co-efficient (r) between the two expression profiles is also indicated. Expression of 18S rRNA was used as an internal control to normalize the Q-PCR data. PMA; pre-meiotic anthers, MA; meiotic anthers, SCP; anthers with single-celled pollen, TPA; tri-nucleate pollen containing anthers.
Figure 5
Figure 5
Validation of microarray data by in-situ hybridization. (a) In-situ localization of transcripts corresponding to the genes LOC_Os04g52550 and LOC_Os01g70440 in rice florets (MA, SCP and TPA stages as marked). Corresponding microarray-based expression profiles of these two genes are also shown as bar graphs for comparison. W, wall layers; V, vascular tissue; T, tapetum; M, microspores; MEI, meiocytes; L, lemma. (b) A compilation of in-situ localization analyses for six genes using published literature and their correlation with anther preferential expression profiles as revealed by the microarray analysis described in this paper. The log2 normalized expression values were used to represent the gene specific microarray profiles.
Figure 6
Figure 6
Analysis of gene activation during anther development. The transcriptomes of all four anther stages were compared to their preceding stage of development. SAM has been used as the reference for PMA. (a) The number of genes up- or down-regulated ≥ 2-fold at p-value ≤ 0.005 are plotted on the graph. Amongst the up-regulated genes, the numbers that have no detectable expression (GC-RMA value ≤ 10) in any of their previous anther stages as well as non-anther stages have been annotated in maroon boxes in the individual columns as specifically 'triggered'. While such candidates may have expression in later anther stages, expression first appears in that particular anther stage. (b) A bar graph highlighting the distribution of the up-regulated and specifically-triggered genes at individual stages of development into functional categories based on GO annotations.
Figure 7
Figure 7
Expression profiles of putative homologues of known meiosis related genes in yeast and/or Arabidopsis that were identified by sequence similarity searches (see reference [20]) during various developmental stages in rice. Gene names as taken from the respective sources are shown on the left, while locus IDs of putative homologues in rice are given on the right side of each expression profile. The lowermost panel shows the expression profiles of genes whose functional association in rice has been validated.
Figure 8
Figure 8
Identification of putative male gamete transcripts in rice. The Venn diagram shows overlap between genes that were identified as being present in TPA with microspore preferential genes [16], and homologues found by sequence similarity in the Arabidopsis sperm cell transcriptome [34], maize sperm cell ESTs [35] and the lily generative cell transcriptome [36]. The number of genes from the respective transcriptomes that could be mapped on the Rice Genome Array are bold and in italics, while the number of genes that are specifically expressed in the rice TPA transcriptome are indicated in parentheses. The red dashed line constitutes the total number of rice homologues (excluding those in parentheses) that contribute to the putative sperm cell transcriptome in rice which have been identified from the other systems examined.
Figure 9
Figure 9
Comparison of the pollen mother cell transcriptome with anther stages. (a) Venn diagram showing the expression of pollen mother cell (PMC) preferential genes identified by Tang and co-workers [45] in PMA, MA and SAM. The number of probe-sets expressed in each stage is indicated, with the number of genes specifically expressed in anthers indicated in parentheses. (b) A heat-map representing the expression profiles of 702 PMC preferential genes (from the original 917 identified in comparing the 44K and 57K chip - see reference [45]and the discussion) that are expressed in SAM and the four stages of anther development (PMA, MA, SCP and TPA).

References

    1. Goldberg RB, Beals TP, Sanders PM. Anther development: basic principles and practical applications. Plant Cell. 1993;5:1217–1229. - PMC - PubMed
    1. Yang SL, Xie LF, Mao HZ, Puah CS, Yang WC, Jiang L, Sundaresan V, Ye D. Tapetum determinant1 is required for cell specialization in the Arabidopsis anther. Plant Cell. 2003;15:2792–2804. doi: 10.1105/tpc.016618. - DOI - PMC - PubMed
    1. Ma H. Molecular genetic analyses of microsporogenesis and microgametogenesis in flowering plants. Annu Rev Plant Biol. 2005;56:393–434. doi: 10.1146/annurev.arplant.55.031903.141717. - DOI - PubMed
    1. Yu-Jin Sun CLH, Chen Chang-Bin, Hong Ma. Regulation of Arabidopsis early anther development by putative cell-cell signalling molecules and transcriptionl regulators. Journal of Integrative Plant Biology. 2007;49:60–68. doi: 10.1111/j.1744-7909.2006.00408.x. - DOI
    1. Borg M, Brownfield L, Twell D. Male gametophyte development: a molecular perspective. J Exp Bot. 2009;60:1465–1478. doi: 10.1093/jxb/ern355. - DOI - PubMed

Publication types

Associated data