. 2024 Dec;300(12):107933.
doi: 10.1016/j.jbc.2024.107933. Epub 2024 Oct 28.

Epididymis-specific RNase A family genes regulate fertility and small RNA processing

Affiliations

Epididymis-specific RNase A family genes regulate fertility and small RNA processing

Joshua F Shaffer et al. J Biol Chem. 2024 Dec.

Abstract

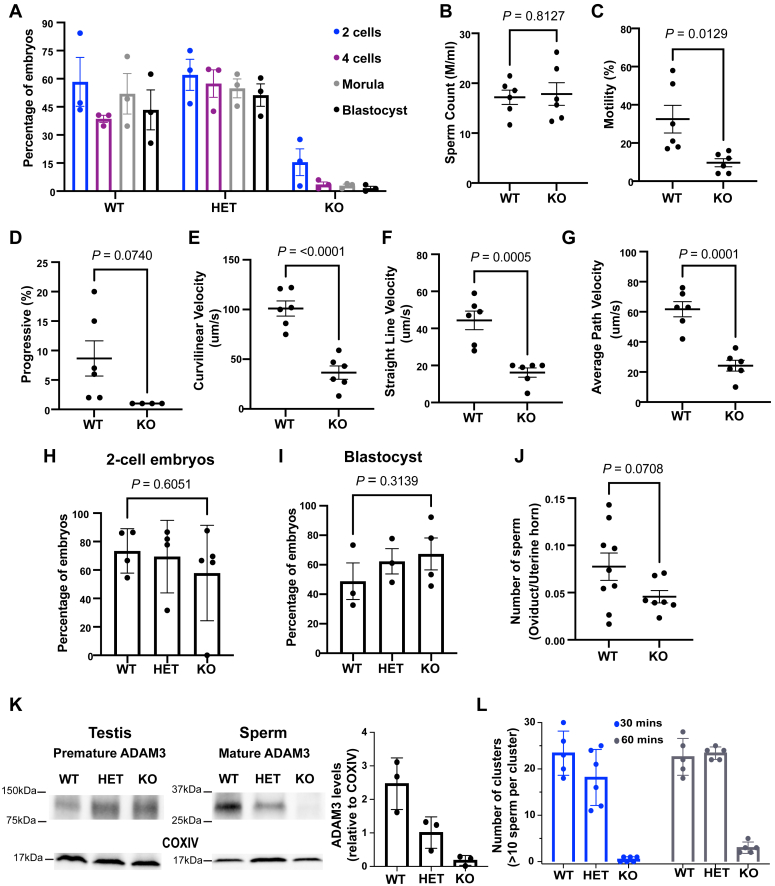
Sperm small RNAs are implicated in intergenerational transmission of paternal environmental effects. Small RNAs generated by the cleavage of tRNAs, known as tRNA fragments (tRFs) or tRNA-derived RNAs (tDRs or tsRNAs), are an abundant class of RNAs in mature sperm and can be modulated by environmental conditions. The biogenesis of tRFs in the male reproductive tract remains poorly understood. Angiogenin, a member of the ribonuclease A superfamily (RNase A), cleaves tRNAs to generate tRFs in response to cellular stress. Four paralogs of Angiogenin, namely Rnase9, Rnase10, Rnase11, and Rnase12, are specifically expressed in the epididymis-a long, convoluted tubule where sperm mature and acquire fertility and motility. Here, by generating mice deleted for all four genes (Rnase9-12-/-, termed "KO" for Knock Out), we report that these genes regulate fertility and small RNA levels. KO male mice are sterile; KO sperm fertilized oocytes in vitro but failed to efficiently fertilize oocytes in vivo due to an inability of sperm to pass through the utero-tubular junction. Intriguingly, there were decreased levels of tRFs and rRNAs (rRNA-derived small RNAs or rsRNAs) in the KO epididymis and epididymal luminal fluid, although RNases 9-12 did not show ribonucleolytic activity in vitro. Importantly, KO sperm showed a dramatic decrease in the levels of tRFs, demonstrating a role of epididymis-specific Rnase9-12 genes in regulating sperm small RNA composition. Together, our results reveal an unexpected role of four epididymis-specific noncanonical ribonuclease A family genes in regulating fertility and small RNA processing.

Keywords: epididymis; fertility; reproduction; ribonucleases; small RNAs; sperm.


Conflict of interest statement

Conflicts of interests The authors declare that they have no conflicts of interests with the contents of this article.

Figures

Figure 1
Figure 1
Generation of mice with deletion of a genomic locus harboring four reproductive tract–specific RNase A family genes. Normalized read counts of Rnase10 (A), Rnase9 (B), Rnase11 (C), and Rnase12 (D) from mRNA-seq performed on the caput, corpus, and cauda epididymis tissues of WT, heterozygous deletion (HET), and homozygous deletion (KO) males. Normalized read counts were obtained using DESeq2 analysis, and bar graphs represent read counts from three biological replicates.
Figure 2
Figure 2
Loss of male fertility in Rnase9-12 KO mice.A, number of pups obtained per litter from a mating between WT females and males that were either WT, HET, or KO. Each data point represents an independent litter resulting from the following breeding pairs: 3 (WT male X WT female), 5 (HET male X WT female), and 8 (KO male X WT female). B-C, frequency of litters born days after the start of the breeding cages of females (B) or males (C) of WT, HET, and KO genotypes with WT animals of the opposite sex. D, number of pups obtained per litter from a mating between WT females and WT males, males heterozygous for a deletion of the Rnase10 gene (Rnase10 −/+), or males homozygous for a deletion of the Rnase10 gene (Rnase10−/−). ns (not significant).
Figure 3
Figure 3
Rnase9-12 KO sperm are incapable of fertilizing oocytes in vivo.A, percentage of embryos at specific preimplantation developmental stages. WT females were mated with WT, HET, or KO males overnight, and oocytes were collected from females that showed copulatory plugs the next day. The fertilized oocytes were allowed to develop in vitro to the blastocyst stage, and embryos at each stage were quantified as the percent of oocytes that reached the specific developmental stage. The experiment was performed with three males per genotype and 7–9 total females per genotype. BF, computer-assisted sperm-analysis (CASA) of WT and KO sperm including total sperm counts (B), percentage of motile sperm (C), % progressive sperm (D), curvilinear velocity (E), straight-line velocity (F), and average path velocity (G). The p-values were calculated using unpaired t test. HI, oocytes from WT females were in vitro fertilized using sperm from WT, HET, or KO males. The plots show the percentage of oocytes that developed to the 2-cell embryo stage (H) and the percentage of 2-cell embryos that reached the blastocyst stage (I). J, number of sperm in the oviduct as a fraction of total sperm in the uterine horns. Females were housed with WT or KO males, and 1 h after a copulatory plug was observed, oviducts and uterine horns were dissected to count the number of sperm. A few females that were housed with KO males did not show a copulatory plug and no sperm were detected in their uterine horns. Those females were not included in further analysis. K, Western blot analysis of mature ADAM3 protein levels in WT, HET, and KO sperm. A premature form of ADAM3 was detected in the testis (∼100 kDa), and mature ADAM3 was detected in cauda sperm (∼30 kDa). COXIV was used as a loading control. The bar graph represents the quantification of ADAM3 levels relative to COXIV in sperm from three independent biological replicates. L, bar graph depicting the number of sperm clusters observed in the three genotypes. Sperm aggregates (10 or more sperm per cluster) in each microscopic field were calculated in three independent biological replicates. Representative microscopic images are included in Fig. S2.
Figure 4
Figure 4
Transcriptomic and proteomic alterations in Rnase9-12 KO epididymides.A, volcano plot showing mRNA-seq results from DESeq2 analysis of significantly differentially expressed transcripts in the KO cauda epididymis relative to the WT (n = 3 biological replicates). As Rnase9-12 genes showed the highest and most significant changes in mRNA abundance, those four genes were removed from this plot to make other changes discernable. Volcano plots with all genes in all three regions of the epididymis are included in Fig. S3. B, gene ontology Reactome Pathway enrichment analysis of significantly downregulated genes in cauda epididymis tissue. C, cytokine and chemokine levels in the cauda epididymal fluid of WT and KO mice.
Figure 5
Figure 5
Small RNA abundance changes in the Rnase9-12 KO epididymis.A, percentage of reads of different subtypes of tRFs and rsRNAs in the cauda epididymis tissues of WT and KO mice (n = 3 biological replicates). The box plots show percentage of all mapped reads (including reads that do not map to any annotated features). The proportion of reads from all annotated RNA types is included in Fig. S4A, which shows percentage of reads excluding unannotated reads (accounting for 12–20% percent of mapped reads in different samples). B, volcano plot showing differentially expressed small RNAs in the KO cauda epididymis relative to the WT cauda epididymis. tRFs are labeled red, tRNAs are green, rsRNAs are blue, and all other RNAs are black. The dashed lines show the cut-off used for calling significantly differentially expressed transcripts. The number of significantly differentially expressed transcripts (Log2Fold change >1 and padj value < 0.05) as determined by DESeq2 analysis are shown in the right panel. C, MA plot showing log2-fold change versus normalized mean counts, with significantly differentially expressed RNAs in black and nonsignificant RNAs in gray (significance cut-off is Log2 fold change of one or more and padj value < 0.05). D, histograms showing tRF (tRF_5′, tRF_3′, and tRF_other) and rsRNA abundance changes in KO cauda epididymis relative to the WT. The X-axis shows the log2 fold change of the median of normalized reads, and the Y-axis shows the total count of tRFs or rsRNAs. E, percentage of tRF and all other small RNA reads longer than 40 nts (>40 nts) or less than 40 nts (<40 nts). Notably, the KO cauda epididymis showed a higher abundance of >40 nts reads. F, Northern blot analysis of fragments derived from tRNA-ValCAC and 5S rRNA. Arrows indicate the fragments that were quantified. For 5S rsRNAs, three different fragments were detected with one of those showing a dramatic decrease in the KO tissues. Shown here is a representative RNA blot sequentially probed in the following order: U6 > tRFValCAC > 5S rsRNA. It should be noted that the same U6 RNA blot image is shown below tRFValCAC and 5S rRNA blots as the same U6 control is used for quantification of these two RNAs. The leftmost gel image is the image of the RNA ladder imaged under a trans-white light setting for the estimation of the molecular weight of the RNA bands. Bar graph shows quantification of tRF-ValCAC and 5S rsRNA levels relative to U6. G, heatmap showing log2 mean of normalized read counts of top 40 tRFs significantly differentially expressed between KO and WT cauda epididymides.
Figure 6
Figure 6
Reduced levels of tRFs in the epididymal luminal fluid of Rnase9-12 KO mice.A, percentage of reads of different RNA classes sequenced from the epididymal fluid (n = 3 biological replicates). tRFs are fragments mapping to tRNA genes and are further classified for downstream analysis as a 5′, 3′, or “other” fragment based on the read alignment with respect to the ends of the respective tRNA. rsRNA subunits are reads mapping to the specific rRNA subunit and the repeats of that subunit (see Experimental Procedures). ∼7 to 12% of reads did not map to any annotated gene features (“Other” reads) and were removed before generating this plot. The epididymal fluid had a high abundance of reads mapping to tRFs (>85%). B, volcano plot showing differentially expressed small RNAs in KO corpus epididymal fluid relative to WT. tRFs are labeled red, tRNAs are green, rsRNAs are blue, and all other RNAs are black. The dashed lines show the cut-off used for calling significantly differentially expressed transcripts. The number of significantly differentially expressed transcripts (Log2Fold change >1 and padj value < 0.05) as determined by DESeq2 analysis are shown in the right panel. C, MA plot showing log2-fold change versus normalized mean counts in corpus epididymal fluid samples, with significantly differentially expressed RNAs in black and nonsignificant RNAs in gray (significance cut-off is Log2 fold change of one or more and padj value < 0.05). D, the heatmap shows the abundance (Log2 mean of normalized read counts) of tRFs in the epididymal fluid across all segments of the epididymis. Top 40 differentially expressed tRFs in the KO corpus epididymal fluid relative to the WT are shown. Notably, most of these tRFs are also downregulated in the KO caput epididymal fluid relative to the WT. E, percentage of tRF and all other small RNA reads longer than 40 nts (>40 nts) or less than 40 nts (<40 nts). F, RNase activity measurement in the epididymal fluid collected from WT and KO mice (n = 2). Purified RNase A and water were used as positive and negative controls. The bar graph represents mean ± SD. G, RNase activity assay using recombinant RNases 9–12. RNA fraction containing tRNAs and 5S rRNAs was isolated from epididymides by size fractionation on a polyacrylamide gel and used for RNase activity assay. Recombinant Angiogenin was used as a positive control.
Figure 7
Figure 7
Changes in small RNA abundance in sperm fromRnase9-12KO mice.A, read percentage of different classes of small RNAs sequenced from the sperm of WT and KO mice. Approximately 50% of reads did not map to any annotated gene features (“Other” reads) and were removed before generating this plot (n = 4 biological replicates per genotype). B, the volcano plot shows differentially expressed small RNAs in the KO sperm relative to WT. tRFs are labeled red, tRNAs are green, rsRNAs are blue, and all other RNAs are black. The dashed lines show the cut-off used for calling significantly differentially expressed transcripts. The number of significantly differentially expressed transcripts (Log2Fold change >1 and padj value < 0.05) as determined by DESeq2 analysis are shown in the right panel. C, MA plot showing log2-fold change versus normalized mean counts of sperm samples, with significantly differentially expressed RNAs in black and nonsignificant RNAs in gray (significance cut-off is Log2 fold change of one or more and padj value < 0.05). D, percentage of tRF and all other small RNA reads longer than 40 nts (>40 nts) or less than 40 nts (<40 nts). E, tRF (tRF_5′, tRF_3′, and tRF_other) and miRNA abundance change in the KO sperm relative to WT sperm. The X-axis is the log2 fold change of the median of normalized reads, and the Y-axis shows the total number of tRFs or miRNAs. F, Venn diagrams showing the number of shared statistically significant (padj value < 0.05) small RNA changes in sperm and cauda epididymis tissues and between sperm and cauda epididymal fluid. The top shared tRFs are listed below the Venn diagrams. G, the heatmap shows the log2 mean of normalized read counts of top 40 tRFs, which is significantly differentially abundant tRFs between KO and WT sperm.

Update of

References

    1. Orgebin-Crist M.C. Sperm maturation in rabbit epididymis. Nature. 1967;216:816–818. - PubMed
    1. Bjorkgren I., Sipila P. The impact of epididymal proteins on sperm function. Reproduction. 2019;158:R155–R167. - PubMed
    1. Breton S., Ruan Y.C., Park Y.J., Kim B. Regulation of epithelial function, differentiation, and remodeling in the epididymis. Asian J. Androl. 2016;18:3–9. - PMC - PubMed
    1. Cornwall G.A. New insights into epididymal biology and function. Hum. Reprod. Update. 2009;15:213–227. - PMC - PubMed
    1. Gervasi M.G., Visconti P.E. Molecular changes and signaling events occurring in spermatozoa during epididymal maturation. Andrology. 2017;5:204–218. - PMC - PubMed

Publication types

Associated data