. 2024 Nov 18;15(1):9988.
doi: 10.1038/s41467-024-54420-w.

IL-12 drives the expression of the inhibitory receptor NKG2A on human tumor-reactive CD8 T cells

Affiliations

IL-12 drives the expression of the inhibitory receptor NKG2A on human tumor-reactive CD8 T cells

Olivier Fesneau et al. Nat Commun. .

Abstract

Blockade of NKG2A/HLA-E interaction is a promising strategy to unleash the anti-tumor response. Yet the role of NKG2A+ CD8 T cells in the anti-tumor response and the regulation of NKG2A expression on human tumor-infiltrating T cells are still poorly understood. Here, by performing CITE-seq on T cells derived from head and neck squamous cell carcinoma and colorectal cancer, we show that NKG2A expression is induced on CD8 T cells differentiating into cytotoxic, CD39+CD103+ double positive (DP) cells, a phenotype associated with tumor-reactive T cells. This developmental trajectory leads to TCR repertoire overlap between the NKG2A- and NKG2A+ DP CD8 T cells, suggesting shared antigen specificities. Mechanistically, IL-12 is essential for the expression of NKG2A on CD8 T cells in a CD40/CD40L- dependent manner, in conjunction with TCR stimulation. Our study thus reveals that NKG2A is induced by IL-12 on human tumor-reactive CD8 T cells exposed to a TGF-β-rich environment, highlighting an underappreciated immuno-regulatory feedback loop dependent on IL-12 stimulation.


Conflict of interest statement

Competing interests The authors declare not competing interests.

Figures

Fig. 1
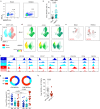
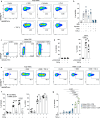
Fig. 1. NKG2A+ cells are enriched in CD103+ CD39+ (DP) CD8 T cells in HNSCC tumors.
a Flow cytometry analysis and (b) summary of NKG2A expression by CD8 T cells from the blood and the tumor of HNSCC patients (n = 25). c Unsupervised clustering of blood (red) and tumor-infiltrating (cyan) CD3+ CD8+ T cells isolated from 13 HNSCC patients. d Normalized expression of CD103, CD39 and NKG2A on CD8 T cells from blood and tumor. e NKG2A expression on blood and tumor CD8 T cells (positive cells are shown as red dots), with B1 and B2 representing subsets of NKG2A+ cells in the blood, and T1, T2 and T3 representing subsets of NKG2A+ cells in the tumor. f Phenotype of the different subsets of NKG2A+ CD8 T cells (n = 13). g Frequency of DN (CD39 CD103 ), SP (CD39 CD103+ ) and DP (CD39+ CD103+ ) cells among NKG2A (left) and NKG2A+ (right) CD8 TILs in HNSCC patients (n = 25). h Summary of the expression of NKG2A by DP CD8 TILs in HPV (n = 23) and HPV+ (n = 18) HNSCC patients. Horizontal lines indicate the mean ± SEM. NS= not significant; p-values were determined by paired 2-tailed t test (b), by one-way analysis of variance with Tukey’s post hoc testing (g), or unpaired 2-tailed t test (h).
Fig. 2
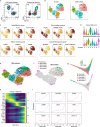
Fig. 2. CD8 TILs are heterogenous and contain a subset of cytotoxic cells expressing NKG2A.
a Gating strategy of CD8 T cells (left) and CD8 T cell subsets (right) using CITE-seq antibodies. b Unsupervised clustering of CD8 T cells from TILs (left) and projection of the 3 CD8 subsets identified in (b) onto the UMAP plot (right) (n = 6 HNSCC patients). c Normalized expression of selected markers defining tumor CD8 T cell clusters. d Naïve/TCM and Activation/exhaustion scores for each cell cluster. e RNA velocity of CD8 T cells projected on the UMAP plot. Arrows indicate the putative differentiation direction. Arrow sizes indicate the magnitude of predicted directionality. f Highlight of the cells most confidently assigned to each initial and terminal state on the UMAP. g Diffusion map of cells colored by CD8 subsets and microstates. h Gene expression dynamics of differentially expressed genes ordered along the latent time inferred by RNA velocity for the lineage 7. i Smoothed gene expression trends in pseudotime for the lineage 7.
Fig. 3
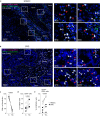
Fig. 3. NKG2A+ CD39+ CD8 are enriched in the tumor intraepithelial compartment.
ISH/IF for NKG2A (RNA, magenta), CD39 (RNA, green) and CD8 (protein, white) on an HNSCC tumor (a) and a CRC tumor (b). Representative low-power image together with high-power views of four selected areas are shown. CD8+ CD39+ NKG2A+ cells are highlighted with red arrows, and CD8+ CD39+ NKG2A cells are highlighted with white arrows. c Summary of the distribution of CD8+ cells in the stroma (S) and tumor intraepithelial compartment (TIC). d Percentages of CD39+ cells among CD8+ cells in the stroma (S) and tumor intraepithelial compartment (TIC). e Percentages of NKG2A+ cells among CD39+ CD8+ cells in the stroma (S) and tumor intraepithelial compartment (TIC). The analysis was performed on 3 HNSCC tumors and 3 CRC tumors. Scale bar= 100 μm for low-power images and 20 μm for high-power views. p-values were determined by paired 2-tailed t test (c, d and e).
Fig. 4
Fig. 4. The TCR repertoire of NKG2A+ DP CD8 overlaps with NKG2A DP CD8 T cells.
a Circos plot of unique productive TCRβ nucleotide sequence for each of the indicated cell populations. Connections highlight sequences from NKG2A+ DP CD8 found in the other CD8 T cell populations. The number of shared sequences is indicated. b Similarities between the TCR repertoires of the different CD8 T cell subsets were measured using the Morisita-Horn index. c Scatter plot comparing the TCR repertoire of NKG2A and NKG2A+ DP CD8 TILs. Each dot represents a unique TCR clonotype. Dots on either axis indicate clonotypes detected within a single repertoire; purple dots indicate clonotypes shared between the two CD8 T cell populations. This analysis was performed for 2 patients with HNSCC and 2 patients with CRC.
Fig. 5
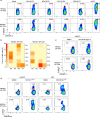
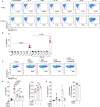
Fig. 5. Tumor antigen-reactive T cells are present in both NKG2A and NKG2A+ DP CD8 TILs.
a In vitro expanded CD8 TILs were cocultured with autologous APCs electroporated with the indicated HPV16 E constructs. T cell reactivity was assessed by 4-1BB upregulation after 20 hours of culture. Data for one representative patient with HPV+ HNSCC are shown. b Summary of the reactivity of NKG2A and NKG2A+ DP CD8 TILs to HPV16 E proteins for 6 patients with HPV+ HNSCC, as measured by 4-1BB upregulation. The colors in the heatmap legend represent the frequency of 4-1BB+ cells. c NKG2A and NKG2A+ DP CD8 TILs isolated from one HPV+ HNSCC patient were cultured with autologous APCs pulsed with DMSO or the peptide 14 of the HPV16 E6 peptide pool and reactivity was measured by 4-1BB upregulation. d NKG2A and NKG2A+ DP CD8 TILs isolated from one HNSCC patient (left) and one CRC patient (right) were cultured with autologous APCs pulsed with DMSO or the indicated mutated peptide and reactivity was measured by 4-1BB upregulation.
Fig. 6
Fig. 6. Induction of NKG2A by CD8 T cells requires additional signals besides TCR stimulation and TGF-β.
a Flow cytometry analysis of one representative donor and (b) summary of NKG2A expression by CD8 T cells following PBMC stimulation with SEB (n = 9), Cytostim (n = 3) or PHA (n = 7) in the presence or absence of TGF-β. c Flow cytometry analysis and (d) summary of NKG2A and CD25 expression on sorted naive CD8 T cells stimulated with CD3/CD28 beads in the presence or absence of TGF-β (n = 5). e Flow cytometry analysis and (f) summary of NKG2A expression by CD8 T cells after stimulation of PBMCs or CD4-depleted PBMCs with SEB in the presence or absence of TGF-β (n = 5). g Summary of NKG2A expression on sorted naive CD8 T cells after coculture with autologous CD4 T cells, monocytes or CD4 T cells + monocytes in the presence of SEB with or without TGF-β (n = 5). All flow analyzes were performed after 8 days of culture. b, d, f, g Data are from distinct healthy donors. Horizontal lines indicate the mean ± SEM. NS= non-significant; p-values were determined by one-way ANOVA with Tukey’s post hoc test (d, g) and by paired 2-tailed t test (f).
Fig. 7
Fig. 7. IL-12 plays a central role in the induction of NKG2A on CD8 T cells.
Sorted naïve CD8 T cells were activated with CD3/CD28 beads for 24 hours, rested for 2 days and restimulated with CD3/CD28 beads for 8 days in the presence of the indicated cytokines with or without TGF-β. a Data from a representative donor and (b) summary of NKG2A expression after 8 days of culture are shown (n = 5). c Expression of NKG2A by CD8 T cells after stimulation of PBMC with SEB in the presence of isotype control, α-IL-12p70 Ab, α-CD40 Ab or both. Data from one representative donor are shown. d Summary of (c) (left) and percentage inhibition of NKG2A expression by CD8 T cells in the different culture conditions (right) (n = 4). e Detection of IL-12p70 in the culture supernatants of PBMCs stimulated for 3 days with SEB in presence or not of α-CD40 Ab (left) and percentage inhibition of IL-12p70 secretion (right) (n = 3). b, d, e Data are from distinct healthy donors. Horizontal lines indicate the mean ± SEM. NS= non-significant; p-values were determined by one-way ANOVA with Tukey’s post hoc test (b, d, g).
Fig. 8
Fig. 8. IL-12 induces NKG2A expression on tumor-reactive CD8 T cells and is secreted in the TME.
a Flow cytometry analysis and (b) summary of the induction of NKG2A expression by NKG2A DP CD8 TILs cultivated for 8 days with an HLA-matched tumor cell line pulsed with their cognate peptide in presence or absence of IL-12 (n = 3). c ISH/IF for IL12 (RNA, magenta), TGF-β (RNA, green) and CD8 (protein, white). Representative low-power image of a CRC tumor sample (left), together with high-power views of four selected areas (right) are shown. Scale bar= 100 μm for the low-power image and 15 μm for high-power views. d The graph illustrates the distance (in µm) of IL-12+ cells to CD8 T cells. The proportion of IL-12+ cells within 0-10 µm, 10–30 µm and > 30 µm is indicated. The analysis was performed on the tumor from 7 patients (3 HNSCC and 4 CRC). g, Data are from tumor-reactive CD8 T cell lines isolated from three cancer patients. Horizontal lines indicate the mean ± SEM. NS= non-significant; p-values were determined by one-way ANOVA with Tukey’s post hoc test.

References

    1. Duhen, T. et al. Co-expression of CD39 and CD103 identifies tumor-reactive CD8 T cells in human solid tumors. Nat. Commun.9, 2724 (2018). - PMC - PubMed
    1. Simoni, Y. et al. Bystander CD8(+) T cells are abundant and phenotypically distinct in human tumour infiltrates. Nature557, 575–579 (2018). - PubMed
    1. Thommen, D. S. et al. A transcriptionally and functionally distinct PD-1(+) CD8(+) T cell pool with predictive potential in non-small-cell lung cancer treated with PD-1 blockade. Nat. Med. 24, 994–1004 (2018). - PMC - PubMed
    1. Rajamanickam, V. et al. Robust antitumor immunity in a patient with metastatic colorectal cancer treated with cytotoxic regimens. Cancer Immunol. Res. 9, 602–611 (2021). - PubMed
    1. van den Bulk, J. et al. CD103 and CD39 coexpression identifies neoantigen-specific cytotoxic T cells in colorectal cancers with low mutation burden. J. Immunother. Cancer11, e005887 (2023). - PMC - PubMed

Publication types

MeSH terms

Associated data

LinkOut - more resources