. 2024 Nov 27;15(1):10206.
doi: 10.1038/s41467-024-54337-4.

Single-cell transcriptome analysis reveals CD34 as a marker of human sinoatrial node pacemaker cardiomyocytes

Affiliations

Single-cell transcriptome analysis reveals CD34 as a marker of human sinoatrial node pacemaker cardiomyocytes

Amos A Lim et al. Nat Commun. .

Abstract

The sinoatrial node regulates the heart rate throughout life. Failure of this primary pacemaker results in life-threatening, slow heart rhythm. Despite its critical function, the cellular and molecular composition of the human sinoatrial node is not resolved. Particularly, no cell surface marker to identify and isolate sinoatrial node pacemaker cells has been reported. Here we use single-nuclei/cell RNA sequencing of fetal and human pluripotent stem cell-derived sinoatrial node cells to reveal that they consist of three subtypes of pacemaker cells: Core Pacemaker, Sinus Venosus, and Transitional Cells. Our study identifies a host of sinoatrial node pacemaker markers including MYH11, BMP4, and the cell surface antigen CD34. We demonstrate that sorting for CD34+ cells from stem cell differentiation cultures enriches for sinoatrial node cells exhibiting a functional pacemaker phenotype. This sinoatrial node pacemaker cell surface marker is highly valuable for stem cell-based disease modeling, drug discovery, cell replacement therapies, and the targeted delivery of therapeutics to sinoatrial node cells in vivo using antibody-drug conjugates.


Conflict of interest statement

Competing interests: S.P. is a paid consultant for BlueRock Therapeutics LP. M.A.L. is a scientific founder and paid consultant for BlueRock Therapeutics LP. G.D.B. is a paid advisor of Adela, Inc.. A.A.L., M.L., and S.P. declare a patent titled “Use of CD34 as a marker for sinoatrial node-like pacemaker cells” (PCT/IB2021/053646) related to this study. All other authors declare no competing interests.

Figures
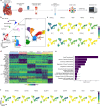
Fig. 1
Fig. 1. Single-nuclei RNA sequencing of fetal SAN tissue identifies markers of Core SAN pacemaker cells.
a Schematic overview of SAN tissue dissection and processing for snRNA-seq on the 10x Genomics Chromium platform. b Uniform manifold approximation and projection (UMAP) of gestation week 19 fetal heart SAN tissue sample showing 19 cell clusters (left). Subclustering of the TNNT2+ cardiomyocytes showing 8 sub-clusters (right). c UMAPs of the subclustered cardiomyocytes showing the expression of the indicated genes. d Heatmap of the top 5 differentially expressed genes (DEGs) within the indicated cardiomyocyte subclusters. e Gene Ontology (GO) analysis (biological processes) of all genes enriched in the Core SAN cluster. f UMAPs showing the top 10 DEGs of the core SAN cluster. Schematics in (a) were generated using Biorender (https://biorender.com).
Fig. 2
Fig. 2. Single-cell RNA sequencing of hPSC-derived SANLPCs reveals transcriptomic similarities to fetal SAN pacemaker cells.
a Schematic overview of SANLPC differentiation protocol and sample processing for scRNA-seq on the 10x Genomics Chromium platform. b UMAP of day 25 HES2-derived SANLPCs showing 11 cell clusters (left). Subclustering of the TNNT2+ cardiomyocytes showing 6 sub-clusters (right). c UMAPs of the subclustered cardiomyocytes showing the expression of the indicated genes. d UMAPs showing signature score distribution for the DEGs of the indicated fetal SAN cell types. e Heatmap of the top 5 DEGs within the indicated cardiomyocyte subclusters. f GO analysis (biological processes) of all genes enriched in the Core SAN cluster. g UMAPs showing the top 10 DEGs of the core SAN cluster. h UMAPs showing Harmony integration of the fetal SAN snRNA-seq data and the hPSC scRNA-seq data labeled by source dataset (left), cluster number (center), and assigned cell types (right). i Stacked bar graph showing the frequency of each cell type from both fetal and hPSC datasets in the indicated cell clusters. j UMAPs of integrated fetal SAN and hPSC datasets showing the expression of the indicated genes. k Spearman correlation between selected clusters from the fetal SAN and hPSC datasets. p < 0.05 for all correlations (asymptotic t approximation). Schematics in (a) were generated using Biorender (https://biorender.com).
Fig. 3
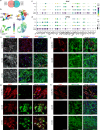
Fig. 3. Comparison of fetal and hPSC-derived SAN cells identifies shared Core SAN markers.
a Venn diagram of the Core SAN markers identified in the fetal and hPSC datasets. b UMAPs of TNNT2+ cardiomyocytes showing the assigned cell types (top row) and the signature score distribution (bottom row) of the shared 36 Core SAN marker genes in the fetal (left) and hPSC datasets (right). c, d Dot plots showing the expression of the conserved core SAN markers in the fetal (c) and hPSC (d) datasets. *indicates genes encoding for membrane-spanning proteins. eh Immunofluorescent staining of day 25 hPSC-derived SANLPCs, atrial-like cardiomyocytes (ALCMs), and ventricular-like cardiomyocytes (VLCMs) for NKX2–5 and SAN pacemaker transcription factor SHOX2, ventricular contractile apparatus protein MLC2V and pacemaker ion channel HCN4, NKX2–5:GFP and atrial protein NPPA (e), Core SAN marker MYH11 (f), Core SAN marker BMP4 (g), and Core SAN marker CD34 (h). Cells were counterstained with cTNT to identify cardiomyocytes and Hoechst to visualize all cells (n = 3) independent differentiations. Images were denoised using nikons denoise.ai. Scale bars, 100 μm.
Fig. 4
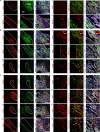
Fig. 4. MYH11, BMP4, and CD34 are specifically expressed in human SAN pacemaker cardiomyocytes.
Immunofluorescent staining of gestation week 19 fetal human SAN for: (a) pacemaker transcription factor TBX3 and pacemaker ion channel HCN4 (aI), SAN pacemaker transcription factor SHOX2 and atrial protein NPPA (aII); (b) core SAN marker MYH11 and HCN4 (bI), Core SAN marker BMP4 and HCN4 (bII), Core SAN marker CD34 and HCN4 (bIII); (c) CD34 and SHOX2 (cI), CD34 and TBX3 (cII), CD34 and MYH11 (cIII), and CD34 and NKX2–5 (cIV). White dashed line outlines the SAN. Yellow and green boxes indicate location of high magnification insets shown on the right marked with *. White arrows in bI* indicate MYH11+ smooth muscle cells of a blood vessel. Arrowheads in cIV* indicate the following cell types: white, CD34+NKX2–5; green, CD34+NKX2–5+; yellow, CD34NKX2–5. Tissue sections were counterstained with cTNT to identify cardiomyocytes and DAPI to visualize all cells (n = 3 independent stains each of sections from 3 heart samples). Images were denoised using nikons denoise.ai. Scale bars, 500 μm (left) and 50 μm in the high magnification insets (right). RA right atrium.
Fig. 5
Fig. 5. MYH11, BMP4, and CD34 are not expressed in human AVN cardiomyocytes.
Immunofluorescent staining of gestation week 17 fetal human AVN for: AVN transcription factor MSX2 and HCN4 (aI), Core SAN marker MYH11 and HCN4 (aII), Core SAN marker BMP4 and HCN4 (aIII), and Core SAN marker CD34 and TBX3 (aIV). Images represent consecutive sections of AVN tissue. White dashed line outlines the AVN. Yellow box indicates location of high magnification insets shown on the right marked with *. Tissue sections were counterstained with cTNT to identify cardiomyocytes and DAPI to visualize all cells (n = 3 independent stains each of sections from 1 heart sample). Images were denoised using nikons denoise.ai. Scale bars, 500 μm (left) and 50 μm in the high magnification insets (right). IVS interventricular septum; RA right atrium.
Fig. 6
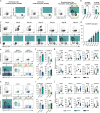
Fig. 6. FACS and MACS sorting for CD34+ cells enriches for SANLPCs.
a Flow cytometric analyses at day 25 of CD34 and NKX2–5:GFP expression in SIRPA+CD90 cardiomyocytes in VLCMs, ALCMs, and SANLPCs. b Bar graphs summarizing the expression of CD34 in myocytes as shown in (a) in the indicated differentiation cultures (left) and within the NKX2–5 and NKX2–5+ fraction of SANLPC differentiation cultures (right) (n = 6 independent differentiations). c Flow cytometric analyses of CD34 and NKX2–5:GFP expression in SIRPA+CD90 cardiomyocytes at indicated time points throughout the differentiation. d Bar graph summarizing the expression of CD34 in myocytes as shown in (c) (n = 6 independent differentiations). e Flow cytometric analyses of CD34 and NKX2–5:GFP expression in SIRPA+CD90 cardiomyocytes before and after FACS at day 25. Teal shading indicates CD34+ and blue shading indicates CD34 FACS sorting gates. f Bar graphs summarizing the proportion of NKX2–5 and NKX2–5+ cells in presort, CD34+, and CD34 FACS sorted samples (n = 7 independent differentiations). g RT-qPCR analysis of the expression of the indicated genes in presort, CD34+, and CD34 FACS sorted samples (n = 7 independent differentiations, n = 4 independent differentiations (genes BMP4)). Values represent expression relative to the housekeeping gene TBP. h Flow cytometric analyses of CD34 and NKX2–5:GFP expression in SIRPA+CD90 cardiomyocytes before and after MACS at day 25. Teal shading indicates CD34+ and blue shading indicates CD34 MACS sorting gates. i Bar graphs summarizing the proportion of NKX2–5 and NKX2–5+ cells in presort, CD34+, and CD34 MACS sorted samples (n = 8 independent differentiations). j RT-qPCR analysis of the expression of the indicated genes in presort, CD34+, and CD34 MACS sorted samples (n = 6 independent differentiations, n = 5 independent differentiation (MYH11, BMP4)). Values represent expression relative to the housekeeping gene TBP. Statistical analysis was performed using two-sided paired t-test when comparing two samples (b, f, i) and one-way ANOVA followed by Bonferroni’s post hoc test when comparing >2 samples (b, g, j). Datasets that failed the normality test ((g): SCN5A, (j): SCN5A) were analyzed using Friedman test with Dunn’s post hoc test: *p < 0.05, **p < 0.01, ***p < 0.001 vs indicated sample. Error bars represent SEM. Violin plot elements: center line, median; lower line, first quartile; upper line, third quartile. Source data are provided as a Source Data file.
Fig. 7
Fig. 7. CITE-seq of hPSC-derived SANLPCs shows that CD34+NKX2–5+ and CD34NKX2–5 cardiomyocytes are transcriptionally similar to SAN pacemaker cells.
a UMAP of the day 25 HES2-derived SANLPC CITE-seq dataset showing 11 cell clusters (left). Subclustering of the TNNT2+ cardiomyocytes showing 7 sub-clusters (right). b UMAPs of the subclustered cardiomyocytes showing the expression of the indicated genes. c UMAPs showing signature score distribution for the DEGs of the indicated fetal SAN cell types. d UMAPs showing the expression of CD34 on the transcript (RNA) or protein level (antibody-derived tag (ADT)) (left) and co-expression with NKX2–5 transcript (right). e Stacked bar graph quantifying the number of cells expressing CD34 by transcript (RNA) or protein (ADT) grouped based on NKX2–5 expression by transcript. f UMAPs showing the distribution of the selected cell populations indicated above. g Box plots showing the expression of the indicated genes on the transcript level and CD34 on the protein level (ADT) in the selected cell populations indicated below (CD34+NKX2–5+ n = 78; CD34+NKX2–5 n = 1465; CD34NKX2–5 n = 2294; Atrial CD34NKX2–5+ n = _97 single cells). h Spearman correlation between the selected cell populations indicated on the axes. p < 0.05 for all correlations (asymptotic t approximation). Blue labels indicate the data that is showing protein level (ADT)-based CD34 expression. Box plot elements: center line, median; box limits, upper and lower quartiles; whiskers, 1.5x interquartile range. Source data are provided as a Source Data file.
Fig. 8
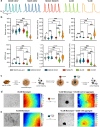
Fig. 8. CD34+ sorted cells have a functional pacemaker phenotype.
a Representative optical action potential traces of day 25 MACS sorted CD34+ and CD34 cells, FACS sorted SIRPA+CD90NKX2–5 SANLPCs, as well as ALCMs and VLCMs generated from the HES3 NKX2–5eGFP/w hPSC line. b Optical action potential parameters analyzed in the indicated cell types (MACS pre-sort, n = 46; MACS CD34+, n = 47; MACS CD34, n = 43; SANLPC, n = 57; ALCM, n = 79; VLCM, n = 51 cell aggregates from three biological replicates (independent differentiations) for each cell type). Statistical analysis was performed using Kruskal-Wallis test followed by Dunn’s post hoc test: *p < 0.05, **p < 0.01, ***p < 0.001 vs. indicated sample. c Schematic overview of the experimental design used to assess the pacemaker capacity of the CD34+ cardiomyocytes in vitro. d Representative bright field images (left) and color-coded activation maps (right) of a VLCM monolayer before and ~4 weeks after the addition of a VLCM control aggregate (n = 12 independent experiments from three biological replicates (independent differentiations)). e Representative bright field images (left) and color-coded activation maps (right) of a VLCM monolayer before and ~4 weeks after the addition of a MACS-sorted CD34+ cardiomyocyte (CM) aggregate (n = 10 independent experiments from three biological replicates (independent differentiations)). Scale bars, 1000 μm. Violin plot elements: center line, median; lower line, first quartile; upper line, third quartile. APD30/90, Action potential duration at 30%/90% repolarization. Source data are provided as a Source Data file. Schematics in (c) were generated using Biorender (https://biorender.com).
Fig. 9
Fig. 9. CD34 knockout does not impact SAN pacemaker differentiation and function.
a Flow cytometric analyses at day 25 of CD34 and NKX2–5:GFP expression in SIRPA+CD90 cardiomyocytes in AAVS1 Control, CD34 KO 1, and CD34 KO 2 SANLPC differentiations. b Bar graphs summarizing the percentage of NKX2–5 myocytes (left) and NKX2–5+ myocytes (right) in the indicated differentiation cultures (n = 3 independent differentiations). c RT-qPCR analysis of the expression of the indicated genes in SIRPA+CD90NKX2–5 FACS sorted cells from day 25 AAVS1 Control and CD34 KO 1 differentiations (n = 3 independent differentiations). Statistical analysis was performed using two-sided unpaired t-test. Datasets that failed the normality test (MYH11) were analyzed using two-sided Mann-Whitney test: *p < 0.05 vs indicated sample. d Optical action potential parameters recorded in day 25 FACS sorted SIRPA+CD90NKX25 cardiomyocytes from AAVS1 Control and CD34 KO 1 differentiations (AAVS1 Control, n = 48 (n1 = 16, n2 = 16, n3 = 16) and CD34 KO 1, n = 38 (n1 = 12, n2 = 13, n3 = 13) cell aggregates from three biological replicates (independent differentiations)). Statistical analysis was performed using two-sided unpaired t-test. Datasets that failed the normality test (APD90) were analyzed using two-sided Mann-Whitney test: *p < 0.05, **p < 0.01 vs indicated sample. Error bars represent SEM. Violin plot elements: center line, median; lower line, first quartile; upper line, third quartile. APD30/90, Action potential duration at 30%/90% repolarization, KO knockout. Source data are provided as a Source Data file.

References

    1. Cantillon, D. J. et al. Complications and health care costs associated with transvenous cardiac pacemakers in a nationwide assessment. JACC Clin. Electrophysiol.3, 1296–1305 (2017). - PubMed
    1. Christoffels, V. M., Smits, G. J., Kispert, A. & Moorman, A. F. Development of the pacemaker tissues of the heart. Circ. Res.106, 240–254 (2010). - PubMed
    1. Sizarov, A. et al. Molecular analysis of patterning of conduction tissues in the developing human heart. Circ. Arrhythm. Electrophysiol.4, 532–542 (2011). - PubMed
    1. van Eif, V. W. W. et al. Transcriptome analysis of mouse and human sinoatrial node cells reveals a conserved genetic program. Development146, dev173161 (2019). - PubMed
    1. Chandler, N. J. et al. Molecular architecture of the human sinus node: insights into the function of the cardiac pacemaker. Circulation119, 1562–1575 (2009). - PubMed

Publication types

MeSH terms

Associated data