. 2006 Apr;38(4):421-30.
doi: 10.1038/ng1752. Epub 2006 Mar 5.

Genetic regulators of large-scale transcriptional signatures in cancer

Affiliations

Genetic regulators of large-scale transcriptional signatures in cancer

Adam S Adler et al. Nat Genet. 2006 Apr.

Abstract

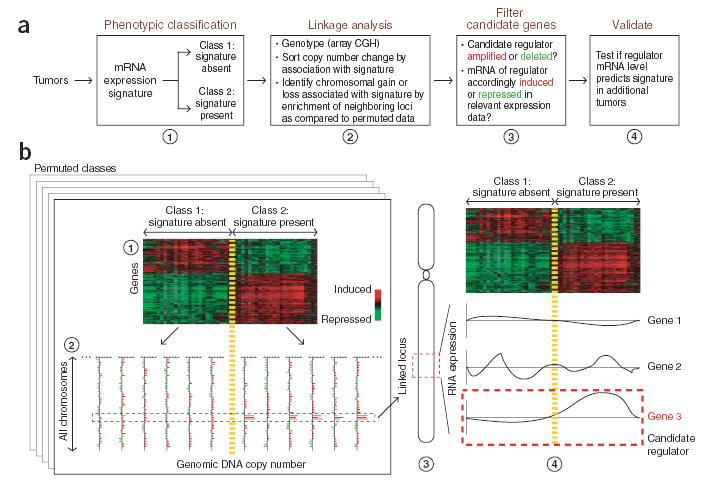
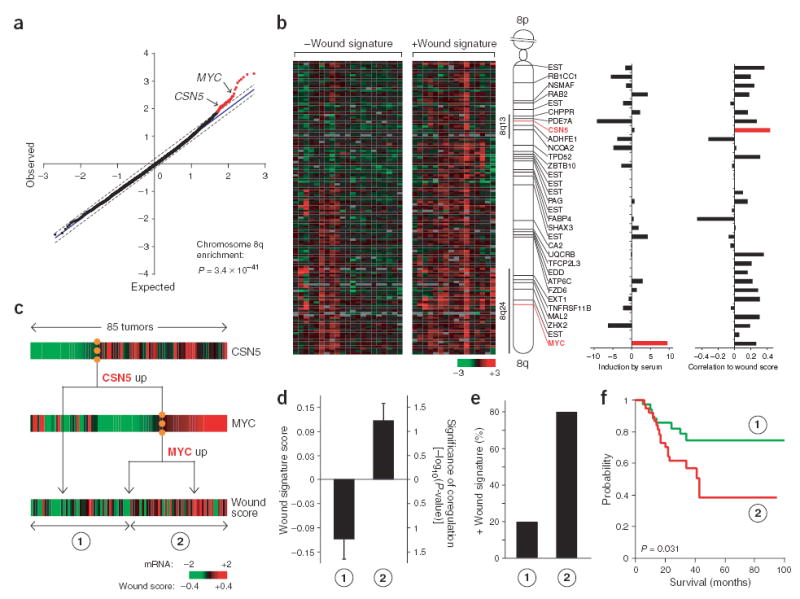
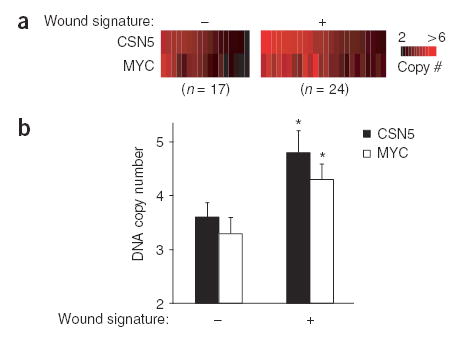
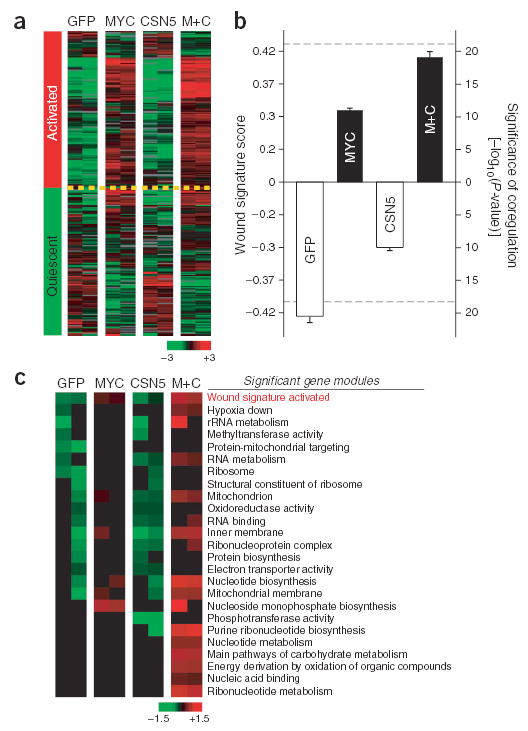
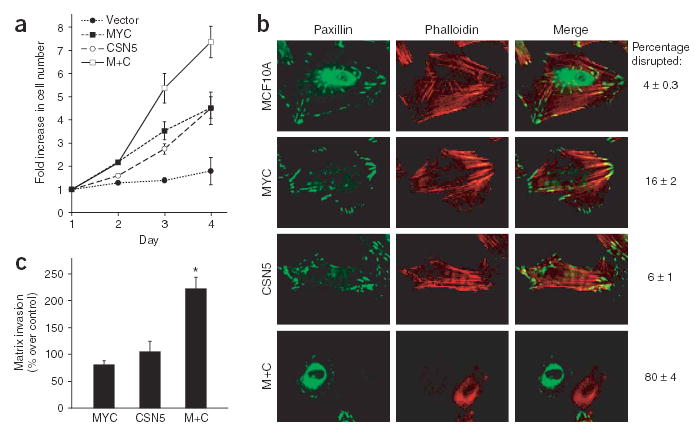
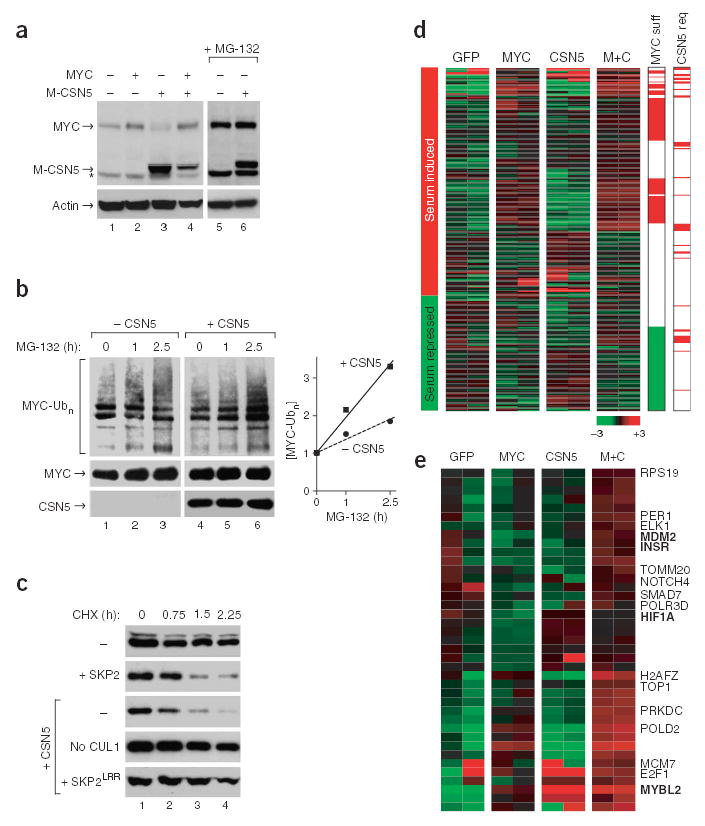
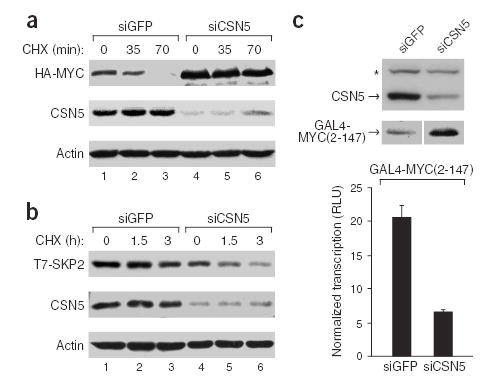
Gene expression signatures encompassing dozens to hundreds of genes have been associated with many important parameters of cancer, but mechanisms of their control are largely unknown. Here we present a method based on genetic linkage that can prospectively identify functional regulators driving large-scale transcriptional signatures in cancer. Using this method we show that the wound response signature, a poor-prognosis expression pattern of 512 genes in breast cancer, is induced by coordinate amplifications of MYC and CSN5 (also known as JAB1 or COPS5). This information enabled experimental recapitulation, functional assessment and mechanistic elucidation of the wound signature in breast epithelial cells.


Conflict of interest statement

COMPETING INTERESTS STATEMENT

The authors declare competing financial interests (see the Nature Genetics website for details).

Figures

Figure 1
Figure 1
Overview of SLAMS analysis procedure. (a) Flow chart of steps in our strategy of mapping genetic regulators of expression signatures in cancer. (b) Example of the analysis on a gene expression signature and genome-wide DNA copy number data. Tumor samples are sorted into two classes on the basis of the presence of a binary gene expression signature (step 1). DNA copy numbers at all genome-wide loci are compared between these two classes of samples (step 2). Amplification of three neighboring genes is observed in 80% of samples with the signature but in 0% of samples without the signature, indicating genetic linkage. The predicted relationship between level of mRNA expression of the candidate genes and the expression signature is thus a positive correlation. Filtering (step 3) and validation (step 4) of the candidate genes shows that Gene 1 mRNA is negatively correlated with the signature, whereas Gene 2 mRNA is not correlated. Gene 3 mRNA is positively correlated with presence of the signature and emerges as the predicted regulator.
Figure 2
Figure 2
Linkage of MYC and CSN5 amplifications with wound signature. (a) Association of 8q amplification with wound signature. The greater signal in the observed data over the expected signal in permuted data indicates selective amplification in tumors with the wound signature (57 probes in red). (b) Amplification of regions of chromosome 8q in breast tumors. Array CGH data of 132 probes representing chromosome 8q is shown for breast tumors that show the wound signature (right, 16 arrays) or lack the wound signature (left, 21 arrays). Red indicates amplification, whereas green indicates deletion. The identity of 32 amplified probes linked to the wound signature (left), the degree of transcriptional induction by serum (middle) and the correlation of mRNA level to the wound score in 85 breast tumors (right) is shown. (c) CSN5 and MYC mRNA levels predict the wound signature. A decision tree model of CSN5 and MYC mRNA level was used to sort the 85 tumors into two groups. (d) Average wound scores (± s.e.m.) of the two groups. (e) Tumors with an activated wound signature (wound score ≥0.2) are enriched in group 2. (f) Kaplan-Meier survival curve of patients partitioned in c.
Figure 3
Figure 3
Association of MYC and CSN5 genomic DNA amplification with wound signature in an independent set of breast tumors. (a) DNA copy numbers of MYC and CSN5 in breast tumors with and without wound signature expression, as determined by quantitative microsatellite analysis. (b) Copy number (mean ± s.e.m.) for tumors with and without a wound signature. *, P < 0.02, Student’s t-test.
Figure 4
Figure 4
MYC and CSN5 activate the wound signature. (a) Expression of wound signature genes in transduced MCF10A cells after serum starvation. M+C represents MYC plus CSN5. Left column shows the canonical pattern of gene expression in wound signature. (b) Wound signature scores of samples in a (mean ± s.e.m.). Dashed lines indicate highest and lowest wound scores previously observed in 295 human breast tumors. (c) Gene modules regulated by MYC and CSN5. Each row shows mean expression level of all genes in a module. From top to bottom, modules are in decreasing order of coregulation of member genes based on P-value. Only significant modules (P < 0.05, FDR < 0.05) are shown. Wound signature was the most significantly induced gene module by MYC and CSN5 out of all 1,284 input modules.
Figure 5
Figure 5
MYC and CSN5 induce features of invasive cancer cells. (a) Cell proliferation by daily counts of transduced MCF10A cells (mean ± s.e.m.). (b) Alterations in cell shape and adhesion. Frequency of disruption of focal adhesions (anti-paxillin, green) and actin stress fibers (TRITC-phalloidin, red) is shown (mean ± s.e.m.). (c) Cell invasion through Matrigel. Percentage increase over control cells (vector) is shown (mean ± s.e.m.). *, P < 0.05, Student’s t-test.
Figure 6
Figure 6
CSN5 induces MYC ubiquitination, turnover and activation of select MYC target genes. (a) Expression of MYC and CSN5 protein in transduced MCF10A cells. The CSN5 construct contains a MYC epitope tag. Two rightmost lanes: with proteasome inhibitor MG-132 (25 μM) 8 h before harvesting. *, nonspecific band. (b) Cell-based ubiquitination assay. Upper left: hemagglutinin (HA)-MYC conjugated with His-ubiquitin. Lower left: HA-MYC and HA-CSN5 in input U2OS cell lysates. Right: quantification of accumulation of ubiquitinated MYC relative to input MYC. (c) CSN5 induces MYC turnover via SCFSKP2. U20S cells were transfected with CUL1 and the indicated plasmids. HA-MYC protein at the indicated times after cycloheximide treatment (CHX, 100 μg ml−1) is shown. (d) Expression of 175 MYC target genes in transduced MCF10A cells after serum starvation. ‘MYC suff’, genes regulated by MYC expression alone; ‘CSN5 req’, genes that require CSN5 coexpression for full activation. Direction of regulation of genes by 5% serum is indicated at left. (e) Expression of the 39 genes highlighted by ’CSN5 req’ in d.
Figure 7
Figure 7
CSN5 is required for SKP2 activity, stability and transcriptional activity of MYC. (a) Endogenous CSN5 is required for SKP2-mediated MYC turnover. HEK293 cells were transfected with HA-MYC, T7-SKP2 and the indicated siRNA (siGFP is a negative control). HA-MYC and endogenous CSN5 protein at the indicated times after CHX treatment (150 μg ml−1) are shown. (b) CSN5 depletion destabilizes SKP2. U2OS cells were transfected with T7-SKP2, CUL1 and the indicated siRNA. T7-SKP2 and endogenous CSN5 protein at the indicated times after CHX treatment are shown. (c) CSN5 is required for MYC-mediated transcription. Top: siRNA-mediated silencing of endogenous CSN5 protein in 293 cells and expression of GAL4-MYC(2-147). *, nonspecific band. Bottom: relative luciferase units (RLU) of GAL4-MYC(2-147)-mediated transcription of a luciferase reporter gene normalized to input MYC levels (mean ± s.e.m.).

References

    1. Liu ET. Classification of cancers by expression profiling. Curr Opin Genet Dev. 2003;13:97–103. - PubMed
    1. Perou CM, et al. Molecular portraits of human breast tumours. Nature. 2000;406:747–752. - PubMed
    1. Sorlie T, et al. Gene expression patterns of breast carcinomas distinguish tumor subclasses with clinical implications. Proc Natl Acad Sci USA. 2001;98:10869–10874. - PMC - PubMed
    1. van ‘t Veer LJ, et al. Gene expression profiling predicts clinical outcome of breast cancer. Nature. 2002;415:530–536. - PubMed
    1. Chang HY, et al. Gene expression signature of fibroblast serum response predicts human cancer progression: Similarities between tumors and wounds. PLoS Biol. 2004;2:206–214. - PMC - PubMed

Publication types

Associated data