. 2011 May 6;30(12):2388-404.
doi: 10.1038/emboj.2011.140.

The transcription factor Pax5 regulates its target genes by recruiting chromatin-modifying proteins in committed B cells

Affiliations

The transcription factor Pax5 regulates its target genes by recruiting chromatin-modifying proteins in committed B cells

Shane McManus et al. EMBO J. .

Abstract

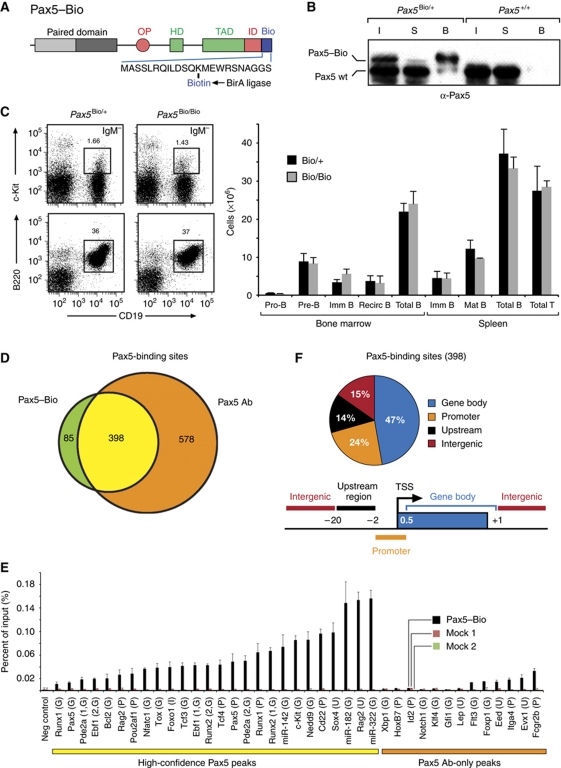
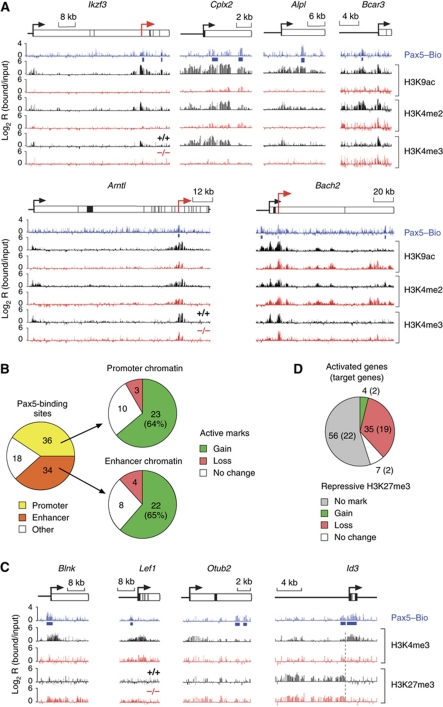
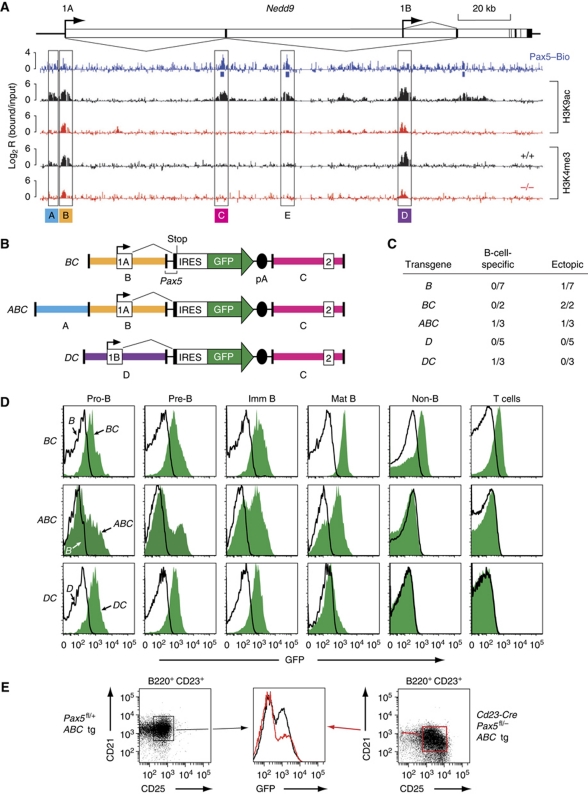
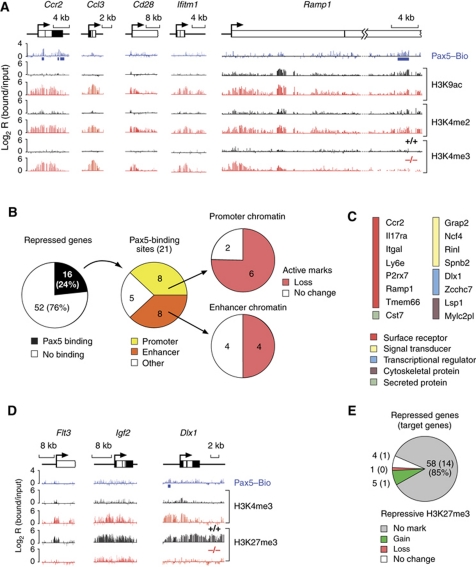
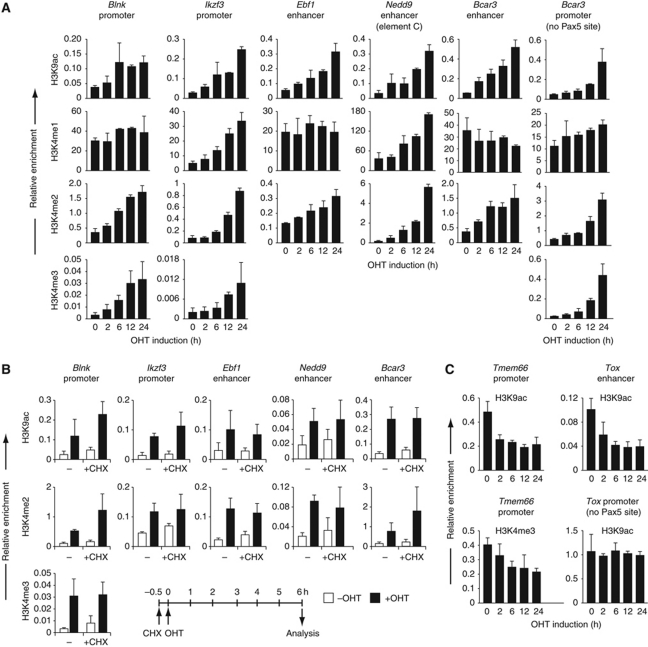
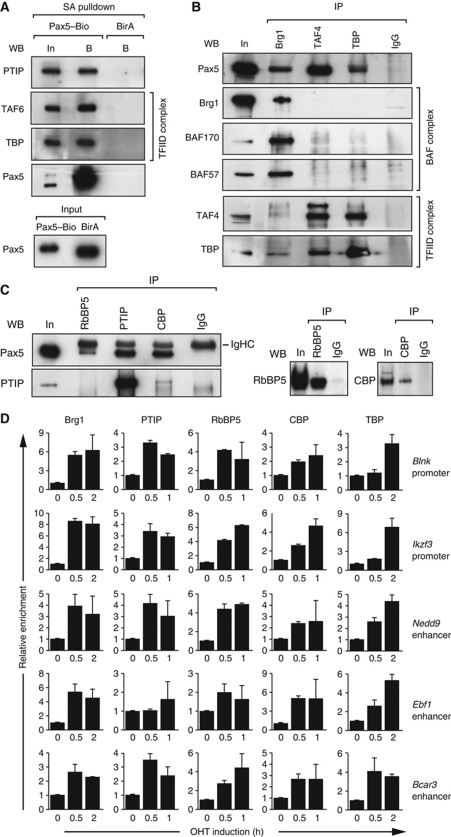
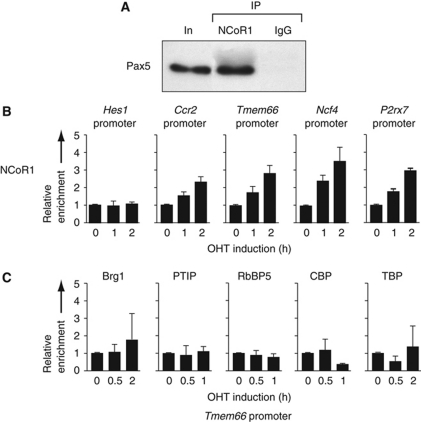
Pax5 is a critical regulator of B-cell commitment. Here, we identified direct Pax5 target genes by streptavidin-mediated ChIP-chip analysis of pro-B cells expressing in vivo biotinylated Pax5. By binding to promoters and enhancers, Pax5 directly regulates the expression of multiple transcription factor, cell surface receptor and signal transducer genes. One of the newly identified enhancers was shown by transgenic analysis to confer Pax5-dependent B-cell-specific activity to the Nedd9 gene controlling B-cell trafficking. Profiling of histone modifications in Pax5-deficient and wild-type pro-B cells demonstrated that Pax5 induces active chromatin at activated target genes, while eliminating active chromatin at repressed genes in committed pro-B cells. Pax5 rapidly induces these chromatin and transcription changes by recruiting chromatin-remodelling, histone-modifying and basal transcription factor complexes to its target genes. These data provide novel insight into the regulatory network and epigenetic regulation, by which Pax5 controls B-cell commitment.


Conflict of interest statement

The authors declare that they have no conflict of interest.

Figures

Figure 1
Figure 1
Identification of Pax5-binding sites by streptavidin pulldown of in vivo biotinylated Pax5 protein. (A) Schematic diagram of the Pax5–Bio protein with its C-terminal biotin acceptor sequence. OP, octapeptide; HD, partial homeodomain; TAD, transactivation domain; ID, inhibitory domain. For gene targeting, see Supplementary Figure S1. (B) Efficient precipitation of in vivo biotinylated Pax5 protein by streptavidin pulldown. The biotinylated Pax5–Bio protein was precipitated with streptavidin beads from a nuclear extract of Pax5Bio/+ pro-B cells. The bound fraction (B), supernatant (S) and input nuclear extract (I) were analysed by immunoblot analysis with an anti-Pax5 antibody. (C) Normal B-cell development in Pax5Bio/Bio mice. Bone marrow and spleen of 6-week-old littermates of the indicated genotypes (n=4 each) were analysed by flow cytometry to determine the absolute cell numbers of the different B-cell types (left). Representative flow cytometric data (right) are shown for pro-B cells (c-Kit+CD19+IgM) and total B cells (B220+CD19+) of the bone marrow. See Supplementary Figure S2 for further flow cytometric data and the definition of all B-cell types. (D) Venn diagram indicating the number of shared and unique Pax5-binding sites that were detected in pro-B cells by antibody (Ab)- and Bio-ChIP-chip analysis. (E) Validation of Pax5-binding sites by streptavidin-mediated ChIP analysis of Pax5Bio/Bio Rag2–/– pro-B cells. Input and precipitated DNA were quantified by real-time PCR with primer pairs amplifying Pax5-binding regions of the indicated genes, and the amount of precipitated DNA is shown as percentage relative to input DNA (Pax5–Bio). Control ChIP experiments were performed with pro-B cells of a Rosa26BirA/BirA mouse using streptavidin beads (mock 1) or with Pax5Bio/Bio pro-B cells using protein A-coupled Dynabeads (mock 2). The average values and standard deviations of two independent experiments are shown together with the location of the Pax5-binding sites of the indicated genes in the gene body (G), promoter (P), upstream sequence (U) or intergenic region (I), as defined below. (F) Pie diagram showing the percentage of the 398 high-confidence Pax5-binding sites that are located in the upstream region (−20 to −2 kb relative to the TSS), promoter (−2 to +0.5 kb), gene body (+0.5 to 1 kb past the 3′ end) or intergenic region (upstream of −20 kb and downstream of 1 kb beyond the 3′ end). The result of one of two representative antibody- and Bio-ChIP-chip experiments is shown.
Figure 2
Figure 2
Identification of activated Pax5 target genes. (A) ChIP-chip mapping of Pax5-binding sites in pro-B cells. Antibody-ChIP-chip (Pax5 Ab) or Bio-ChIP-chip (Pax5–Bio) analysis was used to detect the binding of Pax5 to its target genes in Rag2–/– or Pax5Bio/Bio Rag2–/– pro-B cells, respectively. A schematic diagram of four selected target genes indicates the TSS (arrow), exons (black boxes) and introns (white boxes) together with a scale bar (in kb). The logarithmic ratio (log2) of the hybridization intensities between precipitated and input DNA (bound/input) is shown as a vertical bar for each oligonucleotide on the microarray. Horizontal bars below the ChIP tracks identify significant Pax5 peaks that reached values above the threshold of the peak-finder analysis in both Ab- and Bio-ChIP-chip analyses (blue) or only in the Ab-ChIP-chip experiment (red). The exons of Ikzf3 are numbered. (B) Location of Pax5-binding sites. A pie diagram indicates the percentage of Pax5-binding sites in the promoter (−2 to +0.5 kb relative to TSS), gene body (+0.5 to 1 kb beyond 3′ end) or upstream regions (−2 to −10 and −10 to −20 kb) of activated Pax5 target genes. (C) Direct versus indirect regulation of Pax5-activated genes. Direct Pax5 target genes were defined by the presence of Pax5-binding sites. (D) List of direct Pax5 target genes that are activated in pro-B cells. The colour code refers to the gene functions listed in (E). (E) Pie diagram indicating the different functional classes of activated Pax5 target genes.
Figure 3
Figure 3
Chromatin changes at activated Pax5 target genes. (A) Induction of active chromatin by Pax5. Pax5+/+ (+/+, black) and Pax5–/– (–/–, red) pro-B cells on a Rag2-deficient background were used for ChIP-chip analysis with antibodies detecting H3K4me2, H3K4me3 and H3K9ac. Pax5 binding was determined by Bio-ChIP-chip analysis of Pax5Bio/Bio Rag2–/– pro-B cells (Pax5–Bio, blue). Blue bars denote significant Pax5 peaks identified by peak-finder analysis. Red arrows denote newly identified putative promoters. (B) Statistical evaluation of chromatin changes at promoter and enhancer regions of activated Pax5 target genes. Promoters and putative enhancers were defined by the chromatin signature H3K4me3+ and H3K9ac+ H3K4me2+ H3K4me3, respectively. ‘Other’ refers to other assortments of active histone marks, which primarily corresponded to the combination H3K9ac H3K4me2+ H3K4me3. Pax5-dependent gain, loss or no change of active histone marks was evaluated for Pax5-binding sites at promoter and enhancer positions in Pax5+/+ Rag2–/– pro-B cells compared with Pax5–/– Rag2–/– pro-B cells. (C) Conversion of repressive to active chromatin at promoter regions of Pax5-activated genes. Active H3K4me3 and repressive H3K27me3 modifications as well as Pax5-binding sites were mapped by ChIP-chip analysis of the respective pro-B cell type. (D) Pie diagram describing the changes of repressive chromatin (H3K27me3) at activated genes in Pax5+/+ Rag2–/– pro-B cells compared with Pax5–/– Rag2–/– pro-B cells. All 102 Pax5-activated genes present on the microarray were evaluated. The result obtained with direct Pax5 target genes is shown in brackets.
Figure 4
Figure 4
Transgenic characterization of a Pax5-dependent enhancer of the Nedd9 gene. (A) Chromatin profiling of the Pax5 target gene Nedd9, which is shown with its exon–intron structure, two promoters and alternative splicing pattern. Active histone modifications (H3K9ac and H3K4me3) and Pax5-binding sites were mapped in Pax5+/+ (+/+, black), Pax5–/– (–/–, red) or Pax5Bio/Bio (Pax5–Bio, blue) pro-B cells on a Rag2-deficient background. The locations of the DNA fragments used for the assembly of transgenes are shown. (B) Schematic diagram of the Nedd9 transgenes BC, ABC and DC. The backbone of the transgenes consisted of the 3′ intronic sequences and 5′ part of exon 2 of Pax5 linked to stop codons in all three reading frames, an internal ribosome entry sequence (IRES), a green fluorescent protein (GFP) gene and SV40 polyadenylation (pA) sites. The mm8 sequence coordinates for the cloned DNA fragment of the Nedd9 gene on mouse chromosome 13 are 41 503 763–41 500 531 (fragment A), 41 500 360–41 495 609 (fragment B), 41 440 609–41 436 311 (fragment C) and 41 372 020–41 366 820 (fragment D). (C) Statistical evaluation of the GFP expression patterns of the different Nedd9 transgenes. The number of transgenic lines with a B-cell-specific or ectopic expression pattern is shown relative to the total number of lines obtained for each transgenic construct. (D) GFP expression of the transgenic lines. GFP expression was analysed by flow cytometry in pro-B (CD19+c-Kit+), pre-B (CD19+CD25+IgM), immature B (CD19+IgM+IgD), mature B (CD19+IgMIgD+) and non-B cells (B220CD19) cells from the bone marrow and unfractionated T cells from the thymus. GFP expression (green surface) is shown for one ectopic BC line as well as for the B-cell-specific ABC and DC lines (see panel (C)). The non-expressing lines B and D served as negative controls (black line). (E) Pax5-dependent GFP expression of the transgenic ABC line in mature B cells. Follicular B cells (B220+CD23+CD21+) of a transgenic ABC Cd23-Cre Pax5fl/− mouse (black) and control ABC Pax5fl/+ littermate (red) were analysed by flow cytometry for CD25 and GFP expression. The representative analysis of one of four transgenic ABC Cd23-Cre Pax5fl/− and control mice is shown.
Figure 5
Figure 5
Chromatin changes at repressed Pax5 target genes. (A) Loss of active chromatin at repressed Pax5 target genes in committed pro-B cells. Active histone modifications (H3K9ac, H3K4me2 and H3K4me3) and Pax5-binding sites were mapped in Pax5+/+ (+/+, black), Pax5–/– (–/–, red) or Pax5Bio/Bio (Pax5–Bio, blue) pro-B cells on a Rag2-deficient background. Blue bars denote significant Pax5 peaks. (B) Evaluation of chromatin changes at repressed direct Pax5 target genes. See legend of Figure 3B for further explanations. (C) List of direct Pax5 target genes that are repressed in committed pro-B cells. The colour code indicates the function of each gene. Tmem66 is also known as 1810045K07Rik and Rinl as 5830482F20Rik. (D) Gain of the repressive H3K27me3 modification at Pax5-repressed genes. Pax5-binding sites as well as active H3K4me3 and repressive H3K27me3 modifications were mapped by ChIP-chip analysis of the respective pro-B cell type. (E) Absence of the repressive H3K27me3 modification at most Pax5-repressed genes in committed Pax5+/+ Rag2–/– pro-B cells. All 68 Pax5-repressed genes present on the microarray were evaluated. The result obtained with direct Pax5 target genes is shown in brackets.
Figure 6
Figure 6
Rapid induction of chromatin changes by Pax5. (A) Rapid induction of active chromatin at Pax5-binding sites in promoters and enhancers of Pax5 target genes. Pax5–/– pro-B cells expressing the Pax5–oestrogen receptor (ER) fusion protein (KO-Pax5–ER pro-B cells) were treated for the indicated time with 4-hydroxytamoxifen (OHT, 1 μM) before ChIP analysis with histone modification-specific antibodies. Input and precipitated DNA were quantified by real-time PCR with primer pairs amplifying the Pax5-binding regions of the indicated genes and the promoter of the ubiquitously expressed control gene coding for the TATA-binding protein (TBP). The amount of precipitated DNA was determined as percentage relative to input DNA for each region analysed and is shown as relative enrichment at the target site compared with the Tbp promoter by dividing the percentage of precipitated DNA at the Pax5-binding site (target ChIP/target input) by the percentage of precipitated DNA at the Tbp promoter (Tbp ChIP/Tbp input). The average values and standard deviations of two independent experiments are shown. (B) Pax5-dependent induction of active chromatin in the absence of protein synthesis. Where indicated, the KO-Pax5–ER pro-B cells were pre-incubated with cycloheximide (CHX; 25 μg/ml) for 30 min before the addition of OHT (1 μM) for 6 h, as schematically indicated below. The ChIP analysis was performed and evaluated as described in (A). Average values and standard deviations of two independent experiments are shown. Black and white bars refer to the presence or absence of OHT treatment, respectively. (C) Rapid reduction of active chromatin at the Pax5-binding sites of the repressed Pax5 target genes Tmem66 and Tox. The ChIP data were evaluated as described in (A).
Figure 7
Figure 7
Pax5 rapidly recruits histone-modifying, chromatin-remodelling and basal transcription factor complexes to activated Pax5 target genes. (A) Co-precipitation of PTIP, TAF6 and TBP with Pax5–Bio. Abelson murine leukaemia virus (Ab-MLV)-transformed pro-B cells of the Pax5Bio/Bio (Pax5–Bio) or control Rosa26BirA/BirA (BirA) genotype were used for streptavidin (SA) pulldown of nuclear extracts. The input (In) fraction (1/100) and streptavidin-bound (B) precipitate were analysed by western blotting (WB) with antibodies (Abs) detecting the indicated proteins. Pax5 was present in similar amounts in both input fractions. (B, C) Co-immunoprecipitation of Pax5 from nuclear extract of Ab-MLV-transformed Pax5Bio/Bio (B) and Rag2–/– (C) pro-B cells with Brg1, TAF4, TBP, RbBP5, PTIP or CBP antibodies. In panel (B), Pax5 was visualized in the immunoprecipitate (IP) by western blotting with a biotinylated rat anti-Pax5 mAb (detected with streptavidin-coupled horse radish peroxidase). Input (In; 1/100) and rabbit IgG were used as controls. Only one tenth of the immunoprecipitated fractions were used for western blotting with the Brg1 antibody. In panel (C), Pax5 was detected with unlabelled rat anti-Pax5 mAb, which was visualized with an anti-rat IgG Ab that crossreacted with the heavy-chain (IgHC) of the rabbit IgG Abs (left). Only one tenth of the immunoprecipitated fractions were used for western blotting with RbBP and CBP antibodies (right). (D) Rapid recruitment of histone-modifying, chromatin-remodelling and basal transcription factor complexes to activated Pax5 target genes. KO-Pax5–ER pro-B cells were treated for up to 2 h with 4-hydroxytamoxifen (OHT, 1 μM) before ChIP with antibodies precipitating the indicated proteins. Input and precipitated DNA were quantified by real-time PCR with primer pairs amplifying the Pax5-binding regions of the indicated genes and the control Tbp promoter. The enrichment of precipitated DNA at the target sites relative to the Tbp promoter was determined as described in the legend of Figure 6A. The relative enrichment at time point 0 was set to 1. The average values and standard deviations of two independent experiments are shown.
Figure 8
Figure 8
Rapid recruitment of the NCoR1 complex to Pax5-binding sites of repressed target genes. (A) Interaction of Pax5 with the NCoR1 corepressor complex. Co-immunoprecipitation of Pax5 from nuclear extracts of Rag2–/– pro-B cells with NCoR1 antibodies. Pax5 was visualized in the immunoprecipitate (IP) by western blotting with a biotinylated rat anti-Pax5 mAb (detected with streptavidin-coupled horse radish peroxidase). Input (In; 1/200) and rabbit IgG were used as controls. (B) NCoR1 recruitment to repressed Pax5 target genes. KO-Pax5–ER pro-B cells were treated for the indicated time with 4-hydroxytamoxifen (OHT, 1 μM) before ChIP with an NCoR1 antibody. Input and precipitated DNA were quantified by real-time PCR with primer pairs amplifying the Pax5-binding regions of the indicated repressed Pax5 target genes and an inactive intergenic region on chromosome 1. The enrichment of precipitated DNA at the target sites relative to the chromosome 1 region was determined as described in the legend of Figure 6A. The relative enrichment at time point 0 was set to 1. The average values and standard deviations of two independent experiments are shown. The Hes1 promoter lacking Pax5-binding sites served as negative control. (C) No recruitment of activating protein complexes to the promoter of the repressed target gene Tmem66 upon Pax5–ER activation. KO-Pax5–ER pro-B cells were treated with OHT (1 μM) before ChIP with Brg1, PTIP, RbBP5, CBP and TBP antibodies and PCR analysis as described in (B). The average values and standard deviations of two independent experiments are shown.

References

    1. Adams B, Dörfler P, Aguzzi A, Kozmik Z, Urbánek P, Maurer-Fogy I, Busslinger M (1992) Pax-5 encodes the transcription factor BSAP and is expressed in B lymphocytes, the developing CNS, and adult testis. Genes Dev 6: 1589–1607 - PubMed
    1. Barlev NA, Emelyanov AV, Castagnino P, Zegerman P, Bannister AJ, Sepulveda MA, Robert F, Tora L, Kouzarides T, Birshtein BK, Berger SL (2003) A novel human Ada2 homologue functions with Gcn5 or Brg1 to coactivate transcription. Mol Cell Biol 23: 6944–6957 - PMC - PubMed
    1. Bernstein BE, Kamal M, Lindblad-Toh K, Bekiranov S, Bailey DK, Huebert DJ, McMahon S, Karlsson EK, Kulbokas EJ III, Gingeras TR, Schreiber SL, Lander ES (2005) Genomic maps and comparative analysis of histone modifications in human and mouse. Cell 120: 169–181 - PubMed
    1. Bernstein BE, Mikkelsen TS, Xie X, Kamal M, Huebert DJ, Cuff J, Fry B, Meissner A, Wernig M, Plath K, Jaenisch R, Wagschal A, Feil R, Schreiber SL, Lander ES (2006) A bivalent chromatin structure marks key developmental genes in embryonic stem cells. Cell 125: 315–326 - PubMed
    1. Boyer LA, Plath K, Zeitlinger J, Brambrink T, Medeiros LA, Lee TI, Levine SS, Wernig M, Tajonar A, Ray MK, Bell GW, Otte AP, Vidal M, Gifford DK, Young RA, Jaenisch R (2006) Polycomb complexes repress developmental regulators in murine embryonic stem cells. Nature 441: 349–353 - PubMed

Publication types

Associated data