. 2011 Jul 6;14(1):67-79.
doi: 10.1016/j.cmet.2011.04.013.

Protection from obesity and diabetes by blockade of TGF-β/Smad3 signaling

Affiliations

Protection from obesity and diabetes by blockade of TGF-β/Smad3 signaling

Hariom Yadav et al. Cell Metab. .

Abstract

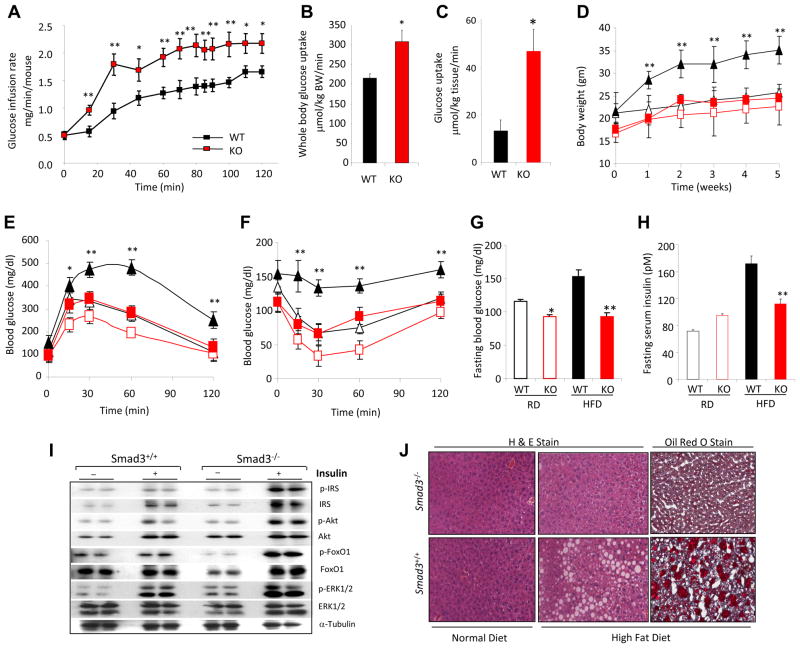
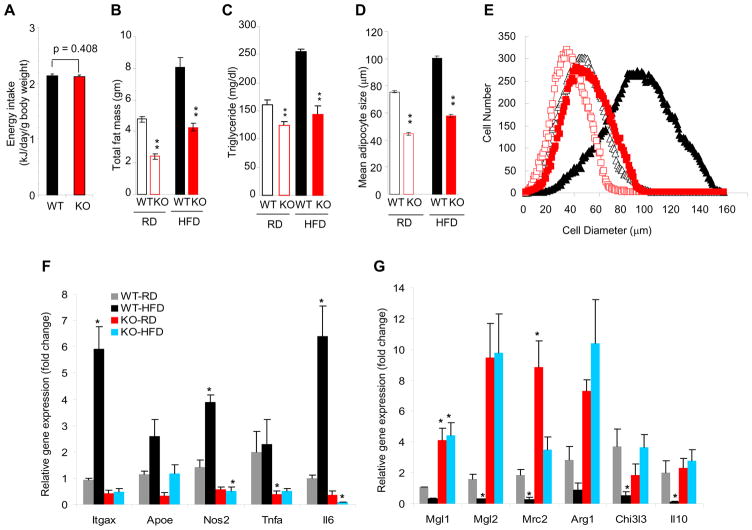
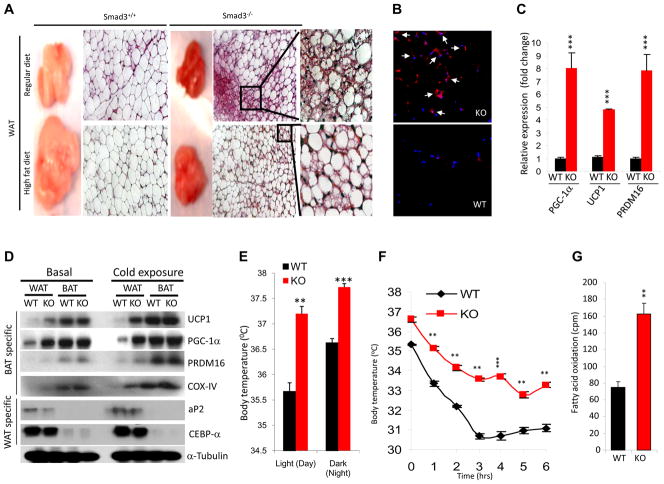
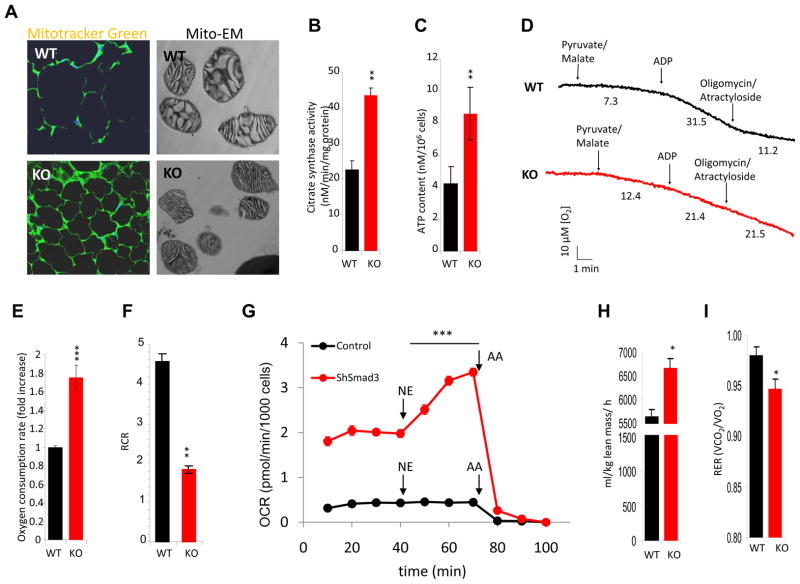
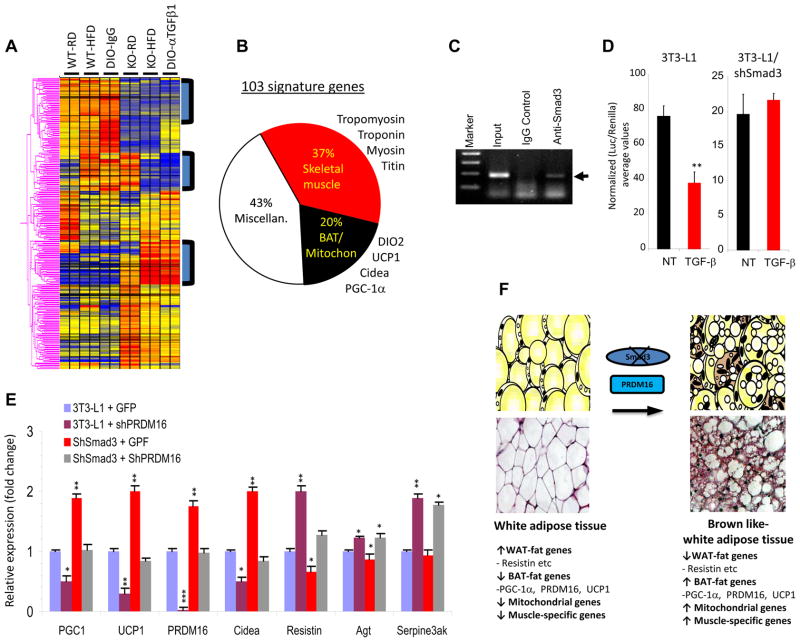
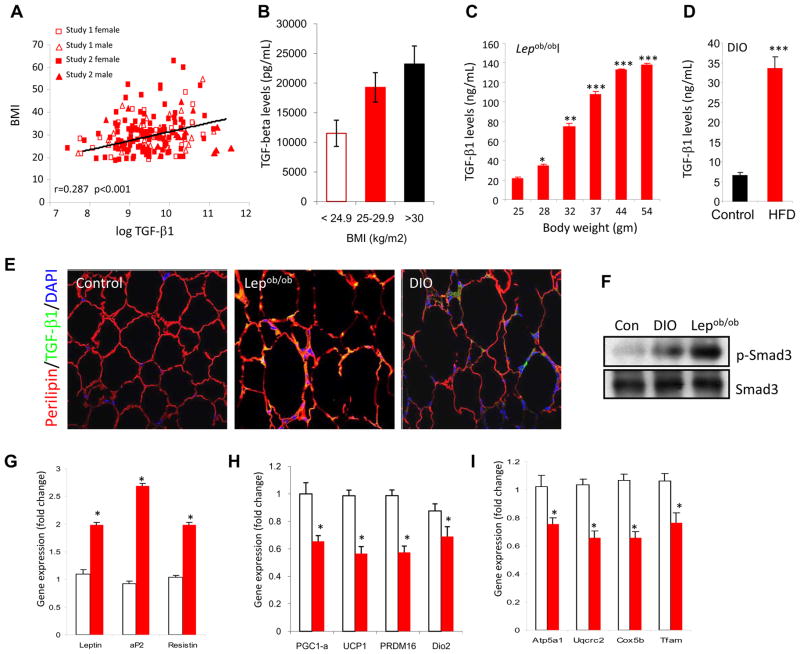
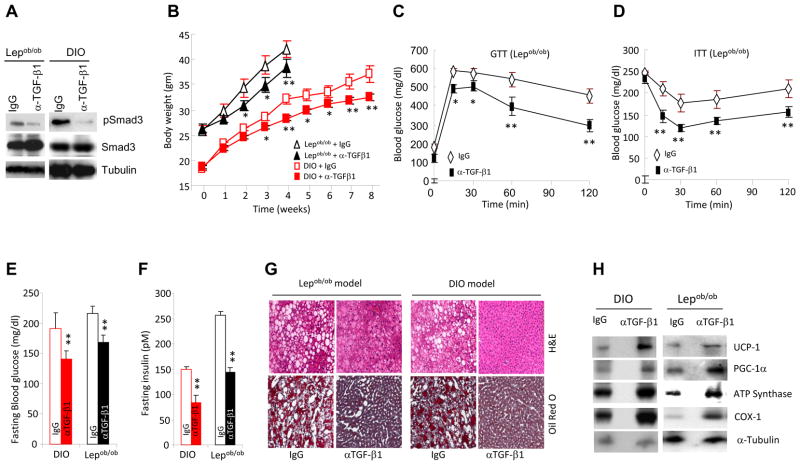
Imbalances in glucose and energy homeostasis are at the core of the worldwide epidemic of obesity and diabetes. Here, we illustrate an important role of the TGF-β/Smad3 signaling pathway in regulating glucose and energy homeostasis. Smad3-deficient mice are protected from diet-induced obesity and diabetes. Interestingly, the metabolic protection is accompanied by Smad3(-)(/-) white adipose tissue acquiring the bioenergetic and gene expression profile of brown fat/skeletal muscle. Smad3(-/-) adipocytes demonstrate a marked increase in mitochondrial biogenesis, with a corresponding increase in basal respiration, and Smad3 acts as a repressor of PGC-1α expression. We observe significant correlation between TGF-β1 levels and adiposity in rodents and humans. Further, systemic blockade of TGF-β signaling protects mice from obesity, diabetes, and hepatic steatosis. Together, these results demonstrate that TGF-β signaling regulates glucose tolerance and energy homeostasis and suggest that modulation of TGF-β activity might be an effective treatment strategy for obesity and diabetes.


Figures

Figure 1
Figure 1. Smad3 loss protects from diet induced obesity, insulin resistance and hepatic steatosis
a–c, Increased glucose infusion rate (a), whole body glucose uptake (b), and WAT glucose uptake (c) in Smad3−/− mice (KO), compared with Smad3+/+ mice (WT). d–f, Lower body weight gain (d), improved glucose (e) and insulin (f) tolerance in KO mice fed either a regular diet (RD; open red symbols) or high-fat diet, (HFD; closed red symbols) compared to WT mice fed a RD (open black symbols) or HFD (closed black symbols). g, h, HFD fed KO mice showed significantly lower glucose (g) and insulin (h) levels compared to WT mice fed a HFD. i, Enhanced insulin receptor signaling activity in Smad3−/− WAT. j, HFD fed Smad3−/− mice, but not HFD-fed Smad3+/+ mice, are resistant to hepatic steatosis. *, p < 0.05; **, p< 0.005; ***, p<0.001.
Figure 2
Figure 2. Smad3 deficiency suppresses white adipose tissue differentiation
a, WT and KO mice intake similar caloric energy as monitored by weekly food intake. b, c, RD-fed or HFD-fed KO mice, harbor reduced fat mass (b) and triglyceride levels (c). d, e, KO adipocytes (red) on a RD (open symbols) or HFD (closed symbols) maintain smaller size compared to WT adipocytes (black). f, g, KO mice fed RD or HFD exhibit significantly reduced levels of inflammatory M1-macrophage specific transcripts (f) and increased levels of protective M2-macrophage specific transcripts (g). *p < 0.05; **, p< 0.005; ***, p<0.001.
Figure 3
Figure 3. Smad3 loss induces white fat to brown fat phenotypic transition
a, RD-fed or HFD-fed Smad3−/− mice harbor reduced fat mass and smaller adipocytes.. b, UCP1 expression in KO WAT (arrows). c, KO WAT displays enhanced expression of BAT-specific genes. d, KO WAT displays increased expression of BAT/mitochondrial specific proteins and reduced expression of WAT-specific proteins. e, f, KO mice exhibit significant elevation in body temperature during day and night (active) conditions (e), and defend against extended cold exposure (f). g, KO mice exhibit enhanced fatty acid oxidation in their primary adipocytes. *p < 0.05; **, p< 0.005; ***, p<0.001.
Figure 4
Figure 4. Smad3 loss promotes mitochondrial biogenesis and function in WAT
a, Mito-Tracker Green fluorescence in adipocytes and electron microscopy in WAT mitochondria (Mito-EM). KO adipocytes exhibit significantly elevated citrate synthase activity (b) and ATP content (c). d, Representative oxygen consumption by mitochondria isolated from WAT in the presence of pyruvate/malate, ADP and the inhibitors oligomycin and actractyloside. The oxygen consumption rate (nmol/min/mg prot) is shown below the trace after the addition of the mentioned substrates and inhibitors. e, KO primary adipocytes exhibit significantly increased oxygen consumption. The fold differences in oxygen consumption are derived from the calculated slope of oxygen utilization. f, Respiratory control ratio (State3/State4; RCR) of isolated WAT mitochondria demonstrating increased mitochondrial uncoupling, as evident by a lower RCR, in KO tissue (n=4 separate mitochondrial preparations per genotype). g, Oxygen consumption rate (OCR) is increased in intact ShSmad3 lentivirus infected 3T3-L1 cells in basal conditions and further enhanced by the addition of 1 μM norepinephrine (NE). NE does not affect OCR in control cells. The addition of complex III inhibitor, antimycin A (AA), inhibits respiration in both cells. For basal OCR versus OCR after NE addition, Control versus ShSmad3 p<0.001 for all measurements. h, i, Resting oxygen consumption at 20°C (h) and respiratory exchange ratio (i) in 3-month old female Smad3+/+ (WT) and Smad3−/− (KO) mice fed chow diet. *p < 0.05; **, p< 0.005; ***, p<0.001.
Figure 5
Figure 5. Smad3 regulates the PGC-1α promoter and PRDM16 target genes
a, Representative heat-map of microarray analyses of WAT from RD or HFD fed WT and KO mice and from diet-induced obese (DIO) mice treated with control IgG or anti-TGF-β1 (α-TGF-β1) antibody. b, Pie-chart classification of “103 signature genes” (represented in the three boxed areas of the heat map) in WAT from RD or HFD-fed KO mice and from DIO mice treated with α-TGF-β antibody, compared to RD or HFD fed WT mice and from DIO mice treated with control IgG, respectively. c, ChIP assays show binding of Smad3 (arrowhead) to the PGC-1α promoter in 3T3-L1 cells. Input and IgG antibody control is shown. d, TGF-β suppresses the PGC-1α-luciferase reporter in 3T3-L1 cells, but not in 3T3-L1 cells expressing shSmad3 lentivirus. e, Smad3 regulates PRDM16 target genes. Control 3T3-L1 cells were infected with lentiviruses expressing GFP (3T3-L1GFP), shPRDM16 (3t3-Li+shPRDM16), shSmad3 (shSmad3+GFP) or shSmad3 and ShPRDM16 together (shSmad3+shPRDM16) followed by real time RT-PCR. Fold change in expression relative to 18S is shown. f, Proposed model for WAT to BAT phenotypic conversion upon loss of Smad3 signaling. Loss of Smad3 leads to enhanced expression of BAT/mitochondrial/muscle-specific transcripts along with reduced expression of WAT-specific genes. The appearance of UCP1+ brown adipocytes in the WAT milieu is promoted by PRDM16. *p < 0.05; **, p< 0.005; ***, p<0.001.
Figure 6
Figure 6. Elevated TGF-β1 level correlates with adiposity and exogenous TGF-β1 suppresses BAT/mitochondrial markers in WAT
a, b, Plasma TGF-β1 levels in human subjects significantly correlate positively with BM1 (a) and increased TGF-β1 levels are seen in overweight and obese subjects, compared to that seen in subjects with normal BMI (b). c, d, Levels of active TGF-β1 were determined by ELISA in serum samples from Lepob/ob mice as a function of their weight gain (c) and in C57Bl/6J mice fed either a RD (control) or HFD for 8 weeks (d). e, Elevated active TGF-β1 (green) staining in perilipin (red) expressing white adipocytes in WAT from Lepob/ob and DIO mice, but not in WAT derived from regular diet fed normal mice (Control). DAPI staining identifies nuclei. f, Elevated phosphorylated Smad3 in WAT protein extracts from Lepob/ob (n=4) and DIO (n=4) mice, but not in WAT derived from regular diet fed normal mice (Con; n=3). Total Smad3 levels are shown in bottom panel. g–i, Compared to vehicle PBS injected mice (open bars), mice injected with TGF-β1 (closed red bars) exhibit elevated WAT-specific transcripts (g) and reduced BAT-specific (h) and mitochondrial-specific transcripts (i). *p < 0.05; **, p< 0.005; ***, p<0.001.
Figure 7
Figure 7. Anti-TGF-β1 antibody protects Lepob/ob and DIO mice from obesity and diabetes
a, Reduced phosphorylated Smad3 in WAT protein extracts from Lepob/ob (n=3) and DIO (n=3) mice treated with anti-TGF-β1 (α-TGF-β1) antibody. b–h, Treatment with anti-TGF-β1 (α-TGF-β1) antibody resulted in significantly reduced body weight gain, improved GTT (c), enhanced ITT (d), significantly reduced fasting blood glucose (e) and fasting insulin levels (f), suppression of hepatic steatosis (g), and elevated expression of BAT/mitochondrial-specific proteins in WAT (h). *p < 0.05; **, p< 0.005; ***, p<0.001.

Comment in

References

    1. Alessi MC, Bastelica D, Morange P, Berthet B, Leduc I, Verdier M, Geel O, Juhan-Vague I. Plasminogen activator inhibitor 1, transforming growth factor-beta1, and BMI are closely associated in human adipose tissue during morbid obesity. Diabetes. 2000;49:1374–1380. - PubMed
    1. Atit R, Sgaier SK, Mohamed OA, Taketo MM, Dufort D, Joyner AL, Niswander L, Conlon RA. Beta-catenin activation is necessary and sufficient to specify the dorsal dermal fate in the mouse. Developmental biology. 2006;296:164–176. - PubMed
    1. Cannon B, Nedergaard J. Brown adipose tissue: function and physiological significance. Physiological reviews. 2004;84:277–359. - PubMed
    1. Cannon B, Nedergaard J. Nonshivering thermogenesis and its adequate measurement in metabolic studies. The Journal of experimental biology. 2011;214:242–253. - PubMed
    1. Choy L, Derynck R. Transforming growth factor-beta inhibits adipocyte differentiation by Smad3 interacting with CCAAT/enhancer-binding protein (C/EBP) and repressing C/EBP transactivation function. The Journal of biological chemistry. 2003;278:9609–9619. - PubMed

Publication types

MeSH terms

Associated data