

Reference-free cell mixture adjustments in analysis of DNA methylation data
- PMID: 24451622
- PMCID: PMC4016702
- DOI: 10.1093/bioinformatics/btu029
Reference-free cell mixture adjustments in analysis of DNA methylation data
Abstract
Motivation: Recently there has been increasing interest in the effects of cell mixture on the measurement of DNA methylation, specifically the extent to which small perturbations in cell mixture proportions can register as changes in DNA methylation. A recently published set of statistical methods exploits this association to infer changes in cell mixture proportions, and these methods are presently being applied to adjust for cell mixture effect in the context of epigenome-wide association studies. However, these adjustments require the existence of reference datasets, which may be laborious or expensive to collect. For some tissues such as placenta, saliva, adipose or tumor tissue, the relevant underlying cell types may not be known.
Results: We propose a method for conducting epigenome-wide association studies analysis when a reference dataset is unavailable, including a bootstrap method for estimating standard errors. We demonstrate via simulation study and several real data analyses that our proposed method can perform as well as or better than methods that make explicit use of reference datasets. In particular, it may adjust for detailed cell type differences that may be unavailable even in existing reference datasets.
Availability and implementation: Software is available in the R package RefFreeEWAS. Data for three of four examples were obtained from Gene Expression Omnibus (GEO), accession numbers GSE37008, GSE42861 and GSE30601, while reference data were obtained from GEO accession number GSE39981.
Contact: andres.houseman@oregonstate.edu
Supplementary information: Supplementary data are available at Bioinformatics online.
Figures
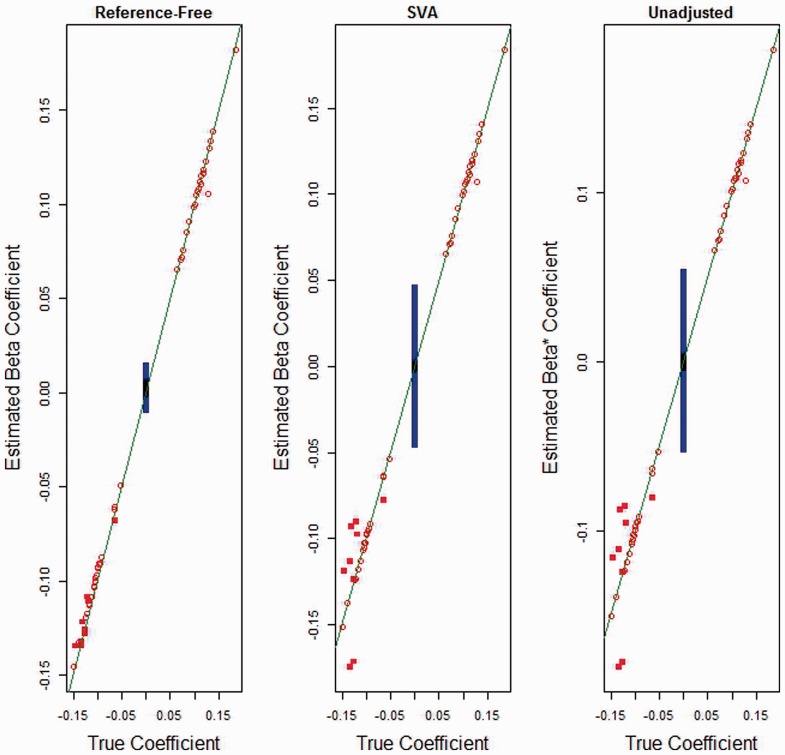
 ) versus its estimate (
 ), true direct effect versus the SVA-adjusted estimate and true direct effect (
 ) versus the unadjusted effect (
 ). Squares indicate DMRs. Red indicates non-null CpGs. Black squares represent non-null DMRs
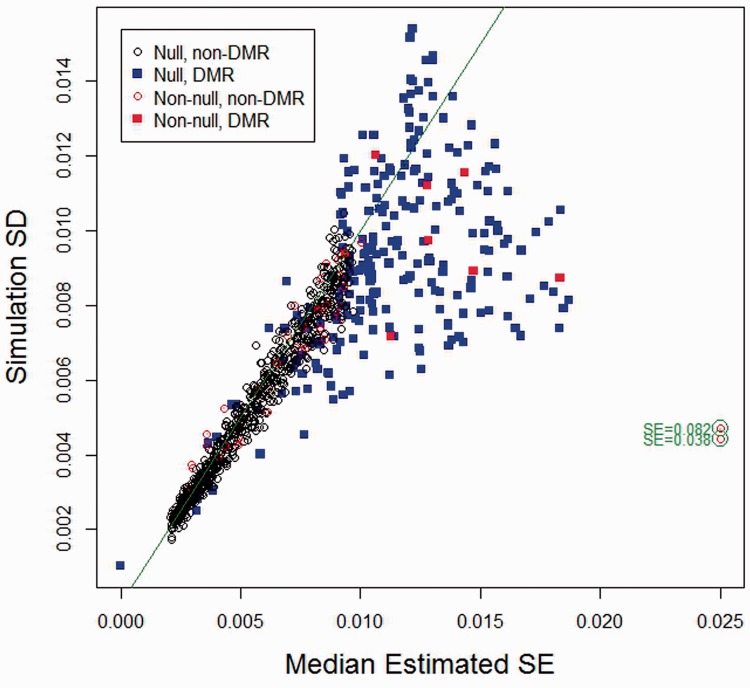
 . To increase legibility of the plot, SE estimates for two CpGs producing extreme bias have been moved to the left, as indicated
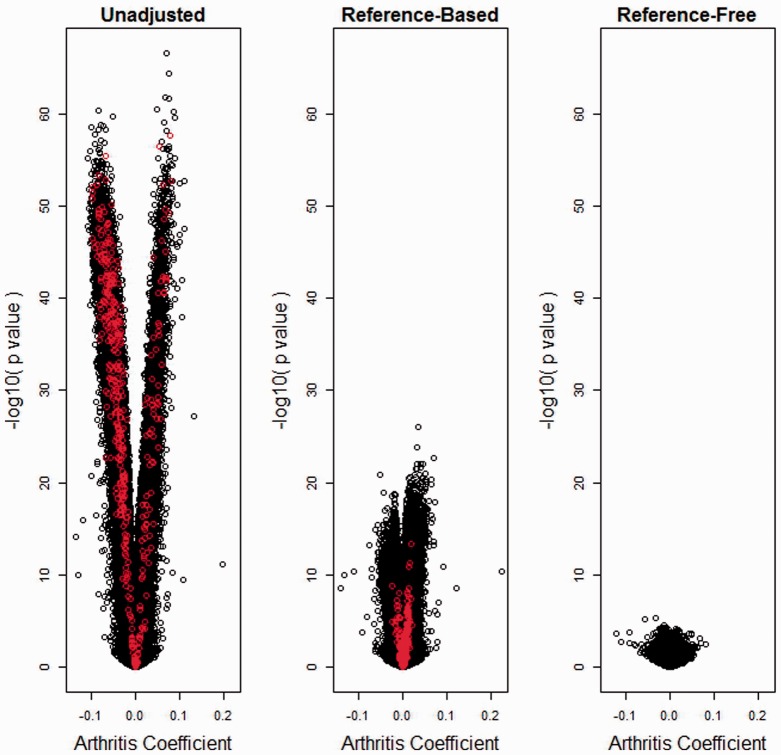
 unadjusted for leukocyte composition, adjusted using the reference-based method that adjusts for six estimated cell type proportions and adjusted using the proposed reference-free method with d = 20. Red indicates 387 leukocyte DMRs (overlap between 450K array and 500 CpGs published by Houseman et al., 2012)
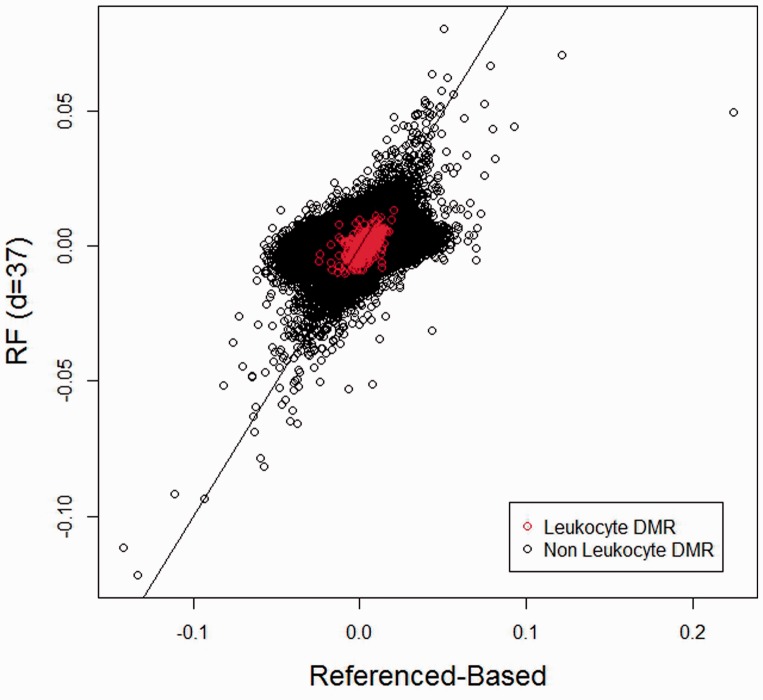
 with the corresponding reference-based estimates
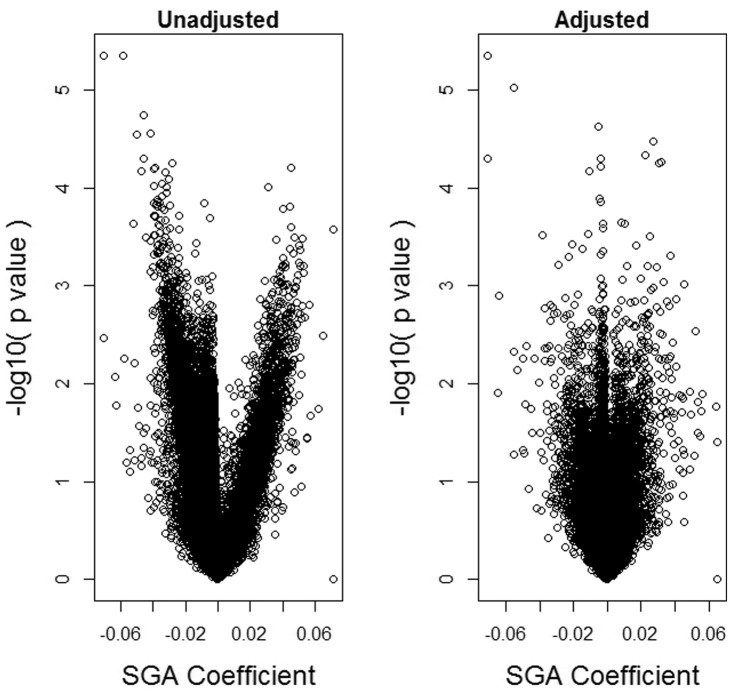
 unadjusted for leukocyte composition and adjusted using the proposed reference-free method with d = 12
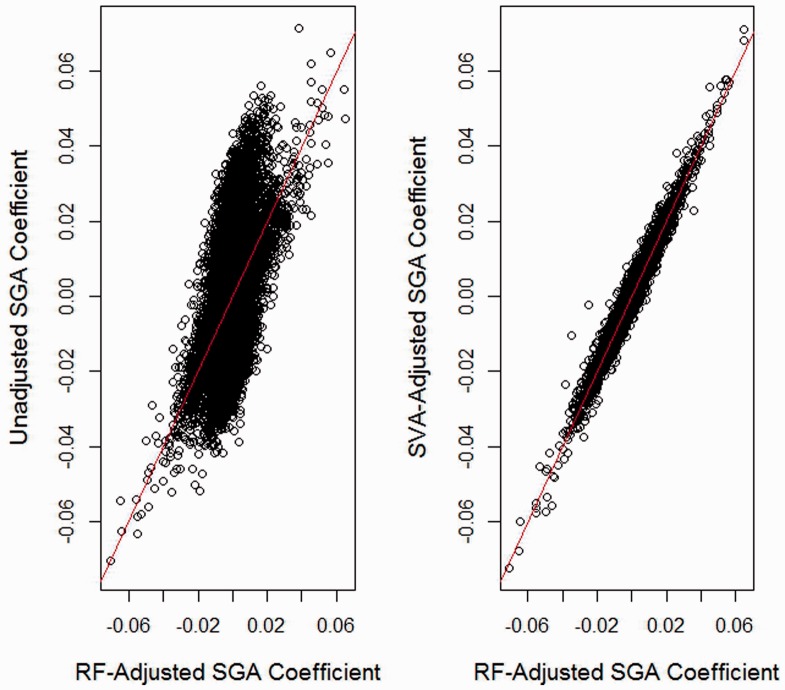
 with the corresponding unadjusted and SVA-adjusted estimates
References
Publication types
MeSH terms
Associated data
- Actions
- Actions
- Actions
- Actions
Grants and funding
LinkOut - more resources
Full Text Sources
Other Literature Sources
