. 2011 Nov 11;147(4):789-802.
doi: 10.1016/j.cell.2011.10.002. Epub 2011 Nov 3.

Ribosome profiling of mouse embryonic stem cells reveals the complexity and dynamics of mammalian proteomes

Affiliations

Ribosome profiling of mouse embryonic stem cells reveals the complexity and dynamics of mammalian proteomes

Nicholas T Ingolia et al. Cell. .

Abstract

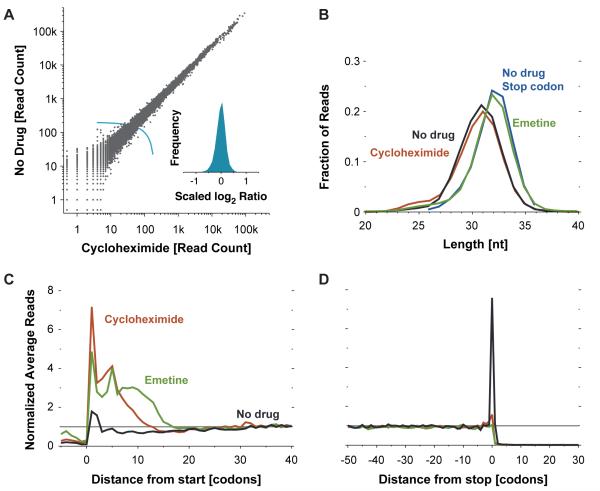
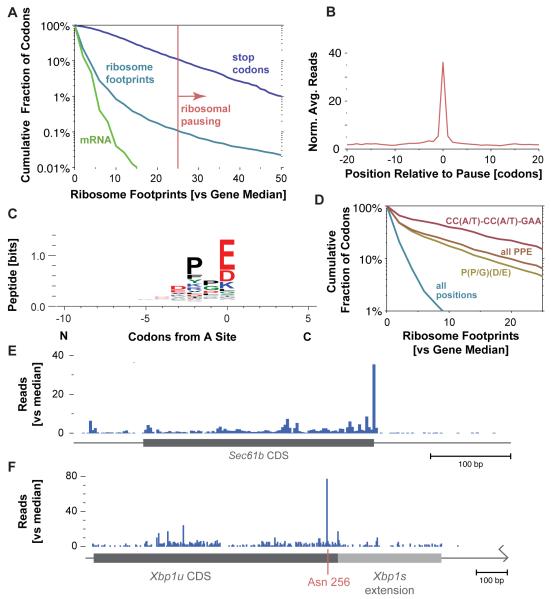
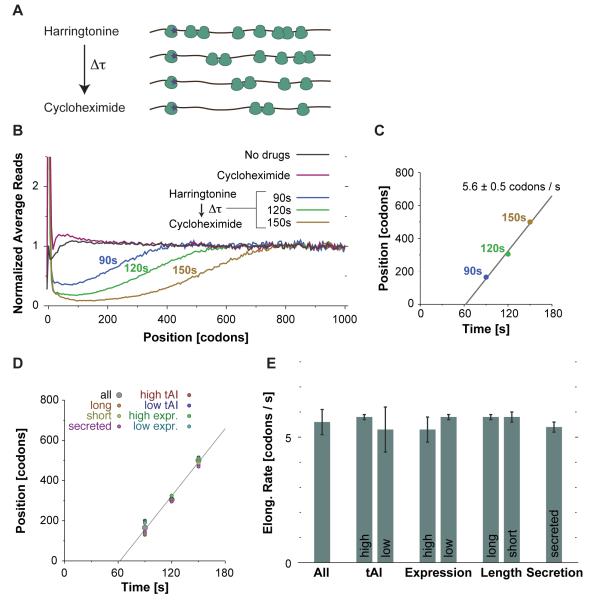
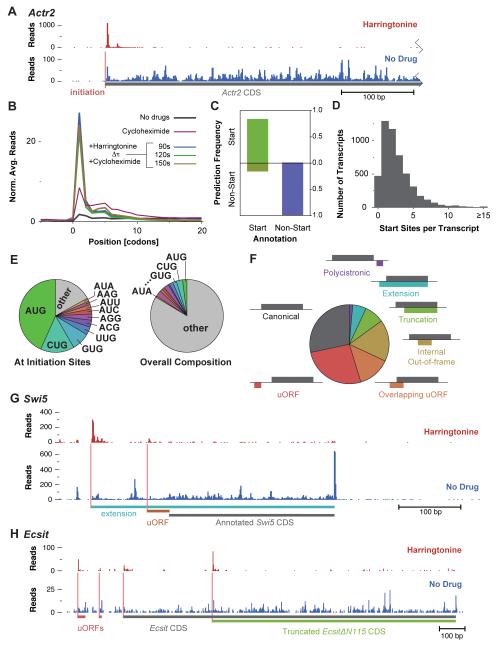
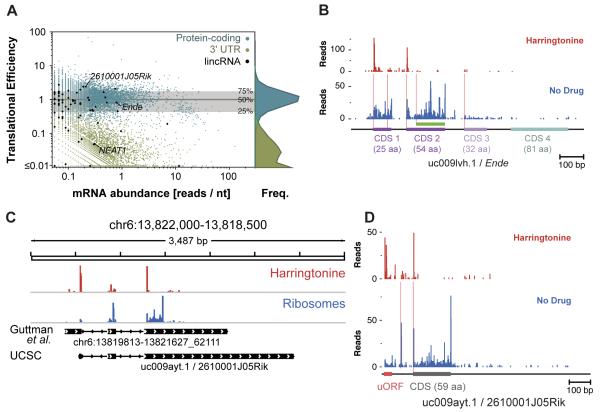
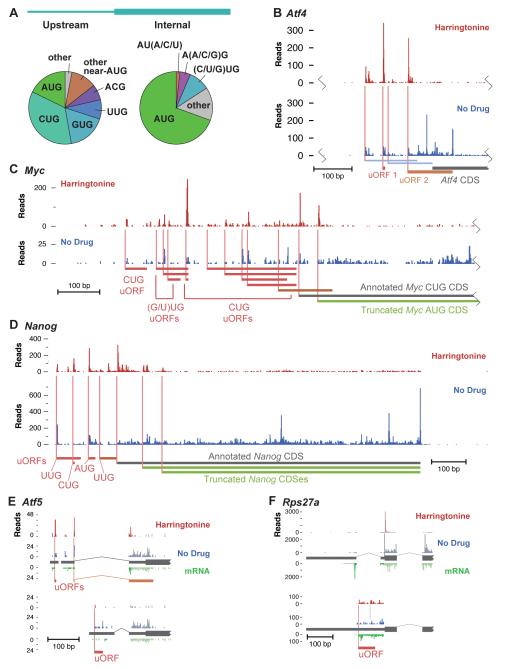
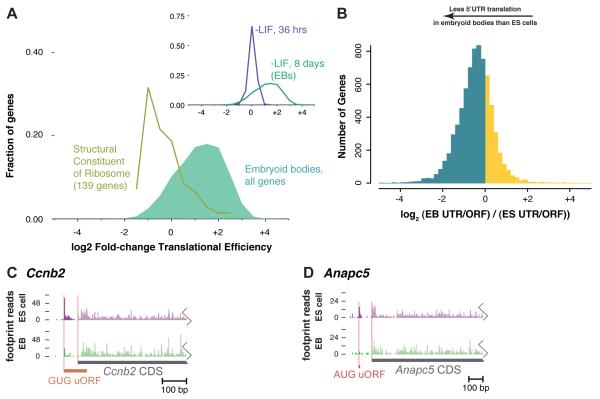
The ability to sequence genomes has far outstripped approaches for deciphering the information they encode. Here we present a suite of techniques, based on ribosome profiling (the deep sequencing of ribosome-protected mRNA fragments), to provide genome-wide maps of protein synthesis as well as a pulse-chase strategy for determining rates of translation elongation. We exploit the propensity of harringtonine to cause ribosomes to accumulate at sites of translation initiation together with a machine learning algorithm to define protein products systematically. Analysis of translation in mouse embryonic stem cells reveals thousands of strong pause sites and unannotated translation products. These include amino-terminal extensions and truncations and upstream open reading frames with regulatory potential, initiated at both AUG and non-AUG codons, whose translation changes after differentiation. We also define a class of short, polycistronic ribosome-associated coding RNAs (sprcRNAs) that encode small proteins. Our studies reveal an unanticipated complexity to mammalian proteomes.


Figures

Figure 1
Figure 1
Ribosome Profiling in Mouse Embryonic Stem Cells (A) Effect of elongation inhibitors on ribosome density. The number of ribosome footprint reads that align to the body of each coding sequence (Methods) is plotted for cells that were either untreated or pretreated with cycloheximide (Spearman r = 0.99). The inset shows a histogram of log2 ratios for genes with at least 200 total reads (the threshold shown by the light blue line) normalized by the median ratio (N = 10045, s.d. = 0.20, corresponding to 15 percent difference in measurements). (B) Ribosome-protected fragment lengths. Plotted is the length distribution of ribosome footprints over the body of messages prepared from cells treated as indicated, as well as for footprints centered on the stop codon for the untreated cells. (C) Metagene analysis of translation initiation. Average ribosome read density profiles over 4994 well-expressed genes (Table S1), aligned at their start codon, are shown for untreated and drug-treated samples. (D) Metagene analysis of translation termination. As in (C) but alignment was from stop codons.
Figure 2
Figure 2
Analysis of Translational Stall Sites (A) Distribution of per-codon ribosome footprint counts. The cumulative distribution of footprint counts at each codon, relative to the median density across the gene, is plotted and the 25× median threshold used to identify ribosomal stall sites is indicated. The distribution of density at stop codons, which are excluded from the overall distribution, is shown as well, along with the read densities in randomly-fragmented mRNA, which controls for library generation. (B) Metagene analysis of translational stalling. Ribosome footprint densities were averaged after aligning gene density profiles at internal translational stall positions (Table S2B). (C) Peptide motif associated with internal translational stalling. (D) Ribosome footprints over peptide motif enriched in stall sites. The cumulative distribution of relative ribosome footprint counts for the all Pro-Pro-Glu sites and for those encoded by CC(A/T)-CC(A/T)-GAA are shown along with the more lenient Pro-(Pro/Gly)-(Asp/Glu) sites and the overall data from (A). (E) Ribosome footprint profile on the Sec61b transcript (median 22.5 footprints per codon). (F) Ribosome footprint profile on the Xbp1 transcript (median 1.0 footprint per codon). Xbp1 undergoes a nonconventional splicing event (Calfon et al., 2002). The unspliced (Xbp1u) coding sequence is indicated, along with the site of translational stalling at Asn 256 and the extended coding sequence in the spliced (Xbp1s) message.
Figure 3
Figure 3
A Pulse-chase Strategy for Measuring Translation Elongation Rates (A) Schematic of the in vivo run-off elongation experiment. (B) Metagene analysis of run-off elongation. Ribosome read density was averaged across 5-codon windows for samples prepared with the indicated drug treatments. (C) Rate of ribosome depletion. The codon position of 50% ribosome depletion is plotted as a function of harringtonine treatment time. Linear fit is x(t) = ax + b, a = 5.6 ± 0.5 codons / s, b = −347 ± 65 codons, r.m.s.d. 22.5. (D) Ribosome depletion on subsets of genes. Data from (C) is plotted, along with comparable measurements made from the indicated gene subsets. (E) Elongation rates on subsets of genes. Elongation rates, inferred from linear fit as described in (C), are plotted along with the standard error of the regressed coefficient.
Figure 4
Figure 4
Harringtonine Enables Automated Identification of Translation Initiation Sites. (A) Effect of harringtonine on ribosome density for a typical gene. Ribosome footprint read count is shown prior to and following harringtonine treatment (150 s) along the 5′ UTR and the beginning of the coding sequence of Actr2. (B) Metagene analysis of ribosome footprints surrounding start codons after harringtonine treatment. As in Figure 3B, focusing specifically on the site of translation initiation and the surrounding codons. (C) Evaluation of start site prediction analysis. Plotted is the fraction of positive and negative initiation site predictions for start and selected non-start codons that were excluded from the training set. (D) Histogram of initiation sites predicted per transcript. (E) Distribution of AUG codons and near-AUG codons at predicted sites of translation initiation (left), compared with the overall codon distribution (right). (F) Classification of reading frames at predicted initiation sites relative to the annotated CDS. (G) Pattern of initiation and translation on the Swi5 transcript. As in Figure 4A, with the two detected initiation sites shown along with the respective reading frames, one of which produces a conserved amino-terminal extension on the Swi5 protein. (H) Pattern of initiation and translation on the Ecsit transcript. Four AUG initiation sites are present, two associated with uORFs and two with alternate protein isoforms of Ecsit.
Figure 5
Figure 5
Translation of sprcRNAs (A) Translational efficiency of putative lincRNAs. The translational efficiency, a normalized ratio of ribosome footprint density to mRNA-seq read density, is plotted for the most highly occupied 90 nt window of each lincRNA, protein-coding gene, and coding transcript 3′ UTR, along with a histogram of translational efficiency values for CDSes and 3′UTRs and the median and quartile values for protein-coding genes. (B) Ribosome footprint profile of the uc009lvh.1 transcript. This RNA is annotated as a non-coding RNA, but we identify two short (25 and 54 amino acids) well-translated ORFs, and see little translation from a longer (81 amino acid) downstream CDS hypothesized to encode a protein (Hassan et al., 2010). (C) Ribosome footprint profile of the 2610001J05Rik genomic locus. The profile includes transcript-aligned reads mapped to corresponding genomic positions and genomic-aligned reads with no transcript alignment. The annotated non-coding uc009ayt.1 transcript is shown along with the reconstructed transcript (Guttman et al., 2010). (D) Ribosome footprint profile of the uc009ayt.1 transcript.
Figure 6
Figure 6
Translation of Regulatory uORFs and Alternatively Processed Transcripts (A) Codon distribution at upstream (left) and internal (right) translation initiation sites. Internal sites are only taken from codons 15 through 300, as internal sites further downstream are affected by incomplete ribosome run-off during short harringtonine treatment. (B) Patterns of initiation and translation on the Atf4 transcript. The two characterized regulatory uORFs, initiated by AUG codons, are highlighted. Two weak non-AUG reading frames are shown in blue. (C) As in (B) on the Myc transcript. Several near-cognate sites of upstream initiation are shown, along with the annotated CUG initiation codon and the alternate AUG initiation codon. (D) As in (C) on the Nanog transcript. Upstream open reading frames are shown, along with the CDS and two in-frame AUG initiation sites within the CDS. (E) Patterns of initiation and translation on the 5′ end of two transcripts of the Atf5 gene. The exon structure is shown with thin gray rectangles for the 5′ UTR and thick gray rectangles for the annotated coding sequence. An mRNA-seq read profile is shown on an inverted y axis. Isoform-specific transcript positions are shown in dark colors and non-isoform-specific positions are shown with faint colors. The major isoform (top) has two uORFs that confer translational regulation on the coding sequence; a distinct uORF is observed in the minor embryonic isoform (bottom). (F) As (E), for the 5′ end of the Rpl27a transcripts. Only the isoform-specific positions are shown for the minor isoform (bottom), scaled 10x.
Figure 7
Figure 7
Changes in Upstream Translation During Differentiation (A) Translational regulation following LIF withdrawal. The distribution of log2 fold-changes of translational efficiency (ratio of sample-normalized ribosome footprint density to mRNA-seq density) is shown for all genes and for those with the GO annotation “structural constituent of ribosome” (see Table S5D). Inset: distributions for all genes, 36 hours and 8 days after LIF withdrawal (see Tables S5A and S5D). (B) Changes in relative upstream translation in EBs versus ES cells. The ratio of footprints between the 5′UTR and the ORF was computed for each gene and the distribution of log2 change in the 5′UTR/ORF ratio is plotted, with decreases in EB shown in blue and increases in EB shown in yellow. (C-D) Patterns of translation on the Ccnb5 (C) and Anapc5 (D) transcripts. Ribosome footprints that map to the 5′UTR are in dark colors and the CDS in faint colors. The average, sample-normalized ribosome footprint density on the CDS is slightly higher in the EB sample than the ES cell sample for both.

References

    1. Akamatsu Y, Jasin M. Role for the mammalian Swi5-Sfr1 complex in DNA strand break repair through homologous recombination. PLoS Genet. 2010;6:e1001160. - PMC - PubMed
    1. Alkalaeva EZ, Pisarev AV, Frolova LY, Kisselev LL, Pestova TV. In vitro reconstitution of eukaryotic translation reveals cooperativity between release factors eRF1 and eRF3. Cell. 2006;125:1125–1136. - PubMed
    1. Arava Y, Wang Y, Storey JD, Liu CL, Brown PO, Herschlag D. Genome-wide analysis of mRNA translation profiles in Saccharomyces cerevisiae. Proc Natl Acad Sci U S A. 2003;100:3889–3894. - PMC - PubMed
    1. Atkins JF, Gesteland RF. Recoding: expansion of decoding rules enriches gene expression. New York, Springer: 2010.
    1. Bentley DR, Balasubramanian S, Swerdlow HP, Smith GP, Milton J, Brown CG, Hall KP, Evers DJ, Barnes CL, Bignell HR, et al. Accurate whole human genome sequencing using reversible terminator chemistry. Nature. 2008;456:53–59. - PMC - PubMed

Publication types

Associated data