. 2024 May;14(5):e1680.
doi: 10.1002/ctm2.1680.

Targeting c-Myc transactivation by LMNA inhibits tRNA processing essential for malate-aspartate shuttle and tumour progression

Affiliations

Targeting c-Myc transactivation by LMNA inhibits tRNA processing essential for malate-aspartate shuttle and tumour progression

Jianqun Wang et al. Clin Transl Med. 2024 May.

Abstract

Background: A series of studies have demonstrated the emerging involvement of transfer RNA (tRNA) processing during the progression of tumours. Nevertheless, the roles and regulating mechanisms of tRNA processing genes in neuroblastoma (NB), the prevalent malignant tumour outside the brain in children, are yet unknown.

Methods: Analysis of multi-omics results was conducted to identify crucial regulators of downstream tRNA processing genes. Co-immunoprecipitation and mass spectrometry methods were utilised to measure interaction between proteins. The impact of transcriptional regulators on expression of downstream genes was measured by dual-luciferase reporter, chromatin immunoprecipitation, western blotting and real-time quantitative reverse transcription-polymerase chain reaction (RT-PCR) methods. Studies have been conducted to reveal impact and mechanisms of transcriptional regulators on biological processes of NB. Survival differences were analysed using the log-rank test.

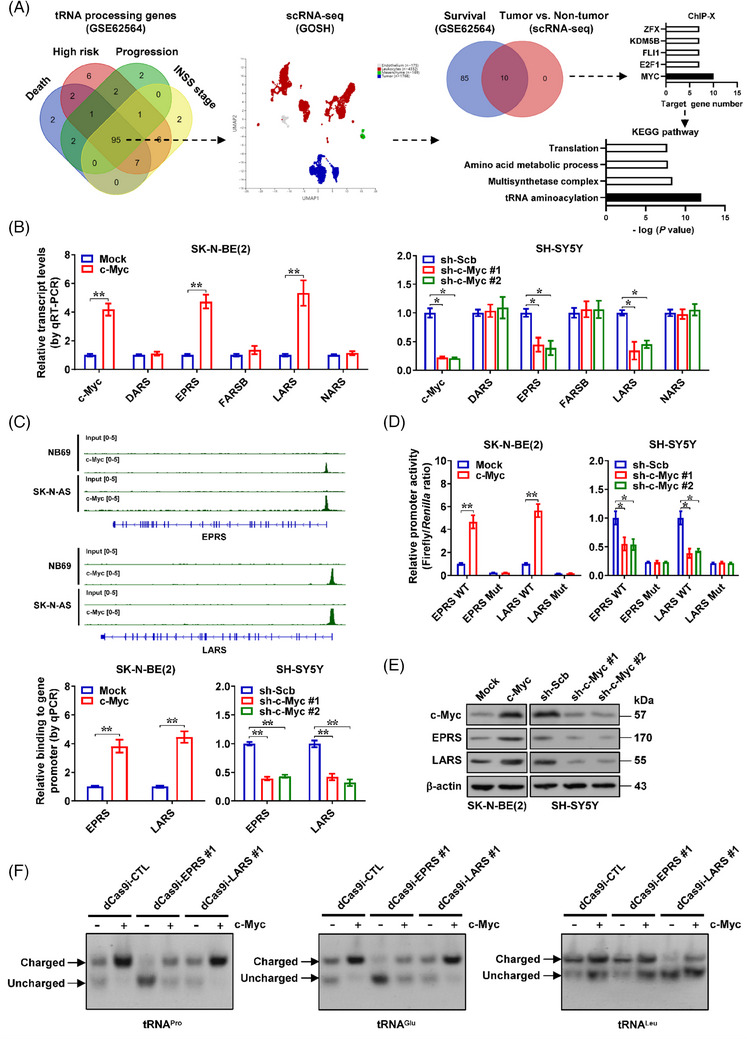
Results: c-Myc was identified as a transcription factor driving tRNA processing gene expression and subsequent malate-aspartate shuttle (MAS) in NB cells. Mechanistically, c-Myc directly promoted the expression of glutamyl-prolyl-tRNA synthetase (EPRS) and leucyl-tRNA synthetase (LARS), resulting in translational up-regulation of glutamic-oxaloacetic transaminase 1 (GOT1) as well as malate dehydrogenase 1 (MDH1) via inhibiting general control nonrepressed 2 or activating mechanistic target of rapamycin signalling. Meanwhile, lamin A (LMNA) inhibited c-Myc transactivation via physical interaction, leading to suppression of MAS, aerobic glycolysis, tumourigenesis and aggressiveness. Pre-clinically, lobeline was discovered as a LMNA-binding compound to facilitate its interaction with c-Myc, which inhibited aminoacyl-tRNA synthetase expression, MAS and tumour progression of NB, as well as growth of organoid derived from c-Myc knock-in mice. Low levels of LMNA or elevated expression of c-Myc, EPRS, LARS, GOT1 or MDH1 were linked to a worse outcome and a shorter survival time of clinical NB patients.

Conclusions: These results suggest that targeting c-Myc transactivation by LMNA inhibits tRNA processing essential for MAS and tumour progression.

Keywords: c‐Myc; lamin A; malate‐aspartate shuttle; neuroblastoma; transfer RNA processing; tumour progression.


Conflict of interest statement

The authors declare they have no conflicts of interest.

Figures

FIGURE 1
FIGURE 1
Identification of c‐Myc as a transcription factor regulating transfer RNA (tRNA) processing genes in neuroblastoma (NB). (A) Venn diagram (left and right panels) and U‐map of single‐cell RNA sequencing (scRNA‐seq) results (middle panel) revealing the identification of tumour cell‐abundant tRNA processing genes differentially expressed in 498 NB cases (GSE62564) with various status of death, risk, clinical progression and international neuroblastoma staging system (INSS) stages. ChIP‐X program (right upper panel) and Kyoto Encyclopedia of Genes and Genomes (KEGG) pathway (right lower panel) analyses showing the potential transcription factors regulating tRNA processing genes, and their involvement in biological process. (B) Real‐time quantitative RT‐PCR (qRT‐PCR) assay revealing the transcript levels of c‐Myc and tRNA processing genes (normalised to β‐actin) in SK‐N‐BE(2) and SH‐SY5Y cells stably transfected with empty vector (mock), c‐Myc, scramble shRNA (sh‐Scb) or sh‐c‐Myc (= 5). (C) Chromatin immunoprecipitation sequencing (ChIP‐seq) (GSE138295), ChIP and quantitative PCR (qPCR) assays showing the enrichment of c‐Myc (normalised to input DNA) on promoter region of EPRS and LARS in NB cells or those stably transfected with mock, c‐Myc, sh‐Scb or sh‐c‐Myc (= 5). (D) Dual‐luciferase assay using reporters with wild‐type (WT) or mutant (Mut) c‐Myc binding site indicating the promoter activity of EPRS and LARS in SK‐N‐BE(2) and SH‐SY5Y cells stably transfected with mock, c‐Myc, sh‐Scb or sh‐c‐Myc (= 5). (E) Western blot assay revealing the protein levels of c‐Myc, EPRS and LARS in SK‐N‐BE(2) and SH‐SY5Y cells stably transfected with mock, c‐Myc, sh‐Scb or sh‐c‐Myc (= 5). (F) Northern blot assay showing the aminoacylation of tRNAPro, tRNAGlu and tRNALeu in SK‐N‐BE(2) cells stably transfected with mock or c‐Myc, and those co‐transfected with dCas9i control (dCas9i‐CTL), dCas9i‐EPRS #1 or dCas9i‐LARS #1. Fisher's exact test for overlapping analysis in (A). Student's t‐test and analysis of variance (ANOVA) compared the difference in (B‒D). * p < .05, ** p < .01. Data are shown as mean ± standard error of the mean (s.e.m.) (error bars) or representative of three independent experiments in (B‒F).
FIGURE 2
FIGURE 2
EPRS and LARS facilitate malate‐aspartate shuttle (MAS) protein expression, tumourigenesis and aggressiveness of neuroblastoma (NB) cells. (A) Puromycin incorporation and western blot assays indicating nascent protein synthesis levels in SH‐SY5Y cells stably transfected with dCas9i control (dCas9i‐CTL), dCas9i‐EPRS or dCas9i‐LARS, and those treated with L‐proline (Pro, 3 mM), glutamate (Glu, 1 mM) or leucine (Leu, 10 mM). (B) Venn diagram (upper panel) showing identification of EPRS‐ and LARS‐correlated MAS proteins derived from DepMap database (https://depmap.org/portal), and those associated with survival of 498 NB cases (GSE62564). Western blot and real‐time quantitative RT‐PCR (qRT‐PCR) assays (normalised to β‐actin, lower panels) indicating levels of EPRS, LARS, glutamic‐oxaloacetic transaminase 1 (GOT1), GOT2, malate dehydrogenase 1 (MDH1) and MDH2 in SH‐SY5Y cells stably transfected with dCas9i‐CTL, dCas9i‐EPRS or dCas9i‐LARS. (C) Western blot assay indicating the protein levels of p‐GCN2, general control nonrepressed 2 (GCN2), ATF4, p‐mTOR, mechanistic target of rapamycin (mTOR), p‐S6K1, S6K1, p‐4EBP1, 4EBP1, GOT1 or MDH1 in SH‐SY5Y cells stably transfected with dCas9i‐CTL, dCas9i‐EPRS or dCas9i‐LARS and those treated with L‐proline (Pro, 3 mM), glutamate (Glu, 1 mM) or leucine (Leu, 10 mM). (D) RNA immunoprecipitation (RIP) and qRT‐PCR assays showing the enrichment of 4EBP1 or eIF4E on 5′‐untranslated region (5′‐UTR) of GOT1 or MDH1 in SH‐SY5Y cells stably transfected with dCas9i‐CTL, dCas9i‐EPRS or dCas9i‐LARS, and those treated with L‐proline (Pro, 3 mM), glutamate (Glu, 1 mM) or leucine (Leu, 10 mM, = 4). (E) Ribosome enrichment on GOT1 or MDH1 messenger RNA (mRNA) in SH‐SY5Y cells stably transfected with dCas9i‐CTL, dCas9i‐EPRS or dCas9i‐LARS. (F) Schematic illustration of MAS (upper left panel) and mitochondrial nicotinamide adenine dinucleotide hydrogen/nicotinamide adenine dinucleotide (NADH/NAD+) ratio (upper right panel), lactic acid generation (lower left panel) and ATP levels (lower right panel) of SH‐SY5Y and SK‐N‐AS cells stably transfected with dCas9i‐CTL, dCas9i‐EPRS or dCas9i‐LARS (= 5). Analysis of variance (ANOVA) compared the difference in (B) and (D‒F). * p < .05, ** p < .01 versus dCas9i‐CTL. Data are shown as mean ± standard error of the mean (s.e.m.) (error bars) or representative of three independent experiments in (A‒F).
FIGURE 3
FIGURE 3
c‐Myc promotes malate‐aspartate shuttle (MAS) via up‐regulating EPRS or LARS in neuroblastoma (NB). (A) Western blot assay indicating expression of EPRS and LARS in SK‐N‐BE(2) cells stably transfected with empty vector (mock) or c‐Myc, and those co‐transfected with dCas9i control (dCas9i‐CTL), dCas9i‐EPRS #1 or dCas9i‐LARS #1. (B) Relative mitochondrial and cytoplasmic nicotinamide adenine dinucleotide hydrogen (NADH) levels in SK‐N‐BE(2) cells stably transfected with mock or c‐Myc, and those co‐transfected with dCas9i‐CTL, dCas9i‐EPRS #1 or dCas9i‐LARS #1. (C) Soft agar and Matrigel invasion assays showing the anchorage‐independent growth and invasive capabilities of SK‐N‐BE(2) cells stably transfected with mock or c‐Myc, and those co‐transfected with dCas9i‐CTL, dCas9i‐EPRS #1 or dCas9i‐LARS #1. (D) 18‐Fluoro‐deoxy‐glucose (18F‐FDG) positron emission tomography‒computed tomography (PET‒CT) imaging (left panel) and standardised uptake value (SUV) quantification (right panel) showing the uptake of 18F‐labelled glucose (arrowheads) in nude mice with hypodermic xenografts formed by SK‐N‐BE(2) cells stably transfected with mock or c‐Myc, and those co‐transfected with dCas9i‐CTL, dCas9i‐EPRS #1 or dCas9i‐LARS #1 (= 3 for each group). (E) In vivo images (left panel), growth curve (middle panel) and weight at the end points (right panel) of xenografts formed by hypodermic injection of SK‐N‐BE(2) cells stably transfected with mock or c‐Myc, and those co‐transfected with dCas9i‐CTL, dCas9i‐EPRS #1 or dCas9i‐LARS #1 (= 5 for each group). (F) In vivo imaging (left panel), quantification of lung metastatic colonies (middle panel) and Kaplan‒Meier curves (right panel) of nude mice treated with tail vein injection of SK‐N‐BE(2) cells stably transfected with mock or c‐Myc, and those co‐transfected with dCas9i‐CTL, dCas9i‐EPRS #1 or dCas9i‐LARS #1 (= 4 for each group). Analysis of variance (ANOVA) compared the difference in (B‒F). Log‐rank test for survival comparison in (F). * < .05, ** < .01. Data are shown as mean ± standard error of the mean (s.e.m.) (error bars) or representative of three independent experiments in (A‒C).
FIGURE 4
FIGURE 4
Lamin A (LMNA) directly interacts with c‐Myc in neuroblastoma (NB) cells. (A) Coomassie brilliant blue staining, co‐immunoprecipitation (co‐IP) and mass spectrometry (MS) assays showing differential proteins immunoprecipitated by c‐Myc antibody in SH‐SY5Y cells, with overlapping analysis with c‐Myc‐binding protein derived from BioGRID (https://thebiogrid.org) and InBioMap (https://www.intomics.com/inbio/map.html) databases. (B) Co‐IP and western blot assays indicating endogenous interaction of c‐Myc, p‐c‐MycS62 or p‐c‐MycT58 with DEAD‐box helicase 17 (DDX17), LMNA/C, X‐ray repair cross complementing 5 (XRCC5) or X‐ray repair cross complementing 6 (XRCC6) protein in SH‐SY5Y cells. Immunoglobulin G (IgG)‐bound protein served as a negative control. (C) Representative images of bimolecular fluorescent complimentary (BiFC) assay indicating physical interaction (arrowheads) of c‐Myc with LMNA or LMNC, in SK‐N‐BE(2) cells, with nuclei staining with 4′,6‐diamidino‐2‐phenylindole (DAPI). Scale bars: 10 μm. (D) Representative images of immunofluorescence assay showing co‐localisation of c‐Myc and LMNA (arrowheads) in SH‐SY5Y cells, and those co‐transfected with empty vector (mock), c‐Myc or LMNA, with nuclei staining with DAPI. Scale bars: 10 μm. (E) Representative images (upper panel) and quantification (lower panel) of immunofluorescence assay revealing the expression of c‐Myc and LMNA (arrowheads) in NB specimens with different differentiation status (= 5), with nuclei staining with DAPI. Scale bars: 50 μm. (F) Co‐IP and western blot assays indicating the direct interaction between recombinant GST‐tagged c‐Myc and His‐tagged LMNA truncation proteins as indicated. ** < .01. Data are representative of three independent experiments in (B‒D) and (F).
FIGURE 5
FIGURE 5
Lamin A (LMNA) inhibits c‐Myc transactivation essential for EPRS or LARS expression and malate‐aspartate shuttle (MAS) in neuroblastoma (NB). (A) Co‐immunoprecipitation (co‐IP) and western blot assays showing the interaction between LMNA and c‐Myc, p‐c‐MycS62 or p‐c‐MycT58 in SK‐N‐BE(2) and SH‐SY5Y cells stably transfected with scramble shRNA (sh‐Scb), sh‐LMNA #1 or sh‐LMNA #2. (B) Dual‐luciferase assay indicating the activity of a reporter containing three c‐Myc canonical binding sites in SH‐SY5Y and SK‐N‐AS cells stably transfected with sh‐Scb, sh‐c‐Myc #1, sh‐LMNA #1 or sh‐LMNA #2 (= 4). (C and D) Chromatin immunoprecipitation (ChIP) and quantitative PCR (qPCR) (C, normalised to input DNA) and dual‐luciferase (D) assays showing the c‐Myc enrichment and promoter activity of EPRS and LARS in SH‐SY5Y cells stably transfected with sh‐Scb, sh‐c‐Myc #1, sh‐LMNA #1 or sh‐LMNA #2 (= 5). (E and F) Real‐time quantitative RT‐PCR (qRT‐PCR) (E, normalised to β‐actin) and western blot (F) assays indicating the transcript and protein levels of EPRS and LARS in SH‐SY5Y cells stably transfected with sh‐Scb, sh‐c‐Myc #1, sh‐LMNA #1 or sh‐LMNA #2 (= 5). (G) Western blot assay showing the expression of c‐Myc, LMNA, EPRS and LARS in HEK293T cells with wild‐type or c‐Myc knockout (c‐Myc −/−), and those transfected with c‐Myc or LMNA construct. (H) Relative mitochondrial and cytoplasmic nicotinamide adenine dinucleotide hydrogen (NADH) levels in SH‐SY5Y cells stably transfected with sh‐Scb, sh‐c‐Myc #1 or sh‐LMNA #1 (= 4). (I) Representative images (left panel), weight at the end points (left panel), mitochondrial NADH/nicotinamide adenine dinucleotide (NAD+) ratio, lactic acid generation and ATP levels (right panel) of xenografts in nude mice formed by hypodermic injection of SH‐SY5Y cells stably transfected with sh‐Scb, sh‐c‐Myc #1 or sh‐LMNA #1 (= 5 for each group). (J) Representative images (left panel), haematoxylin and eosin (HE) staining and quantification of lung metastatic colonisation (arrowheads), and survival curve (right panel) of nude mice treated with tail vein injection of SH‐SY5Y cells stably transfected with sh‐Scb, sh‐c‐Myc #1 or sh‐LMNA #1 (= 5 for each group). Scale bars: 100 μm. Analysis of variance (ANOVA) compared the difference in (B‒E) and (H‒J). Log‐rank test for survival comparison in (J). ** < .01. Data are shown as mean ± standard error of the mean (s.e.m.) (error bars) and representative of three independent experiments in (A‒H).
FIGURE 6
FIGURE 6
Lobeline (LOB) enhances interaction between lamin A (LMNA) and c‐Myc to repress neuroblastoma (NB) progression. (A) Venn diagram indicating identification of 651 potential LMNA‐interacting compounds derived from DINIES database (https://www.genome.jp/tools/dinies), and overlapping analysis with chemicals affecting expression of target genes (EPRS and LARS) from X2K database (https://maayanlab.cloud/ X2K), and those influencing LMNA activity (according to Lipinski's Rule of Five) derived from chEMBL database (https://www.ebi.ac.uk/chembl). (B) Co‐immunoprecipitation (co‐IP) and western blot assays showing the interaction of LMNA with c‐Myc in SH‐SY5Y cells treated with four potential compounds (20 μmol/L) for 24 h. (C) Bimolecular fluorescent complimentary (BiFC) assay revealing physical interaction between c‐Myc and LMNA (arrowheads) in SK‐N‐BE(2) cells co‐transfected with pBiFC‐c‐Myc‐VN173 and pBiFC‐Lamin A‐VC155, and those treated with chemicals (20 μmol/L) for 24 h. Scale bars: 10 μm. (D) Schematic illustration (left panel) and western blot (right panel) assays indicating recombinant proteins with affinity to ferriteglycidyl methacrylate (FG) beads covalently conjugated with LOB (10 mmol/L). (E) Western blot assay showing the affinity of recombinant His‐tagged LMNA truncations to FG beads covalently conjugated with LOB (10 mmol/L). (F) Dual‐luciferase assay revealing the c‐Myc transactivation in SH‐SY5Y cells treated with different dosage of LOB as indicated (= 5). (G) Enzyme‐linked immunosorbent assay (ELISA) assay reflecting the levels of EPRS and LARS in SH‐SY5Y cells treated with different dosage of LOB as indicated (= 5). (H) Representative images (upper panel), growth curve (upper panel), weight at the end points (lower panel), mitochondrial nicotinamide adenine dinucleotide hydrogen/nicotinamide adenine dinucleotide (NADH/NAD+) ratio, lactic acid generation and ATP levels (lower panel) of hypodermic xenografts formed by SH‐SY5Y cells in nude mice that that received intraperitoneal administration of LOB (5 mg/kg, = 4 for each group). Scale bars: 100 μm. (I) Representative images (upper panel), haematoxylin and eosin (HE) staining (middle panel, arrowheads) and quantification (lower panel) of lung metastatic colonisation, and survival curve (lower panel) of nude mice treated with tail vein injection of SH‐SY5Y cells and dimethyl sulphoxide (DMSO) or LOB (5 mg/kg, = 5 for each group). Analysis of variance (ANOVA) compared the difference in (F‒I). Log‐rank test for survival comparison in (I). * < .05, ** < .01. Data are shown as mean ± standard error of the mean (s.e.m.) (error bars) and representative of three independent experiments in (B‒G).
FIGURE 7
FIGURE 7
Lobeline (LOB) suppresses organoid growth via facilitating lamin A (LMNA)‒c‐Myc interaction. (A) Schematic illustration of culture and treatment of organoids derived from adrenal glands of wild‐type (WT) or TH‐Cre:c‐Myc knock‐in (KI) C57BL/6J mice. (B) Co‐immunoprecipitation (co‐IP) and western blot assays showing endogenous interaction between Lmna and c‐Myc within adrenal glands of WT or TH‐Cre:c‐Myc C57BL/6J mice. (C) Western blot (left panel) and enzyme‐linked immunosorbent assay (ELISA) (right panel, = 5) assays indicating the protein levels of Eprs and Lars in adrenal tissues of WT or TH‐Cre:c‐Myc knock‐in mice. (D) Relative mitochondrial nicotinamide adenine dinucleotide hydrogen/nicotinamide adenine dinucleotide (NADH/NAD+) ratio, lactic acid generation and ATP levels in adrenal tissues of WT or TH‐Cre:c‐Myc knock‐in mice. (E) Representative images of cultured organoids (arrowheads) derived from adrenal tissues of WT or TH‐Cre:c‐Myc mice for duration as indicated. Scale bars: 10 μm. (F and G) Co‐IP and western blot assays (F), representative images and quantification (G) indicating the interaction between Lmna and c‐Myc, as well as growth of organoids (arrowheads) derived from adrenal tissues of TH‐Cre:c‐Myc mice, and those treated with LOB as indicated. Scale bars: 10 μm. Student's t test and analysis of variance (ANOVA) compared the difference in (C), (D) and (G). * < .05, ** < .01. Data are shown as mean ± standard error of the mean (s.e.m.) (error bars) or representative of three independent experiments in (B‒G).
FIGURE 8
FIGURE 8
LMNA, c‐Myc and target genes are associated with outcome of neuroblastoma (NB) patients. (A and B) Western blot (A) and real‐time quantitative RT‐PCR (qRT‐PCR) (B, normalised to β‐actin) assays showing the expression of LMNA, c‐Myc, transfer RNA (tRNA) processing genes (EPRS and LARS) and malate‐aspartate shuttle (MAS) genes (GOT1 and MDH1) in normal dorsal ganglia (DG) and NB tissues (= 30) with different international neuroblastoma staging system (INSS) stages. (C) The expression correlation of c‐Myc with EPRS or LARS in 42 NB tissues. (D) Kaplan‒Meier curves indicating overall survival of well‐defined 498 NB cases (GSE62564) with high or low expression of c‐Myc (cutoff value = 4.6), LMNA (cutoff value = 6.2), EPRS (cutoff value = 6.9), LARS (cutoff value = 6.9), GOT1 (cutoff value = 4.9) or MDH1 (cutoff value = 6.1). (E) The mechanisms underlying LMNA‐inhibited c‐Myc activity in tRNA processing, MAS and NB progression: LMNA interacts with c‐Myc to suppress its activity, resulting in transcriptional repression of EPRS and LARS, translational down‐regulation of glutamic‐oxaloacetic transaminase 1 (GOT1) and malate dehydrogenase 1 (MDH1) via activating general control nonrepressed 2 (GCN2) or inhibiting mechanistic target of rapamycin (mTOR) signalling, reduction of MAS and decrease in tumourigenesis and aggressiveness. As a LMNA‐binding compound, lobeline facilitates the interaction of LMNA with c‐Myc, resulting in inhibition of c‐Myc activity and tumour progression. Meanwhile, the other potential roles of LMNA in NB progression, such as anchoring heterochromatin and binding with transcription factors (TFs) or signalling proteins, warrant further studies. Analysis of variance (ANOVA) compared the difference in (B). Pearson's correlation coefficient analysis for gene expression in (C). Log‐rank test for survival comparison in (D). * < .05. Data are shown as mean ± standard error of the mean (s.e.m.) (error bars) in (B).

References

    1. Giegé R, Eriani G. The tRNA identity landscape for aminoacylation and beyond. Nucleic Acids Res. 2023;51:1528‐1570. - PMC - PubMed
    1. Kwon NH, Fox PL, Kim S. Aminoacyl‐tRNA synthetases as therapeutic targets. Nat Rev Drug Discov. 2019;18:629‐650. - PubMed
    1. Liu H, Fredimoses M, Niu P, et al. EPRS/GluRS promotes gastric cancer development via WNT/GSK‐3β/β‐catenin signaling pathway. Gastric Cancer. 2021;24:1021‐1036. - PubMed
    1. Gao G, Yao Y, Li K, et al. A human leucyl‐tRNA synthetase as an anticancer target. Onco Targets Ther. 2015;8:2933‐2942. - PMC - PubMed
    1. Borst P. The malate‐aspartate shuttle (Borst cycle): how it started and developed into a major metabolic pathway. IUBMB Life. 2020;72:2241‐2259. - PMC - PubMed

Publication types

Associated data