. 2012;7(6):e38287.
doi: 10.1371/journal.pone.0038287. Epub 2012 Jun 1.

Genome haploidisation with chromosome 7 retention in oncocytic follicular thyroid carcinoma

Affiliations

Genome haploidisation with chromosome 7 retention in oncocytic follicular thyroid carcinoma

Willem E Corver et al. PLoS One. 2012.

Abstract

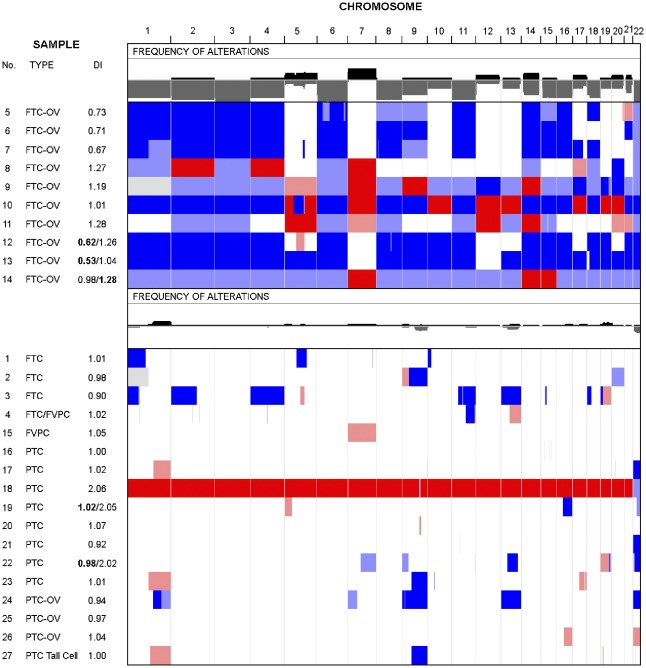
Background: Recurrent non-medullary thyroid carcinoma (NMTC) is a rare disease. We initially characterized 27 recurrent NMTC: 13 papillary thyroid cancers (PTC), 10 oncocytic follicular carcinomas (FTC-OV), and 4 non-oncocytic follicular carcinomas (FTC). A validation cohort composed of benign and malignant (both recurrent and non-recurrent) thyroid tumours was subsequently analysed (n = 20).

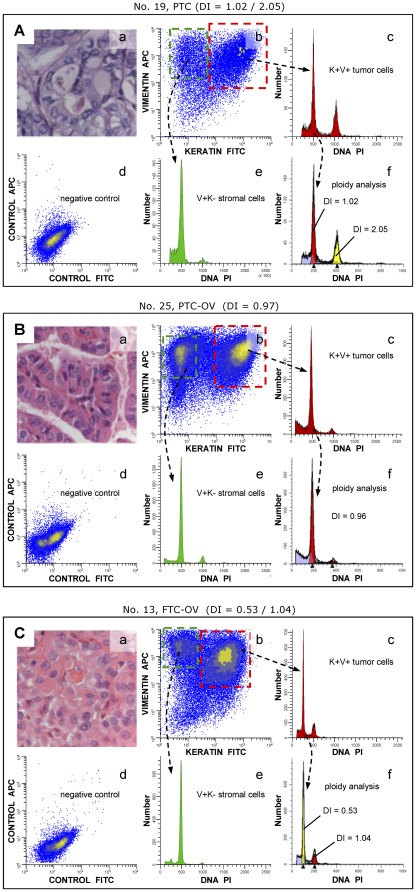
Methods: Data from genome-wide SNP arrays and flow cytometry were combined to determine the chromosomal dosage (allelic state) in these tumours, including mutation analysis of components of PIK3CA/AKT and MAPK pathways.

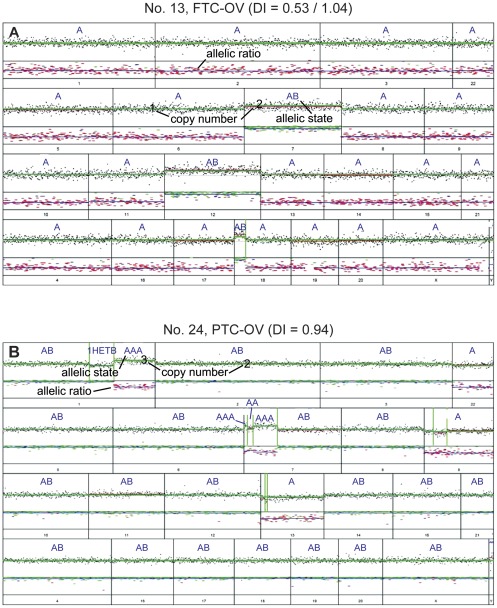
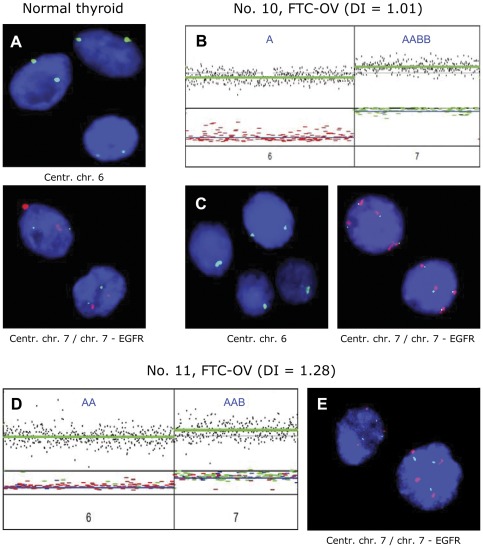
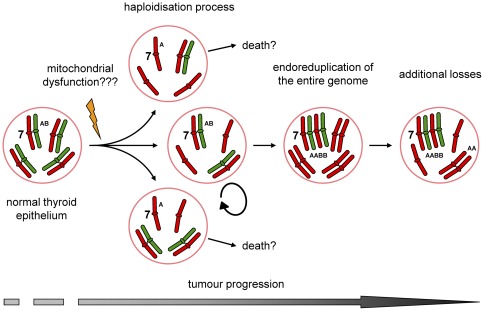
Results: All FTC-OVs showed a very distinct pattern of genomic alterations. Ten out of 10 FTC-OV cases showed near-haploidisation with or without subsequent genome endoreduplication. Near-haploidisation was seen in 5/10 as extensive chromosome-wide monosomy (allelic state [A]) with near-haploid DNA indices and retention of especially chromosome 7 (seen as a heterozygous allelic state [AB]). In the remaining 5/10 chromosomal allelic states AA with near diploid DNA indices were seen with allelic state AABB of chromosome 7, suggesting endoreduplication after preceding haploidisation. The latter was supported by the presence of both near-haploid and endoreduplicated tumour fractions in some of the cases. Results were confirmed using FISH analysis. Relatively to FTC-OV limited numbers of genomic alterations were identified in other types of recurrent NMTC studied, except for chromosome 22q which showed alterations in 6 of 13 PTCs. Only two HRAS, but no mutations of EGFR or BRAF were found in FTC-OV. The validation cohort showed two additional tumours with the distinct pattern of genomic alterations (both with oncocytic features and recurrent).

Conclusions: We demonstrate that recurrent FTC-OV is frequently characterised by genome-wide DNA haploidisation, heterozygous retention of chromosome 7, and endoreduplication of a near-haploid genome. Whether normal gene dosage on especially chromosome 7 (containing EGFR, BRAF, cMET) is crucial for FTC-OV tumour survival is an important topic for future research. MICROARRAYS: Data are made available at GEO (GSE31828).


Conflict of interest statement

Competing Interests: The authors have declared that no competing interests exist.

Figures

Figure 1
Figure 1. Examples of DNA content analysis of recurrent NMTC. Multiparameter DNA content analysis was performed on FFPE NMTC, as described.
A. Multiparameter DNA content analysis of a bimodal PTC with a DI of 1.02 and 2.05 (case No. 19), B. a PTC-OV with a DI of 0.97 (case No. 25) and C. a bi-modal FTC-OV with a DI of 0.53 and 1.04, respectively (case No. 13). a. Haematoxylin – eosin staining 200×. b. keratin vs. vimentin density plot (note the vimentin co-expression of these tumours and the clear separation between the stromal and the epithelial cell fraction. The expression of keratin and vimentin are high, relative to the controls showing background fluorescence [d]). Twenty-five samples, 93% (25/27), showed high vimentin co-expression in more than 50% of the cancer cells (data not shown). c. DNA histogram generated after gating on the epithelial cell fraction. e. DNA histogram generated after gating on the normal DNA diploid stromal cell fraction. This fraction was used as a DNA content reference. f. DNA histogram of the epithelial cell fraction after modelling by ModFit (note that the presence of a second cell cycling population in the bimodal PTC and the FTC-OV DNA histograms is significant and demonstrates endoreduplication. In addition, the FTC-OV shows a dominant DNA near-haploid population [c, f]).
Figure 2
Figure 2. Examples of genome-wide allelic state analysis of an FTC-OV and a PTC-OV.
A. FTC-OV (case No. 13, see also Figure 1) with DIs of 0.53 and 1.04 shows allelic state [A] for most chromosomes, except for chromosomes 7 and 12 and a segment of chromosome 18 showing retention (allelic state [AB]). Chromosome X also shows an allelic state [A]. B. The PTC-OV sample with a DI of 0.94 (case No. 24) shows a relatively limited number of genomic alterations. Chromosomes 1q and 7p showed an [AAA] allelic state after LAIR analysis. Another segment of 1q showed 1 copy but was heterozygous, which can be explained by a balanced mixture of two populations, one with an allelic state [A] and one with an allelic state [B], representing intra-tumour heterogeneity. In comparison with normal cells, one copy of chromosome 9, 13 and 22 was lost, as shown by the allelic state [A]. Both X chromosomes were detected in this female patient [AB].
Figure 3
Figure 3. Summary of the genomic alterations found after LAIR analysis (see Materials and Methods) in 27 recurrent NMTCs.
In this heatmap, rows represent tumours and columns represent chromosomes. The first column shows the tumour number, type and DNA index (DI). The tumours have been grouped according to their subtype, with ten FTC-OV tumours in the upper group and 17 NON FTC-OV in the lower group. The combined frequency of genomic alterations for each group is indicated in a separate row. Black indicates allelic states with >2 copies and at least one B allele retained, e.g. [AABB] and [AAB]. Grey indicates allelic states of [A] and [AA]. The colours in the heatmap indicate: white, allelic state [AB] = normal heterozygous state. Dark red, allelic states [AABB], [AAABBB], etc. = amplified heterozygous states. Light red, allelic states [AAB], [AAABB], etc. = imbalanced gain. Dark blue, allelic state [A] = LOH or physical loss in the context of a diploid genome but monosomy in the context of a haploid genome. Light blue, allelic states [AA], [AAA], etc. = copy neutral LOH and amplified LOH, respectively. Notice the retention of chromosome 7 for five out of ten FTC-OV tumours (allelic states [AB]) with the remaining five showing endoreduplication with allelic states [AABB] (n = 4) or [AAB] (n = 1). The Integrative Genomics Viewer (IGV) was used to produce this image.
Figure 4
Figure 4. Interphase FISH analysis in relation to allelic state analysis.
In FTC-OV, chromosome 6 was always observed in allelic state [A] or [AA], whereas chromosome 7 was always retained in a heterozygous state or amplified heterozygous state. To confirm these results, interphase FISH was performed for chromosomes 6 and 7. Examples are shown, see also Table 1. A. FISH on normal thyroid epithelium. B and C show FTC-OV case No. 10. B: Allelic state analysis illustrating allelic state [A] for chromosome 6 and allelic state [AABB] for chromosome 7. C. Left panel: green signal, centromere 6 shows 1 copy, confirming the allelic state [A] in three of the four nuclei. Right panel: four green and four red signals representing EGFR and centromere 7, respectively and confirming the [AABB] allelic state. D–E show FTC-OV, case no 11. D. The allelic state [AAB] of chromosome 7 could not be confirmed definitively and showed a mixture of nuclei containing three green (EGFR) and three red (centromere) signals or four green and four red signals, respectively (E). This may be due to intra-tumour heterogeneity.
Figure 5
Figure 5. Hypothetic model of oncocytic follicular thyroid carcinoma development and progression.
Mutations in mtDNA underlie low levels of ATP productions. In order to compensate for these low energy levels mitochondria carrying these mutations proliferate and accumulate in the cytoplasm of affected cells. Oncocytic FTC is also characterised by a mitochondria-rich cytoplasm, are known to harbour mtDNA mutations (mainly complex I) and do show a disturbed energy production. DNA replication and progression through the cell cycle are energy demanding processes. Low energy levels might also disturb normal formation and function of the mitotic spindle, resulting in an unbalanced mitosis. Cells that have lost chromosomes during several rounds of cell division become DNA near-haploid (haploidisation process). Sustaining a near-haploid genome may require less energy than of normal 2n cells. Consequently near-haploid cells show a growth advantage and are selected for during tumour development. Maintaining chromosome 7 in heterozygous state ([AB]) seems to be essential for tumour survival. This might be indicative for the presence of genes playing an important role in oncocytic FTC. Endoreduplication of these genes into an [AABB] allelic state increases the gene dosage which might be beneficial for further progression.

References

    1. Ferlay J, Shin HR, Bray F, Forman D, Mathers C, et al. Estimates of worldwide burden of cancer in 2008: GLOBOCAN 2008. Int J Cancer. 2010;127:2893–2917. - PubMed
    1. Ricarte-Filho JC, Ryder M, Chitale DA, Rivera M, Heguy A, et al. Mutational profile of advanced primary and metastatic radioactive iodine-refractory thyroid cancers reveals distinct pathogenetic roles for BRAF, PIK3CA, and AKT1. Cancer Res. 2009;69:4885–4893. - PMC - PubMed
    1. Gasparre G, Porcelli AM, Bonora E, Pennisi LF, Toller M, et al. Disruptive mitochondrial DNA mutations in complex I subunits are markers of oncocytic phenotype in thyroid tumors. Proc Natl Acad Sci USA. 2007;104:9001–9006. - PMC - PubMed
    1. Tallini G, Hsueh A, Liu S, Garcia-Rostan G, Speicher MR, et al. Frequent chromosomal DNA unbalance in thyroid oncocytic (Hurthle cell) neoplasms detected by comparative genomic hybridization. Lab Invest. 1999;79:547–555. - PubMed
    1. Frisk T, Kytola S, Wallin G, Zedenius J, Larsson C. Low frequency of numerical chromosomal aberrations in follicular thyroid tumors detected by comparative genomic hybridization. Genes Chromosomes Cancer. 1999;25:349–353. - PubMed

MeSH terms

Supplementary concepts

Associated data