. 2015 Mar;27(3):633-48.
doi: 10.1105/tpc.114.135582. Epub 2015 Mar 10.

Punctual transcriptional regulation by the rice circadian clock under fluctuating field conditions

Affiliations

Punctual transcriptional regulation by the rice circadian clock under fluctuating field conditions

Jun Matsuzaki et al. Plant Cell. 2015 Mar.

Abstract

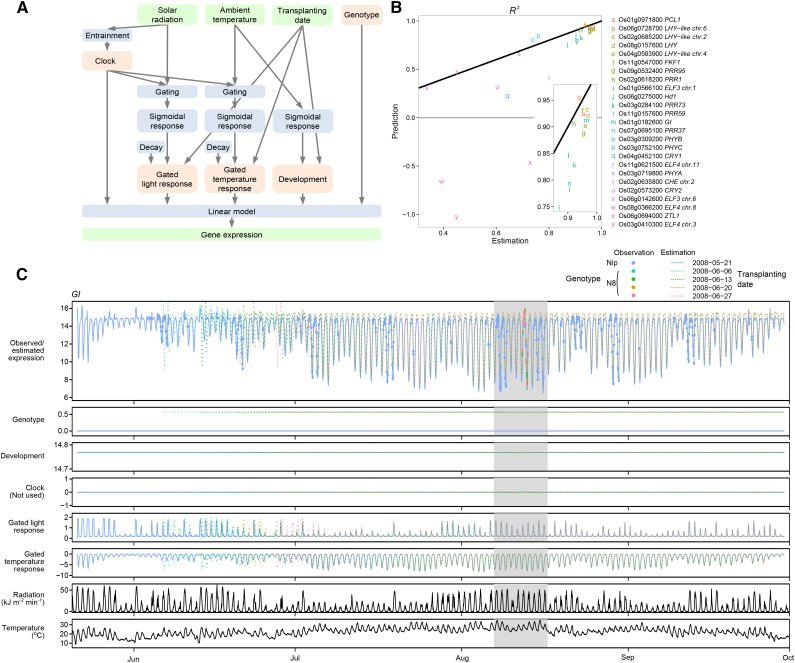
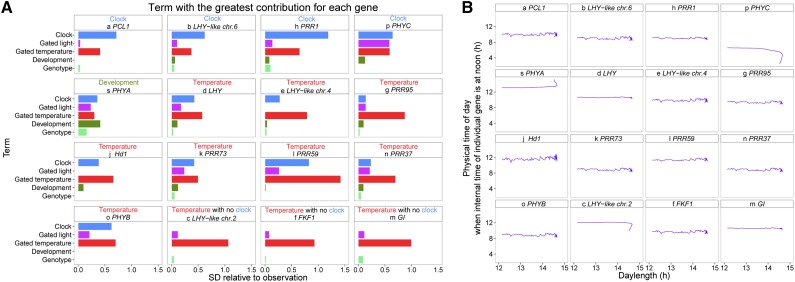
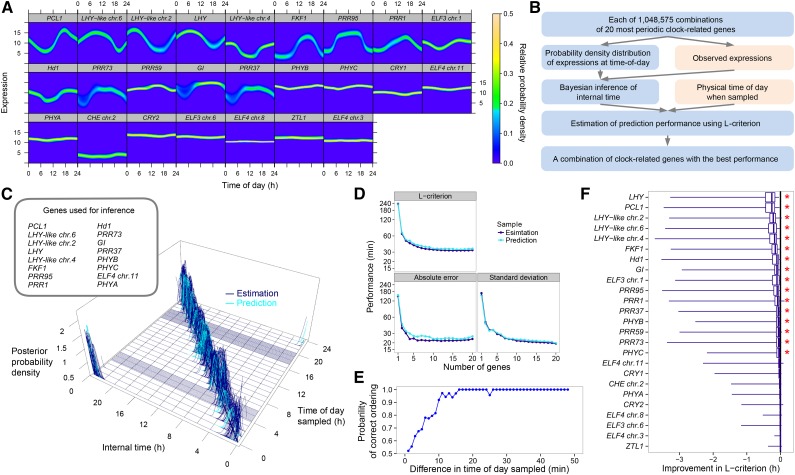
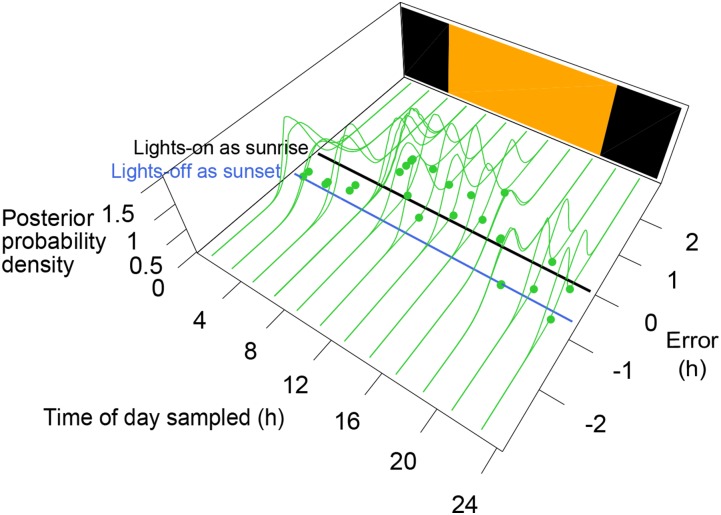
Plant circadian clocks that oscillate autonomously with a roughly 24-h period are entrained by fluctuating light and temperature and globally regulate downstream genes in the field. However, it remains unknown how punctual internal time produced by the circadian clock in the field is and how it is affected by environmental fluctuations due to weather or daylength. Using hundreds of samples of field-grown rice (Oryza sativa) leaves, we developed a statistical model for the expression of circadian clock-related genes integrating diurnally entrained circadian clock with phase setting by light, both responses to light and temperature gated by the circadian clock. We show that expression of individual genes was strongly affected by temperature. However, internal time estimated from expression of multiple genes, which may reflect transcriptional regulation of downstream genes, is punctual to 22 min and not affected by weather, daylength, or plant developmental age in the field. We also revealed perturbed progression of internal time under controlled environment or in a mutant of the circadian clock gene GIGANTEA. Thus, we demonstrated that the circadian clock is a regulatory network of multiple genes that retains accurate physical time of day by integrating the perturbations on individual genes under fluctuating environments in the field.


Figures

Figure 1.
Figure 1.
Structure and Performance of the Gene Expression Model. (A) Structure of the model. Observed variables (except for genotype) are in green, response processes in blue, and terms in pink. (B) Estimation and prediction performance of the model for clock-related genes. R2, the fraction of variance explained by the model relative to variance of the data, was used as an index of fit for each gene model. Estimation performance was obtained with the same training samples (n = 461) as in (C). The black line indicates points where R2 values for estimation and prediction are equal. Prediction performance was obtained from validation samples (n = 108) collected in a different year. The genes are listed in order of rhythmicity evaluated as mutual information between the estimated gene expression and time of day (Supplemental Figure 3). (C) The GI model as an example of estimated gene expression, inputs to the linear model, and observed gene expression. The shaded time interval is expanded in Supplemental Figure 4A. Nip, ‘Nipponbare’; N8, ‘Norin 8.’
Figure 2.
Figure 2.
Analysis of the Expression Model for the Genes with High Prediction Performance. (A) Contribution of each term to the estimation. The sd of each term relative to that of the observation is shown. Letters preceding gene names correspond to those in Figure 1B. Only the 16 genes with the highest prediction performance (R2 for prediction >0.5; Figure 1B) are shown. The model of ELF3_chr.1 (data not shown) was considered unrealistic because the sds of the gated light response and development terms were >10 times that of the observation. (B) Relationship between daylength and physical time of day when internal time of individual genes is at noon. Points for each day are connected along the lapse of date. Daylength was based on the astronomical estimate at the longitude, latitude, and altitude where the samples were taken (National Astronomical Observatory of Japan, http://eco.mtk.nao.ac.jp/cgi-bin/koyomi/koyomix_en.cgi). The internal time that corresponded to noon of physical time of day for most genes was earlier than 12:00 h because sensitivity to solar radiation is higher for the progress in the morning than that for the delay in the evening in those models, as indicated by asymmetry in response q > 1 (Supplemental Table 10; see Equation 5 in Methods). With the higher sensitivity for progress in the morning, the progress and the delay are counterbalanced when noon of internal time is set at earlier than 12:00 h of physical time.
Figure 3.
Figure 3.
Inference of Internal Time from the Expression Data of Circadian Clock-Related Genes. (A) Probability density distributions between physical time of day and expression of the 25 clock genes based on the variation during an entire crop season in 2008. The genes are listed in order of rhythmicity (Supplemental Figure 3). (B) Time inference process, evaluation, and optimization of performance. Observed variables are in pink and the inference processes in blue. See Supplemental Figure 8A. (C) Estimation and prediction of internal time using the gene combination with the best estimation performance (i.e., the lowest mean absolute error in estimation). Posterior probability density of internal time is plotted against time of day sampled. Each blue (training sample for estimation; n = 461) or turquoise (validation sample for prediction, n = 125) line corresponds to a single sample. Among the training samples, samples obtained at 10-min intervals at 04:00 to 06:00 and 17:00 to 20:00 are included. Ranges of internal time with zero posterior probability density for those samples are represented as areas with dense blue lines at the bottom of the 3D space. Thick black diagonal line at the bottom of the 3D space indicates the correspondence between internal time and time of day sampled. (D) Performance of the gene combination with the least L-criterion for each number of genes per combination. (E) Probability of correct prediction of the sampling order for all possible pairs from 48 sequential samples collected at 1-min (or 2-min) intervals (based on the data in Supplemental Figure 8E). (F) Contribution of each gene to the estimation performance. Improvement in the L-criterion by inclusion of the gene in the gene combinations is shown. Right ends of the horizontal bars, maximum values; right ends of the boxes, 75% quantile; vertical bars in the boxes, median; left ends of the boxes, 25% quantile; left ends of the horizontal bars, minimum values. Genes are listed in decreasing order of median improvement. Asterisks indicate significant improvement (P < 0.05 by the Wilcoxon signed-rank test with random permutation and Bonferroni correction; Supplemental Table 7).
Figure 4.
Figure 4.
Time Progression under a Controlled Diurnal Environment. Prediction errors of internal time were calculated relative to physical time of day sampled. Green lines denote posterior distributions of errors, of which expectations are denoted by green points. Time of day sampled under the controlled environment was set so that lights-on time under the controlled environment corresponded to the average time of sunrise during the crop season. We also tried to set time of day so that the lights-off time under the controlled environment corresponded to the average time of sunset. Black and blue lines indicate the zero error line for the former and the latter setting, respectively. Orange and black rectangles indicate the light and dark periods, respectively.
Figure 5.
Figure 5.
Punctuality of Internal Time for the osgi Mutant. (A) Punctuality of internal time encoded in a combination of clock-related genes showing the best performance for the osgi mutant and the wild type, respectively (see Supplemental Figure 10A for a scheme). (B) Punctuality of internal time encoded in a combination of clock-related genes with the best performance for the wild type (see Supplemental Figure 10B for a scheme).
Figure 6.
Figure 6.
Identification of Downstream Genes of the Circadian Clock Using Perturbed Progression in the osgi Mutant. (A) A scheme to find downstream genes regulated by core genes both in the wild type and osgi (Supplemental Table 8). Processes for time inference from expression of the core genes are shown in blue and those for prediction of downstream gene expression are in green. The gene expression in osgi was predicted by plugging in internal time in osgi (determined by a combination of core genes in osgi) for physical time and inferring gene expression based on the relationship between the physical time and expression of a downstream gene in the wild type. (B) Time progression in osgi that most accurately explains the expression of downstream genes. The seven core genes were used for inference of internal time. (C) A downstream gene with the best prediction performance (Os03g0387900). Note that we can predict a delay in the acute increase at dawn and occasional outlier expression after midnight in osgi relative to the wild type. The corresponding internal time for osgi is delayed from midnight to dawn with occasional severity but jumps in the morning to catch up with the wild type by noon as shown in (B).
Figure 7.
Figure 7.
Structure of Regulation by the Core Genes Revealed by the Perturbed Time Progression in osgi. (A) A scheme for finding the structure of regulation. (B) Contribution of 15 core genes to the prediction of expression of downstream genes. Bonferroni-corrected log10 P values for each core gene determined by the Wilcoxon signed-rank test with random permutation are shown as a gray-scaled heat map. PC analysis was performed using the log10 P values for 15 core genes with each downstream gene. The scores of each downstream gene on PCs 1 and 2 are indicated by the colors of the circles above the heat map (as also shown in [D]). Small PC1 values are expressed as blue and large PC2 values green. The same labeling of colors are used to distinguish the 68 downstream genes in (E) to (I). (C) Loading of the log10 P values of each core gene on PC1 and PC2 scores of the downstream genes. (D) Scores of PC1 and PC2. (E) Progression of internal time with the best prediction performance for each downstream gene. The osgi time progression for a downstream gene is shown as a polygonal line connecting the means of expectation of the internal time for each time of day sampled. The thick black line shows time progression along physical time of day. (F) and (G) Relative expression of predicted downstream genes in the wild type (F) and osgi (G). Log2 expression levels are standardized so that the mean is 0 and sd is 1 for the wild type. (H) Difference in the relative expression between the wild type and osgi. (I) Significant relationships between groups of the core genes and downstream gene clusters based on PC analysis.

References

    1. Alabadí D., Yanovsky M.J., Más P., Harmer S.L., Kay S.A. (2002). Critical role for CCA1 and LHY in maintaining circadian rhythmicity in Arabidopsis. Curr. Biol. 12: 757–761. - PubMed
    1. Baggs J.E., Price T.S., DiTacchio L., Panda S., Fitzgerald G.A., Hogenesch J.B. (2009). Network features of the mammalian circadian clock. PLoS Biol. 7: e52. - PMC - PubMed
    1. Batschelet E. (1965). Statistical Methods for the Analysis of Problems in Animal Orientation and Certain Biological Rhythms. (Washington, DC: American Institute of Biological Sciences; ).
    1. Covington M.F., Panda S., Liu X.L., Strayer C.A., Wagner D.R., Kay S.A. (2001). ELF3 modulates resetting of the circadian clock in Arabidopsis. Plant Cell 13: 1305–1315. - PMC - PubMed
    1. Dodd A.N., Salathia N., Hall A., Kévei E., Tóth R., Nagy F., Hibberd J.M., Millar A.J., Webb A.A.R. (2005). Plant circadian clocks increase photosynthesis, growth, survival, and competitive advantage. Science 309: 630–633. - PubMed

Publication types