. 2012 Apr 20;36(4):586-99.
doi: 10.1016/j.immuni.2012.02.017.

Critical Role of STAT5 transcription factor tetramerization for cytokine responses and normal immune function

Affiliations

Critical Role of STAT5 transcription factor tetramerization for cytokine responses and normal immune function

Jian-Xin Lin et al. Immunity. .

Abstract

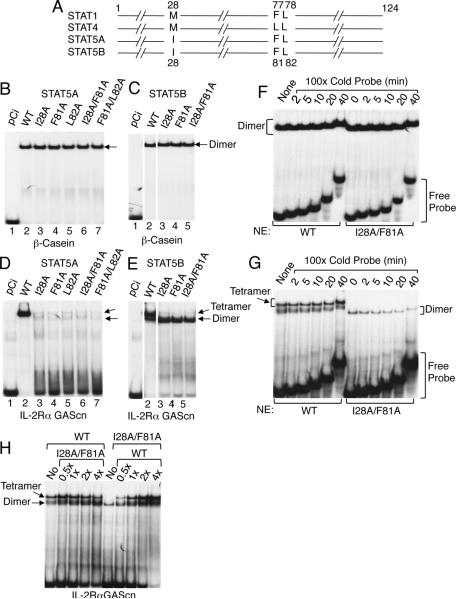
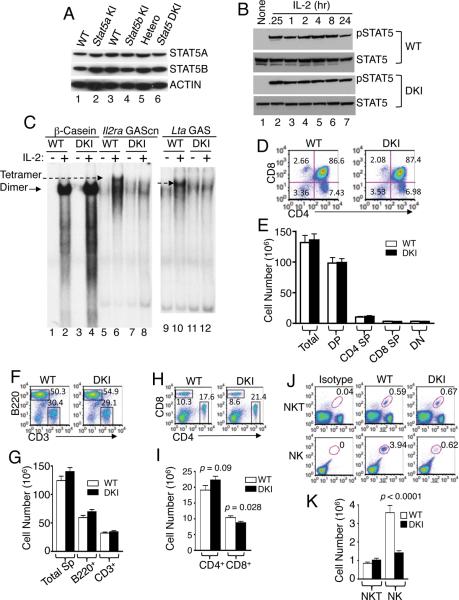
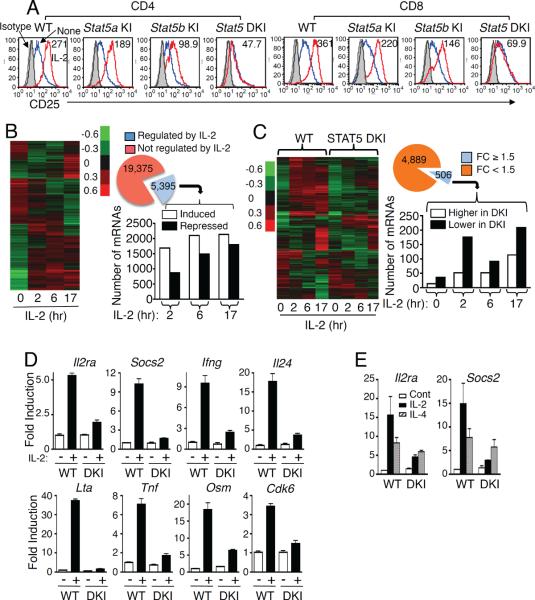
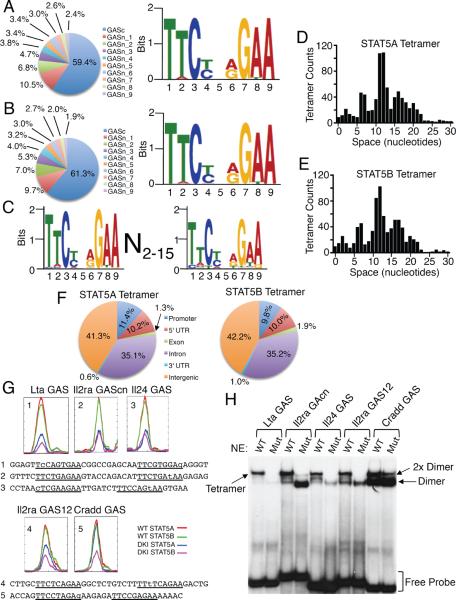
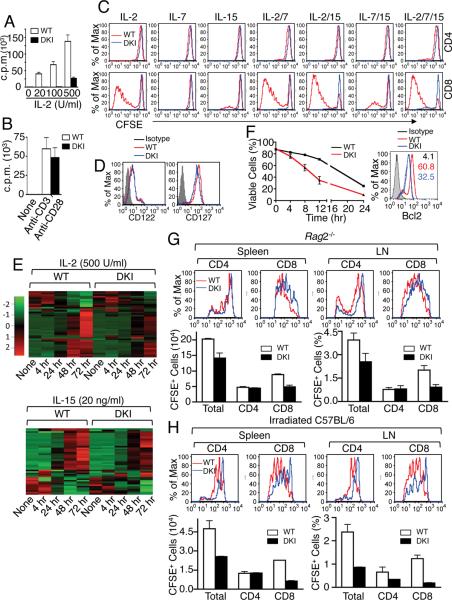
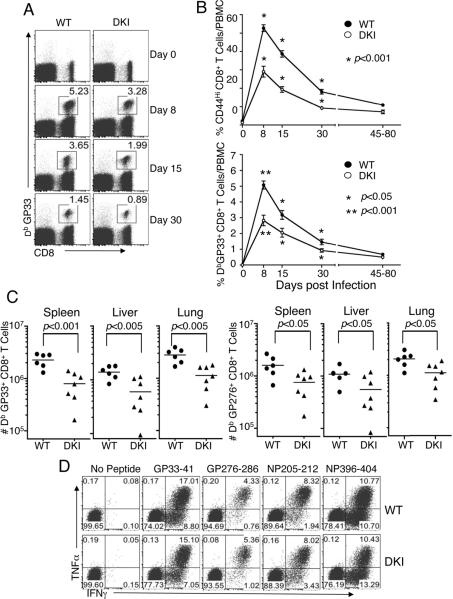
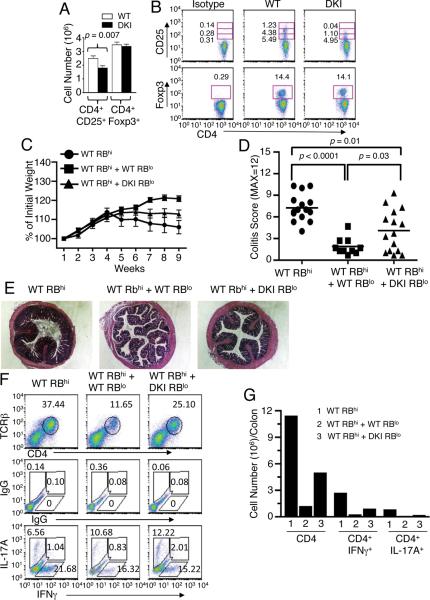
Cytokine-activated STAT proteins dimerize and bind to high-affinity motifs, and N-terminal domain-mediated oligomerization of dimers allows tetramer formation and binding to low-affinity tandem motifs, but the functions of dimers versus tetramers are unknown. We generated Stat5a-Stat5b double knockin (DKI) N-domain mutant mice in which STAT5 proteins form dimers but not tetramers, identified cytokine-regulated genes whose expression required STAT5 tetramers, and defined dimer versus tetramer consensus motifs. Whereas Stat5-deficient mice exhibited perinatal lethality, DKI mice were viable; thus, STAT5 dimers were sufficient for survival. Nevertheless, STAT5 DKI mice had fewer CD4(+)CD25(+) T cells, NK cells, and CD8(+) T cells, with impaired cytokine-induced and homeostatic proliferation of CD8(+) T cells. Moreover, DKI CD8(+) T cell proliferation after viral infection was diminished and DKI Treg cells did not efficiently control colitis. Thus, tetramerization of STAT5 is critical for cytokine responses and normal immune function, establishing a critical role for STAT5 tetramerization in vivo.


Figures

Figure 1
Figure 1. I28, F81, and L82 in the N-domains of STAT5A and STAT5B are required for tetramer formation
(A) Schematic of conserved amino acids required for tetramer binding in STAT1, STAT4, STAT5A, and STAT5B, based on data for STAT1 and STAT4 (Chen et al., 2003). The numbers above (for STAT1 and STAT4) or below (for STAT5A and STAT5B) indicate the amino acid positions. (B through E) EMSAs were performed using [32P]-labeled β-casein (B and C) or IL-2Rα GAScn (D and E) probes and nuclear extracts from 293T+ cells transfected with plasmids directing expression of IL-2Rβ, γc, and JAK3 as well as pCi (B to E, lane 1), pCi-Stat5a (B and D, lanes 2 to 7), or pCi-Stat5b (C and E, lanes 2 to 5), as indicated. Arrows indicate dimer or tetramer binding. (F and G) Off-rates of WT and mutant STAT5 proteins from a site from the bcasein gene, which binds as dimers (F) or a site from IL-2Rα gene, which binds both STAT5 tetramers and dimers (G). (H) Titration of binding WT and mutant STAT5B proteins. The experiments in panel B-H were performed twice.
Figure 2
Figure 2. Normal expression and tyrosine phosphorylation of STAT5 proteins but decreased peripheral NK and CD8+ T cells in DKI mice
(A). Western blots of STAT5A and STAT5B expression in splenic T cells from Stat5a KI (lane 2), Stat5b KI (lane 4), and Stat5a/Stat5b DKI (lane 6) mice versus WT mice (lanes 1, 3, 5). Actin levels are also shown as a loading control. (B). Representative western blots of two experiments showing tyrosine phosphorylated and total STAT5 protein in WT (upper panels) and DKI (lower panels) splenic T cells stimulated by IL-2 (100 U/ml) for the indicated times. Prior to IL-2 stimulation, cells were preactivated by plate-bound anti-CD3 (2 μg/ml) and soluble anti-CD28 (1 μg/ml) for two days and rested overnight. This experiment was performed two times. (C). EMSA for dimeric STAT5 binding (β-casein probe, lanes 2 and 4) and tetrameric STAT5 binding (for Il2ra GAScn, lanes 6 and 8 and Lta GAS, lanes 10 and 12) using nuclear extracts from IL-2-treated WT and DKI T cells. Dimer (arrow with solid line) and tetramer (arrow with dash line) complexes are indicated. This experiment was performed three times. (D and E) CD4 and CD8 flow cytometric profile of thymocytes from WT and DKI mice (n = 8) (D) with cell numbers indicated (E). (FK) Flow cytometric profiles and cellularity of spleens from WT and DKI mice. (FI) WT and DKI splenocytes were isolated and stained with anti-CD3 versus anti-B220 (F and G) or anti-CD4 vs. anti-CD8 (H and I) (n = 20). (J and K) Splenocytes from WT and DKI mice (n = 16) were stained as TCRβ+CD1d-PBS57+ NKT cells or CD3NK1.1+CD122+ NK cells.
Figure 3
Figure 3. Altered gene expression in DKI T cells
(A) Preactivated splenic T cells were rested overnight and re-stimulated with IL-2 for 1 day prior to determining CD25 expression in CD4+ (top row) and CD8+ (bottom row) T cells. IL-2-induced CD25 expression levels are indicated as mean fluorescence (MFI). Isotype control (IgG), IL-2, and untreated samples are shown in gray, red, and blue, respectively. This experiment was performed three times. (B) On the left is a hierarchical clustering analysis of gene expression profiles regulated by IL-2 in WT T cells. Also shown is a pie graph of the number of mRNAs not regulated (red) or regulated (blue) by IL-2. For IL-2-regulated mRNAs, the linked bar graph indicates the number of mRNAs whose expression was induced (open bars) or repressed (solid bars) at each time point. (C) Shown on the left is the hierarchical clustering analysis of IL-2-regulated mRNAs in DKI as compared with WT T cells. Also shown is a pie graph of the number of IL-2-regulated mRNAs whose expression was not affected (orange) or affected (blue) in DKI T cells. For the 506 mRNAs whose expression was affected, the linked bar graph indicates the number of genes whose expression was higher (open bars) or lower (solid bars) in the DKI T cells. For the experiments in panels B and C, 5 replicates of WT and DKI splenic T cells were analyzed for each treatment. (D and E) Validation of (D) STAT5 tetramer-dependent IL-2-induced gene expression and (E) STAT5 tetramer-independent IL-4-induced gene expression. The experiments described in panel D were performed 4 times and in panel E were performed twice. The cDNA inputs were normalized after RT-PCR based on the cycle number for Rpl7 primers, as Rpl7 expression was constant under our experimental conditions. Shown are the relative expression of triplicate samples of a representative experiment.
Figure 4
Figure 4. Distribution of STAT5 binding sites and STAT5 dimer and tetramer motifs
(A and B) Consensus dimer motifs for STAT5A (A) and STAT5B (B). The pie graphs show the top 10 binding motifs for STAT5A (A) and STAT5B (B), as detailed in Supplemental Figure S4D and S4E. (C) Consensus tetramer motif for STAT5A and STAT5B. (D and E) Spacing distribution between tandemly-linked GAS or GAS-like motifs for STAT5A (D) and STAT5B (E). (F) Genome-wide distributions of STAT5A (top) and STAT5B (bottom) tetramer binding sites. 5' UTR, 3' UTR, promoter, and intergenic regions were defined according to Ref Seq data base (February 2006 assembly), and promoters defined as 5 kb upstream of TSS. (G) STAT5 binding motifs for Lta GAS, Il2ra GAScn, Il24 GAS, Il2ra GAS12, and Cradd GAS identified by ChIP-Seq analysis. Color-coded lines indicate chromatin from WT (red and green) or DKI (blue and magenta) T cells immunoprecipitated with anti-STAT5A (red and blue) and STAT5B (green and magenta). Below the graphs are the sequences of the probes for Lta GAS (1), Il2ra GAScn (2) Il24 GAS (3), Il2ra GAS12 (4), and Cradd GAS (5); the GAS and GAS-like motifs are underlined and mismatches are in lower case. (H) EMSA using WT or tetramer-defective mutant STAT5B proteins and GAS motifs from Lta, Il24, Il2ra, and Cradd, based on ChIP-Seq analysis. Tetramer, 2× dimer, dimers, and free probes are indicated based on mobility and whether or not a given probe binds to mutant STAT5B protein. The experiment in panel H was performed 3 times.
Figure 5
Figure 5. STAT5 tetramers are required for cytokine-dependent CD8+ T cell proliferation, survival, and homeostatic proliferation
(A and B) Proliferation of STAT5 DKI T cells in response to IL-2 (A) or TCR (B) stimulation. Shown is one of three (A) or two (B) experiments for [3H]-thymine incorporation assay of purified mouse splenic T cells from STAT5 DKI mice and WT littermates (n = 3) cultured with IL-2 (A) or of anti-CD3 + anti-CD28 (B). (C) Shown are CFSE dilution profiles of WT and DKI splenic CD8+ T cells in response to indicated cytokine stimulations on day 5. The numbers show the percentage of cells that have undergone cell division, based on CFSE dilution. This experiment was performed 4 times. (D) IL-2Rβ (CD122) and IL-7Rα (CD127) expression in DKI (blue lines) and WT (red lines) CD8+ T cells. This experiment was performed 3 times. (E) Heat map of IL-2- and IL-15-regulated genes that are involved in cell cycle and proliferation whose expression is significantly affected in DKI CD8+ T cells. The data were from pooled splenic CD8+ T cells from WT (n = 10) and from DKI (n = 10) mice. (F) Purified WT and DKI spleen T cells were cultured for 5 days with 500 U/ml of IL-2, viable CD8+ T cells (%) after IL-2 withdrawal were determined at indicated time points as CD8+Annexin V7AAD cells. The data shown were derived from two independent experiments. Right, BCL2 expression in WT (red) and DKI (blue) CD8+ T cells was determined by surface staining with anti-CD8 and intracellular staining with Ig control (gray) or anti-BCL2 antibodies and analyzed by flow cytometry. Values indicate MFI. Shown is one of two independent experiments. (G and H) Defective homeostatic proliferation of DKI CD8+ T cells in lymphopenic hosts. CFSE dilution profiles are shown in the top portions of panels G (Rag2−/− recipients) and H (irradiated C57BL/6 recipients). The cell number (spleen) and percentage (lymph nodes) are shown in the lower portions of panels G and H. The experiments in panels F–H were performed 2 times.
Figure 6
Figure 6. Significantly decreased virus-specific CD8+ T cell expansion in STAT5 DKI mice after acute LCMV infection
(A) Representative FACS profiles. Gating was on total lymphocytes. Shown is the frequency of GP33+ CD8+ T cells in WT and DKI mice at indicated times after infection. (B) The frequency of CD44hi and LCMV GP33-specific CD8+ T cells in blood was analyzed by flow cytometry. The experiment was repeated twice and data pooled (error bars are SEM, with n = 14–18 for each group and at each time point). (C) The total number of GP33+ and GP276+ CD8+ T cells in spleen, liver, and lung was quantified by tetramer staining 8 days post infection. (D) TNFα and IFNγ production in virus-specific CD8+ T cells at day 8 post infection. FACS profiles of intracellular cytokine staining in CD8+ T cells are representative of 7 independent analyses performed after restimulation with the indicated LCMV peptides.
Figure 7
Figure 7. Decreased CD4+/CD25+ DKI T cells and Impaired immune suppressive function of DKI Treg cells
(A and B) CD25 (IL-2Rα) and Foxp3 expression on splenic CD4+ T cells from WT and DKI mice were analyzed by flow cytometry. Shown are total cell numbers (A) and FACS profiles (B). The numbers indicate the % of CD4+ cells that were also CD25+ or Foxp3+. CD25 expressing cells are divided in low (bottom boxes), intermediate (middle boxes), and high (top boxes) levels. (C) Weight of mice during colitis development. (D) Colitis scores of H&E stained colon sections from two independent experiments. (E) Representative histological sections of colons with H&E staining. (F and G) Shown are FACS profiles (F) and graph (G) of the frequency and number of lamina propria total TCRβ+CD4+, TCRβ+CD4+IFNγ+, and TCRβ+CD4+IL-17A+ T cells from Rag2−/− mice adoptively transferred with WT RBhi, WTRBhi + WT RBlo, or WT RBhi + DKI RBlo cells.

Comment in

  • STATus report on tetramers.
    Levy DE, Marié IJ. Levy DE, et al. Immunity. 2012 Apr 20;36(4):553-5. doi: 10.1016/j.immuni.2012.04.003. Immunity. 2012. PMID: 22520849

References

    1. Bailey TL, Elkan C. Fitting a mixture model by expectation maximization to discover motifs in biopolymers. Proc Int Conf Intell Syst Mol Biol. 1994;2:28–36. - PubMed
    1. Barber DL, Wherry EJ, Masopust D, Zhu B, Allison JP, Sharpe AH, Freeman GJ, Ahmed R. Restoring function in exhausted CD8 T cells during chronic viral infection. Nature. 2006;439:682–687. - PubMed
    1. Bromberg JF, Wrzeszczynska MH, Devgan G, Zhao Y, Pestell RG, Albanese C, Darnell JE., Jr. Stat3 as an oncogene. Cell. 1999;98:295–303. - PubMed
    1. Campbell DJ, Koch MA. Phenotypical and functional specialization of FOXP3+ regulatory T cells. Nature reviews Immunology. 2011;11:119–130. - PMC - PubMed
    1. Chen X, Bhandari R, Vinkemeier U, Van Den Akker F, Darnell JE, Jr., Kuriyan J. A reinterpretation of the dimerization interface of the N-terminal domains of STATs. Protein Sci. 2003;12:361–365. - PMC - PubMed

Publication types

MeSH terms

Associated data