Comparative Study
. 2013 Jun 28:6:23.
doi: 10.1186/1755-8794-6-23.

Alteration of human blood cell transcriptome in uremia

Affiliations
Comparative Study

Alteration of human blood cell transcriptome in uremia

Andreas Scherer et al. BMC Med Genomics. .

Abstract

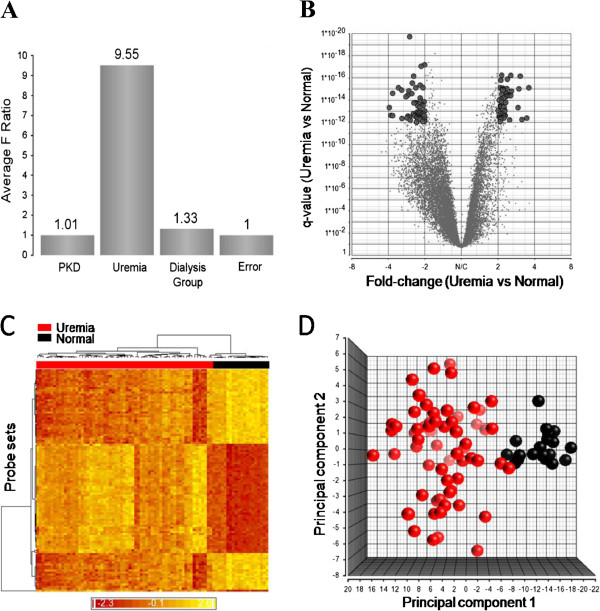
Background: End-stage renal failure is associated with profound changes in physiology and health, but the molecular causation of these pleomorphic effects termed "uremia" is poorly understood. The genomic changes of uremia were explored in a whole genome microarray case-control comparison of 95 subjects with end-stage renal failure (n = 75) or healthy controls (n = 20).

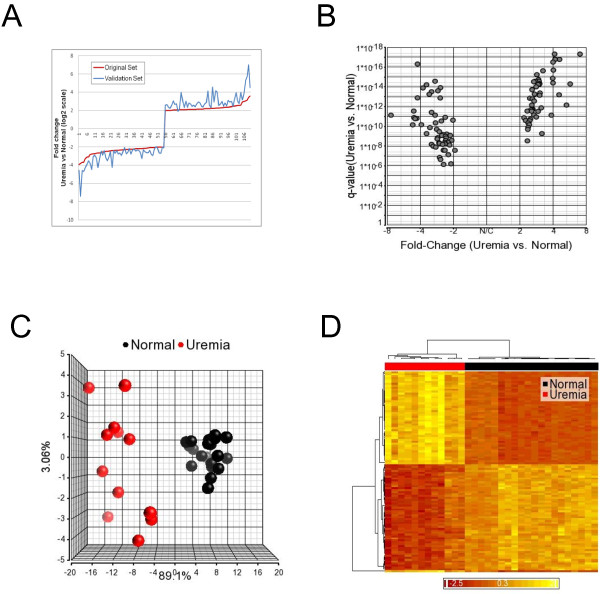
Methods: RNA was separated from blood drawn in PAXgene tubes and gene expression analyzed using Affymetrix Human Genome U133 Plus 2.0 arrays. Quality control and normalization was performed, and statistical significance determined with multiple test corrections (qFDR). Biological interpretation was aided by knowledge mining using NIH DAVID, MetaCore and PubGene

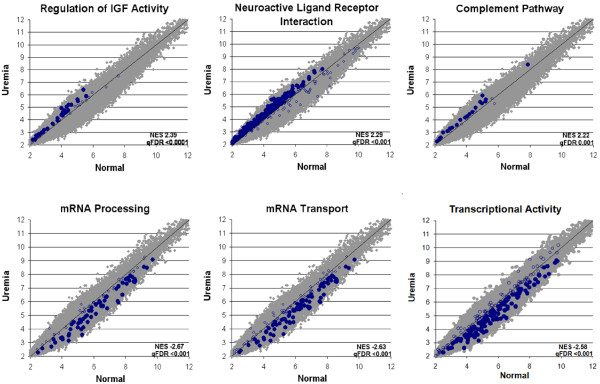
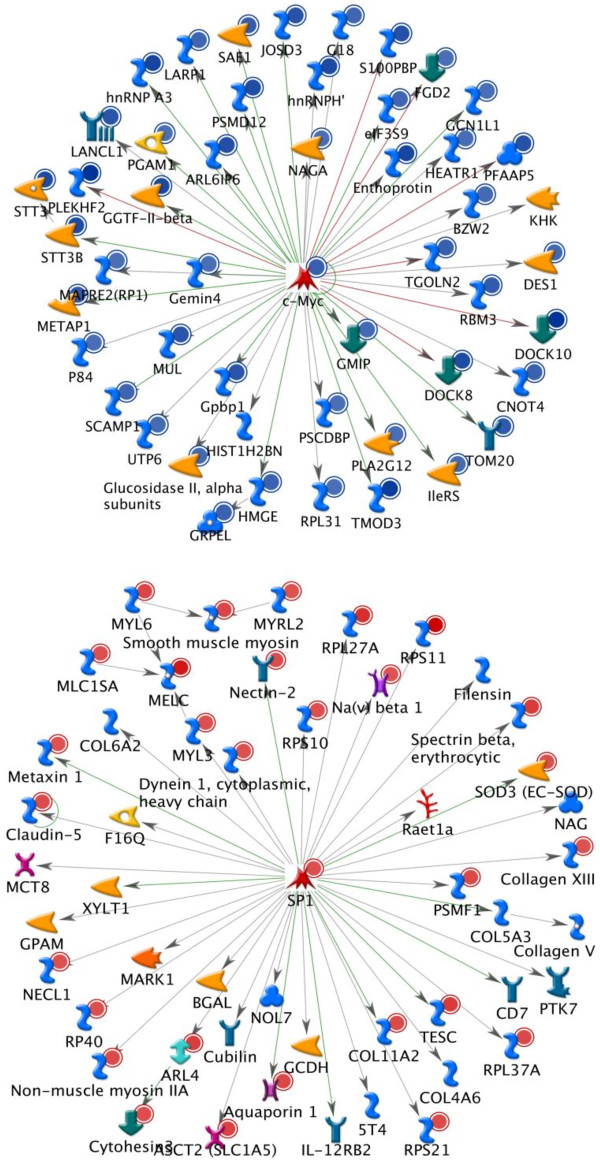
Results: Over 9,000 genes were differentially expressed in uremic subjects compared to normal controls (fold change: -5.3 to +6.8), and more than 65% were lower in uremia. Changes appeared to be regulated through key gene networks involving cMYC, SP1, P53, AP1, NFkB, HNF4 alpha, HIF1A, c-Jun, STAT1, STAT3 and CREB1. Gene set enrichment analysis showed that mRNA processing and transport, protein transport, chaperone functions, the unfolded protein response and genes involved in tumor genesis were prominently lower in uremia, while insulin-like growth factor activity, neuroactive receptor interaction, the complement system, lipoprotein metabolism and lipid transport were higher in uremia. Pathways involving cytoskeletal remodeling, the clathrin-coated endosomal pathway, T-cell receptor signaling and CD28 pathways, and many immune and biological mechanisms were significantly down-regulated, while the ubiquitin pathway and certain others were up-regulated.

Conclusions: End-stage renal failure is associated with profound changes in human gene expression which appears to be mediated through key transcription factors. Dialysis and primary kidney disease had minor effects on gene regulation, but uremia was the dominant influence in the changes observed. This data provides important insight into the changes in cellular biology and function, opportunities for biomarkers of disease progression and therapy, and potential targets for intervention in uremia.


Figures

Figure 1
Figure 1
Differential expression of probe sets between uremic and normal subjects detected by micro-array analysis. (A) Sources of variation estimated in a multifactorial ANOVA model. The y-axis represents signal to noise ratio of the factors. (B) Volcano diagram showing magnitude and direction of change in gene expression. Grey points indicate the probe sets identified by ANOVA alone, and black points indicate the 110 probe sets with a qFDR < 1x10E-12 and |FC| > 2. (C) Unsupervised cluster analysis comparing uremic and normal subjects (squared Euclidean distance, average linkage). Each column represents an experimental subject while each row indicates a probe set. The color in each cell represents standardized log2-gene expression values, red being low and yellow high. (D) Principal component analysis showing separation of uremic and normal subjects.
Figure 2
Figure 2
Visualization of data in the Validation Cohort, showing differential expression, Volcano Plot, Principal Component Analysis and Hierarchical clustering of 100 most highly differentially expressed transcripts from the Discovery Cohort. A: Fold change comparison. Fold changes were sorted by value in the discovery cohort (red line). The x-axis represents the numbered probe sets. Fold change direction is identical and in similar range for all probe sets in both cohorts. B: Volcano plot showing the qFDR and the fold changes for the 110 probe sets in the validation cohort after ANOVA. The qFDR and fold change are comparable in both cohorts. C: PCA utilizing the 110 probe sets from the validation cohort. The two groups are clearly separated indicating that the expression patterns of the transcripts are comparable in both cohorts. D: Hierarchical clustering of Normal and Uremic samples from the validation cohort based on 110 probe sets from the discovery cohort showing clear separation of both subject sets.
Figure 3
Figure 3
Gene Set Enrichment Analysis (GSEA) by gene set permutation. Blue dots represent enriched probe sets of the gene set, blue circles represent probe sets of the gene set that are not enriched, and grey dots represent all other probe sets on the array. X and Y axes are mean signal intensities in log2 scale. Source: http://www.broadinstitute.org/gsea/msigdb/index.jsp, MSigDB database v3.0 updated Sep 9, 2010.
Figure 4
Figure 4
Pathway analysis showing principal pathways altered in relation to the transcription factors c-Myc and SP1. Blue wavy icons: generic binding proteins, yellow arrows: generic enzymes, green arrows: regulators. Blue dots: under-represented, Red dots: over-represented. The complete legend can be found at: http://ntp.niehs.nih.gov/ntp/ohat/diabetesobesity/Wkshp/MC_legend.pdf.

References

    1. Meyer TW, Hostetter TH. Uremia. N Engl J Med. 2007;357(13):1316–1325. - PubMed
    1. Almeras C, Argilés A. The general picture of uremia. Semin Dial. 2009;22(4):329–333. - PubMed
    1. Pagels AA, Söderkvist BK, Medin C, Hylander B, Heiwe S. Health-related quality of life in different stages of chronic kidney disease and at initiation of dialysis treatment. Health Qual Life Outcomes. 2012;10(1):71. - PMC - PubMed
    1. Weiner DE. Public health consequences of chronic kidney disease. Clin Pharmacol Ther. 2009;86(5):566–569. - PMC - PubMed
    1. Vanholder R, Baurmeister U, Brunet P, Cohen G, Glorieux G, Jankowski J. A bench to bedside view of uremic toxins. J Am Soc Nephrol. 2008;19(5):863–870. - PubMed

Publication types

Associated data