
Induced pluripotent stem cells from patients with Huntington's disease show CAG-repeat-expansion-associated phenotypes

HD iPSC Consortium. Cell Stem Cell. .

Abstract

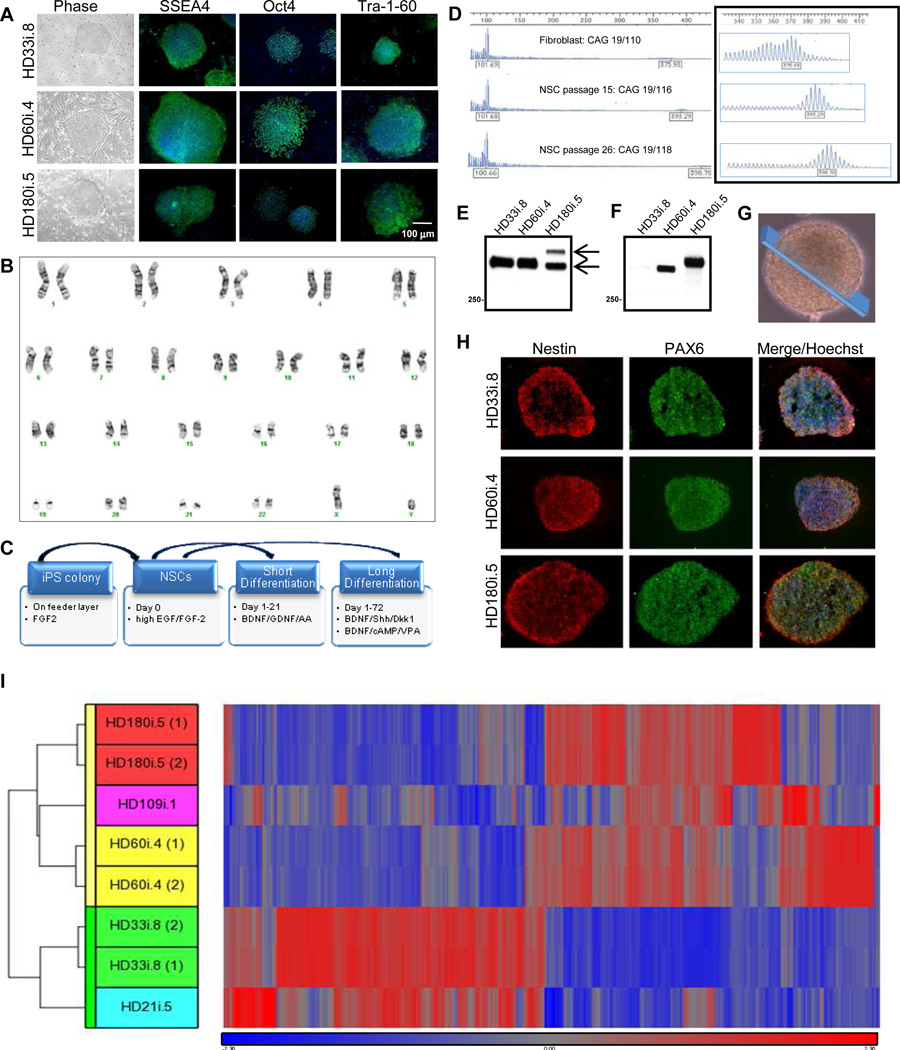
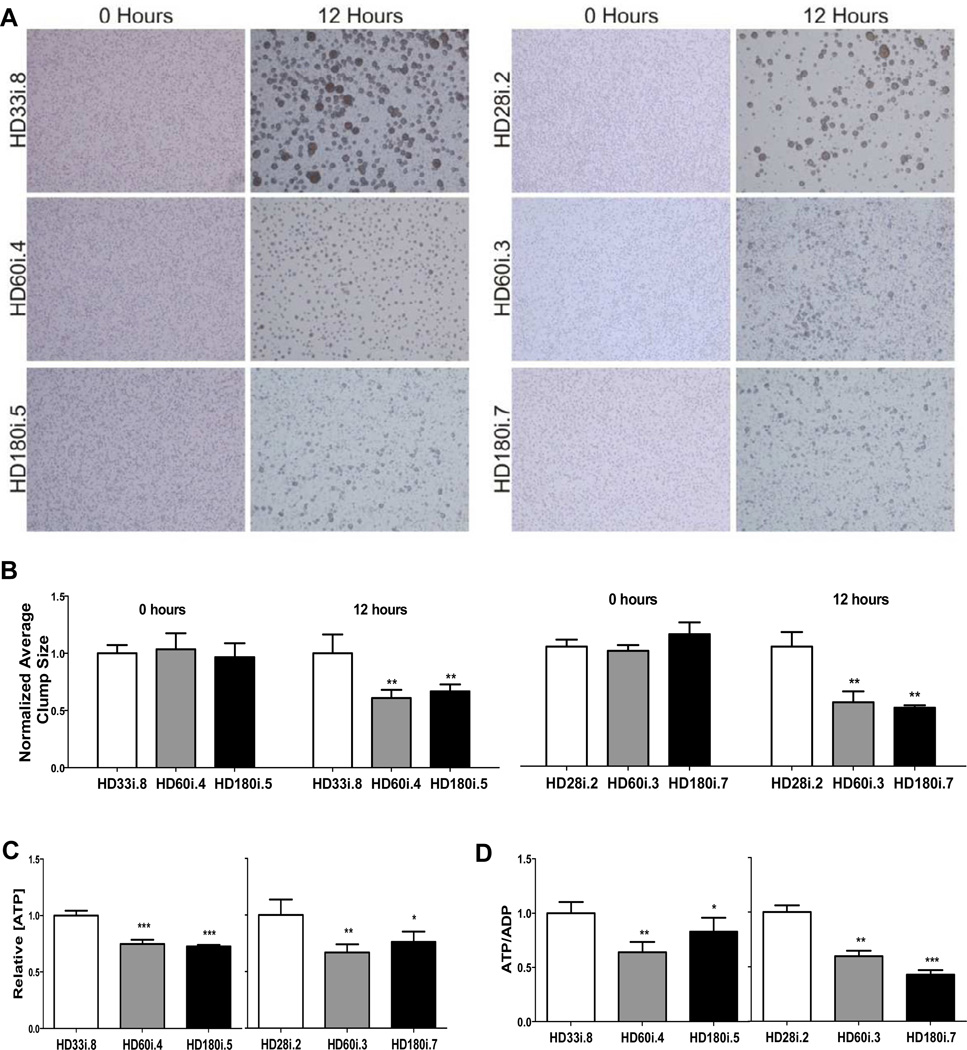
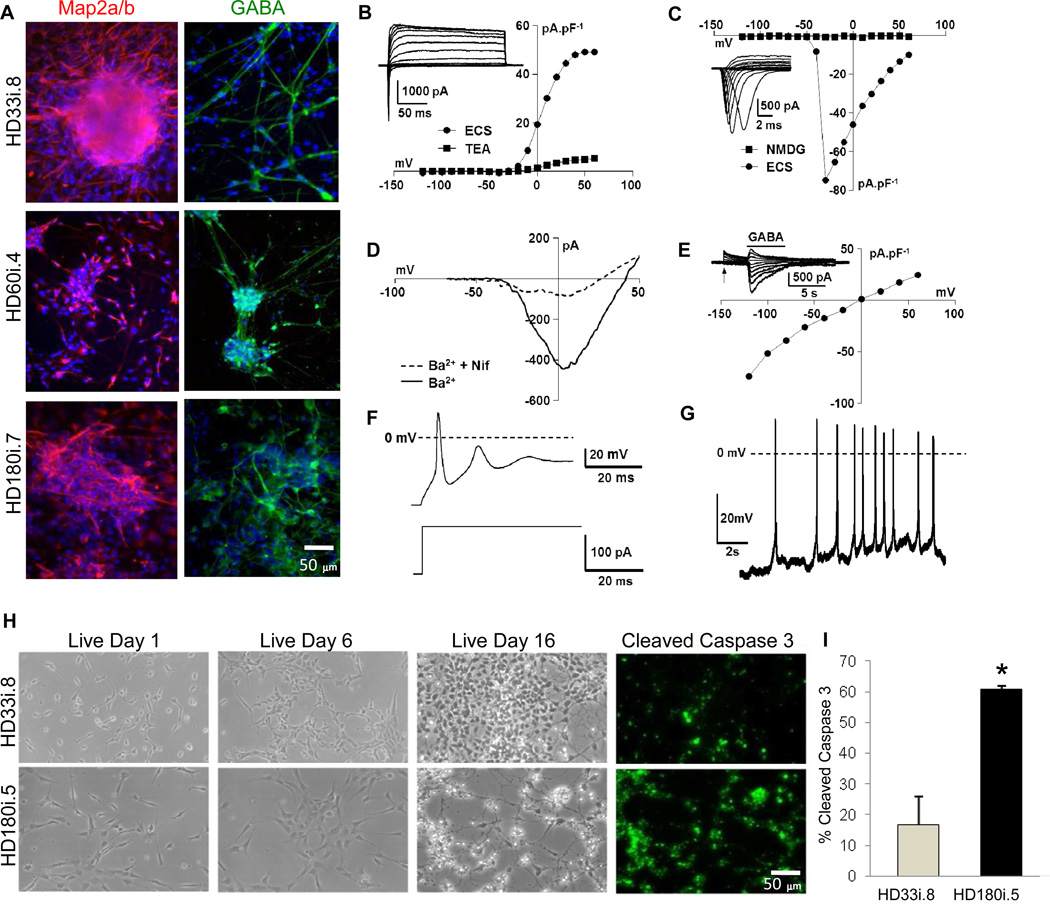
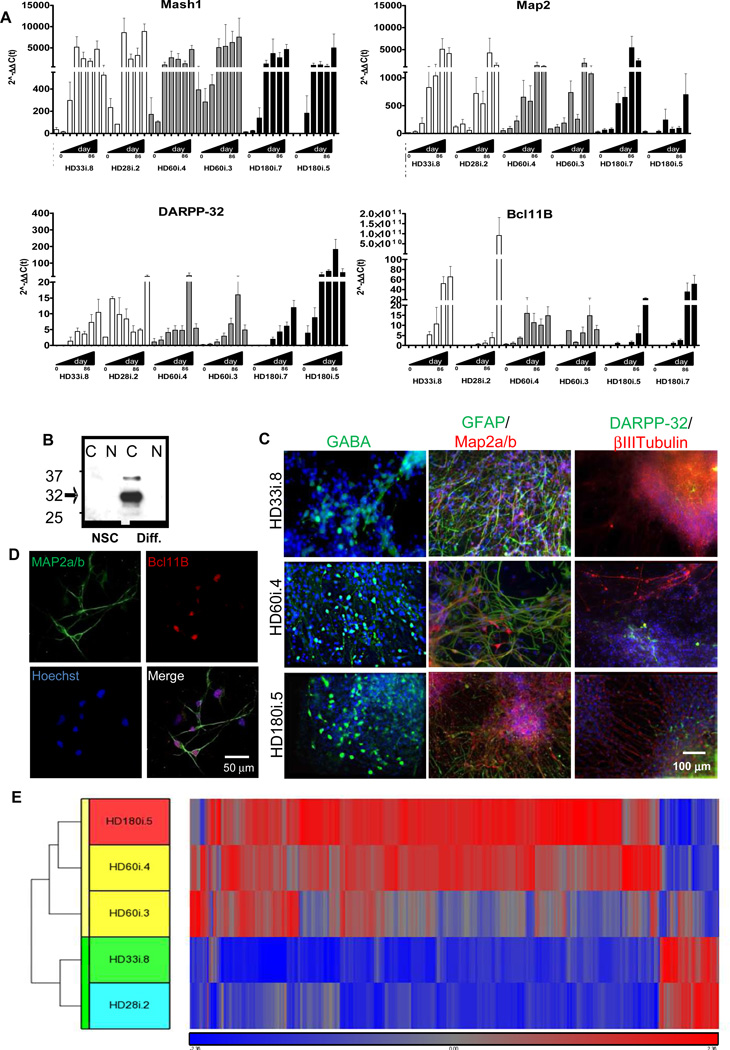
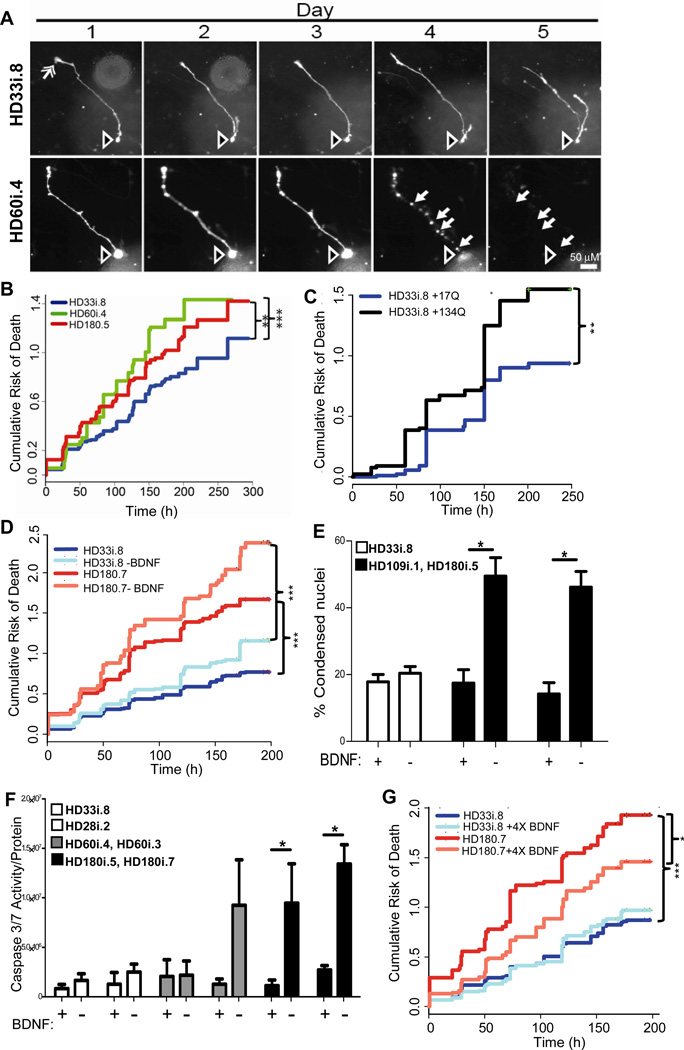
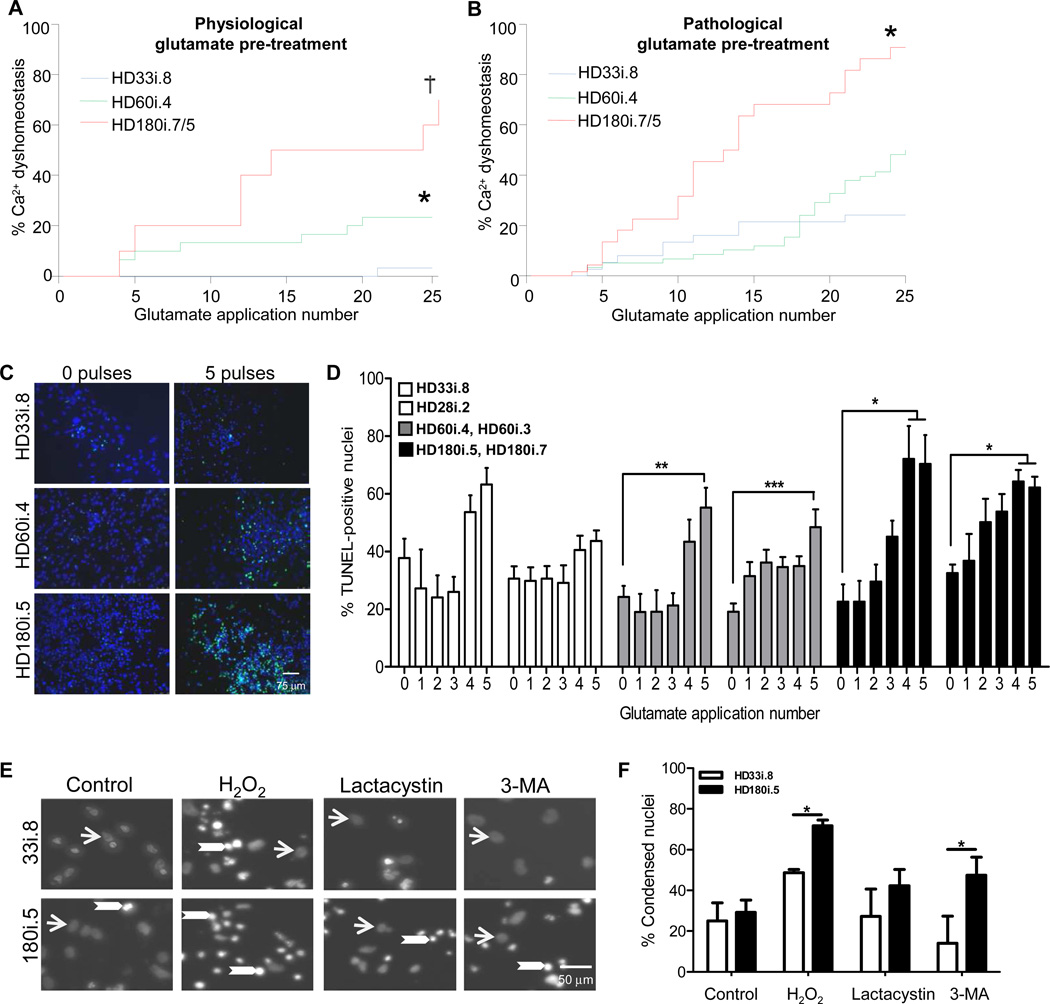
Huntington's disease (HD) is an inherited neurodegenerative disorder caused by an expanded stretch of CAG trinucleotide repeats that results in neuronal dysfunction and death. Here, The HD Consortium reports the generation and characterization of 14 induced pluripotent stem cell (iPSC) lines from HD patients and controls. Microarray profiling revealed CAG-repeat-expansion-associated gene expression patterns that distinguish patient lines from controls, and early onset versus late onset HD. Differentiated HD neural cells showed disease-associated changes in electrophysiology, metabolism, cell adhesion, and ultimately cell death for lines with both medium and longer CAG repeat expansions. The longer repeat lines were however the most vulnerable to cellular stressors and BDNF withdrawal, as assessed using a range of assays across consortium laboratories. The HD iPSC collection represents a unique and well-characterized resource to elucidate disease mechanisms in HD and provides a human stem cell platform for screening new candidate therapeutics.


Figures

Figure 1
Figure 1. HD Fibroblasts are Reprogrammed into Karyotypically Normal iPSCs that Generate NSCs
(A) All reprogrammed lines form colonies (brightfield) and express the pluripotency markers Oct4, Tra-1-60 and SSEA4 by immunocytochemistry (ICC). (B) G-banding showed that the HD180i.5 line had a normal karyotype, which was representative of all lines at the colony and NSC stages. (C) Schematic of the different differentiation protocols used. (D) CAG repeat analysis in HD109i.1 fibroblasts and NSCs over 26 passages showed a small increase in repeat length over time. (E) Western blots of HTT expression in iPSC-derived NSCs with the HTT antibody 2166 demonstrate normal (bottom arrow) and mutant (top arrow) HTT (epitope: amino acids 441–455). (F) Western blots of polyglutamine expressionin iPSC-derived NSCs using the IC2 antibody demonstrates mutant HTT with expanded repeats in the HD-derived lines. (G) Representative image of a NSC sphere demonstrating the section sampled for (H). (H) HD iPSC-derived NSCs can be expanded as spherical aggregates in a self-renewing condition. ICC on cryosections of NSC aggregates demonstrated a consistent expression of the neural progenitor markers PAX6 and nestin in the three lines. (I) Hierarchical clustering of top 1601 genes from NSCs is represented by the vertical bars (yellow for HD and green for control). The dataset shows that HD and control NSC lines are separated into two clusters, confirming the differential expression of these genes into the two categories.
Figure 2
Figure 2. NPCs with Expanded CAG Alleles Exhibit Altered Energetic and Cell-Cell Adhesion
(A) Representative micrographs demonstrating similar dispersion of NPCs at time 0, for all genotypes, and cell-cell clusters formed at 12 hours, which were larger with shorter CAG alleles, compared to NPCs with longer CAG alleles. (B) Quantitative analysis of average NPC cluster size at time 0 and 12 hours, showing a significant difference at the 12 hour time point between the shorter CAG (HD33i.8 and HD28i.2) versus the longer CAG (HD60i.4, HD60i.3, HD180i.5 and HD180i.7) alleles, consistent with decreased cell adhesion. (C) The relative intracellular [ATP] values were decreased in NPCs with longer CAG alleles (HD60i.4, HD60i.3, HD180i.5 and HD180i.7) compared to those with shorter CAG alleles (HD33i.8 and HD28i.2). (D) The relative intracellular [ATP/ADP] ratio for the longer CAG alleles (HD60i.3, HD60i.4, HD180i.5 and HD180i.7) was significantly decreased compared to NPCs with shorter CAG alleles (HD33i.8 and HD28i.2). All graphs show plotted cell values normalized to the low CAG allele controls. Error bars indicate S.D., p values are indicated as less than * 0.05, ** 0.01 and *** 0.001.
Figure 3
Figure 3. iPSCs can be Differentiated into Mature, Electrophysiologically Active Neurons Susceptible to Glutamate Toxicity
(A) HD180i, HD60i and HD33i lines differentiated for 14 days were positive for MAP2a/b and GABA (Scale bar 50µm). (B) Current density (pA.pF−1) versus voltage (mV) relationships for the outward, voltage-activated currents of the exemplar conventional whole-cell recording shown in the inset in normal extracellular solution (ECS) and after isoosmotic addition of 20 mM tetraethylammonium chloride (TEA). Holding potential = −70 mV. (C) Current density (pA.pF−1) versus voltage (mV) relationships for the inward, voltage-activated currents of the same cell as in (B) in the presence of ECS and after isoosmotic replacement of Na+ with N-methyl D glutamine (NMDG). The exemplar family of Na+ currents in the inset was recorded in the presence of 20 mM TEA and is displayed on a fast time base. Holding potential = −70 mV. (D) Current (pA) versus voltage (mV) relationships, evoked using a voltage-ramp protocol, for currents carried by Ba2+ (27 mM, isoosmotic replacement of NaCl, Ba2+) in the absence and presence of 2 mM of the Ltype Ca2+ channel blocker, nifedipine (Ba2+ + Nif). Holding potential = −110 mV. (E) Current density (pA.pF−1) versus voltage (mV) relationship for Cl currents activated by 300 mM GABA. The inset shows a family of GABA-activated currents recorded at the voltages shown in the main panel; GABA application is indicated by the bar above the traces shown and the voltage was stepped from −60mV to the voltages indicated in the main panel at the point indicated by the arrow. Holding potential = −70 mV. (F) Typical evoked action potential (upper trace) recorded under current-clamp in the conventional whole-cell patch-clamp configuration during the current injection shown in the lower trace (from 0 to + 120 pA). (G) Example of spontaneous action potential activity recorded under current-clamp (I = 0 mV) in the conventional whole-cell patch-camp configuration. (H,I) Staining for cleaved caspase 3 revealed increased apoptotic death in the HD180i.5 line over time compared with the control line HD33i.8 (p< 0.05, Students t-test).
Figure 4
Figure 4. iPSCs can be Differentiated into a Striatal-like Phenotype
(A) qRT-PCR from day 0 (NSC stage) to 86 using the long differentiation protocol for HD180i.5/7, HD60i.3/4 and HD28i.2/HD33i.8 demonstrates that neural (Mash1), neuronal (Map2) and striatal-specific (DARPP- 32 and Bcl11B) genes upregulate overtime. (B) Western blots for DARPP-32 in HD109i.1 NSCs and differentiated cells also show up-regulation in the cytoplasmic (C) but not nuclear fraction (N) upon differentiation. (C) HD180i, HD60i and HD33i cells differentiated for 56 days expressed βIII-Tubulin (immature neuron), DARPP-32 (striatal), GFAP (glia), Map2a/b (mature neuron) and GABA (GABAergic neuron). Nuclei stained with Hoechst. (D) HD109i.1 cells can be differentiated into mature, striatal-like neurons that express Map2a/b and Bcl11B. (E) Hierarchical clustering of top of 787 genes from striatal-like cells is represented by the vertical bars (yellow for HD and green for control). The dataset shows that most genes are up-regulated in the HD lines and that they can be separated into two defined clusters.
Figure 5
Figure 5. HD iPSCs Show Increased Risk of Death Over Time in Culture and Following Trophic Factor Withdrawal
(A) Examples from a time series of images of two differentiated cells at day 35 from the HD33i.8 and HD60i.4 lines. Often cell bodies (hollow arrow, top and bottom rows) extend 1–3 processes, which are tipped by structures resembling growth cones (solid arrow, upper row, day 1). Degeneration and cell death were evident (bottom row, compare days 3–5) from the blebbing and retraction of neurites (closed arrows) and the loss of the cell soma (open arrow). Scale bar = 50 µm. (B) Kaplan-Meier analysis revealed that the cumulative risk of death was higher for the 180i.5 (hazard ratio is 1.4, p<0.01, n=337 cells) and the HD60i.4 (hazard ratio is 1.5, p<0.001, n=164 cells) lines compared to the HD33i.8 (n=248 cells) line. Total n=750 cells; 6 experiments for HD60i.4, 7 for HD180i.5 and 8 for HD33i.8. (C) The cumulative risk of death is significantly increased in HD33i.8 cells over-expressing (by plasmid transfection) 134 CAG repeats (94 cells) compared to cells over-expressing 17 CAG repeats (92 cells). P<0.01, hazard ratio is 1.7, n=2 experiments. (D) The risk of death was significantly higher for the HD180i.7 line (195 cells) grown in BDNF compared to the HD33i.8 line (134 cells) grown in BDNF. Hazard ratio is 2.1 (p<0.001). After BDNF removal, the risk of death was significantly greater for the HD180i.7 line (156 cells) compared to the HD33i.8 line (n=191 cells), the hazard ratio is 2.56 (p<0.001). Removal of BDNF did not significantly increase the risk of death for the HD33i.8 and HD180i.7 lines compared to the lines grown in BDNF, however the increased risk of death for the HD180i.7 line after BDNF removal approached significance, p=0.08, hazard ratio=1.22, n=4 experiments. (E) BDNF was withdrawn for 48 hours, and cells were fixed and labeled with Hoechst. Quantifying condensed nuclei as a measure of cell toxicity showed that both HD109i.1 and HD180i.5 lines had significantly more cell death after BDNF withdrawal, whereas the HD33i.8 control line showed no change. ANOVA;* indicates p<0.01. (F) Quantifying caspase 3/7 after BDNF was withdrawn for 24 hours showed that both clones of the HD180i line demonstrated significant increases in caspase 3/7 activity. In addition to BDNF withdrawal, dbcAMP and VPA were removed from the medium as they increase endogenous BDNF transcription (Pruunsild et al., 2011). (G) Addition of 4X BDNF reduced the cumulative risk of death for HD180i.7. The risk of death is significantly less for the HD180i.7 line plus 4X BDNF (108 cells) compared to the HD180i.7 line alone (182 cells) (p<0.001). The hazard ratio is 0.67. There is no difference in the cumulative risk of death between the HD33i.8 line (208 cells) that received 4X BDNF (156 cells) p=0.43. The hazard ratio is 1.06, n=4 experiments.
Figure 6
Figure 6. HD iPSCs have Increased Vulnerability to Stress and Toxicity
(A) Using the short differentiation protocol, Ca2+ dysfunction was significantly elevated in the HD lines compared to the HD33i.8 line (* p< 0.02; p <0.001). (B) As (A) except following a 14-day chronic pre-treatment with pathological glutamate (150 µM). Significantly different from *HD33i.8 p< 0.005; † HD60i.4 p< 0.0001. (C) Images demonstrate TUNEL-positive nuclei (green) and total nuclei (blue) in HD and control lines after exposure to no glutamate or 5 glutamate pulses. (D) HD iPSCs were differentiated for 56 days before repeated 30-minute pulses (0–5) with 50 µM glutamate. Cells were allowed to rest 24 hours before analyzing cell death. Compared to 0 glutamate pulses, TUNEL staining was significantly increased in both clones of the HD180i line after 4 or 5 glutamate pulses and in both clones of the HD60i line after 5 glutamate pulses. The control lines showed no significant increase after 5 pulses using a one-way ANOVA with Bonferroni post-test. (E) Images demonstrate non-condensed nuclei (arrows) and bright condensed nuclei (arrowheads) in HD180i.5 and HD33i.8 differentiated iPSCs in either non-treated media or media treated with 300 µM H2O2, 10 µM lactacystin or 5 mM 3-MA. (F) Nuclear condensation assay shows enhanced toxicity of HD180i.5 cells compared to control HD33i.8 cells upon treatment with H2O2 or 3-MA. *Significantly different (p<0.05).

References

    1. Apostol BL, Simmons DA, Zuccato C, Illes K, Pallos J, Casale M, Conforti P, Ramos C, Roarke M, Kathuria S, et al. CEP-1347 reduces mutant huntingtin-associated neurotoxicity and restores BDNF levels in R6/2 mice. Mol Cell Neurosci. 2008;39:8–20. - PubMed
    1. Arrasate M, Finkbeiner S. Automated microscope system for determining factors that predict neuronal fate. Proc Natl Acad Sci U S A. 2005;102:3840–3845. - PMC - PubMed
    1. Arrasate M, Mitra S, Schweitzer ES, Segal MR, Finkbeiner S. Inclusion body formation reduces levels of mutant huntingtin and the risk of neuronal death. Nature. 2004;431:805–810. - PubMed
    1. Aubry L, Bugi A, Lefort N, Rousseau F, Peschanski M, Perrier AL. Striatal progenitors derived from human ES cells mature into DARPP32 neurons in vitro and in quinolinic acid-lesioned rats. Proc Natl Acad Sci U S A. 2008;105:16707–16712. - PMC - PubMed
    1. Bae BI, Xu H, Igarashi S, Fujimuro M, Agrawal N, Taya Y, Hayward SD, Moran TH, Montell C, Ross CA, et al. p53 mediates cellular dysfunction and behavioral abnormalities in Huntington's disease. Neuron. 2005;47:29–41. - PubMed

Publication types

MeSH terms

Associated data