. 2015 Nov;25(11):1692-702.
doi: 10.1101/gr.182675.114. Epub 2015 Aug 20.

Extensive cross-regulation of post-transcriptional regulatory networks in Drosophila

Affiliations

Extensive cross-regulation of post-transcriptional regulatory networks in Drosophila

Marcus H Stoiber et al. Genome Res. 2015 Nov.

Abstract

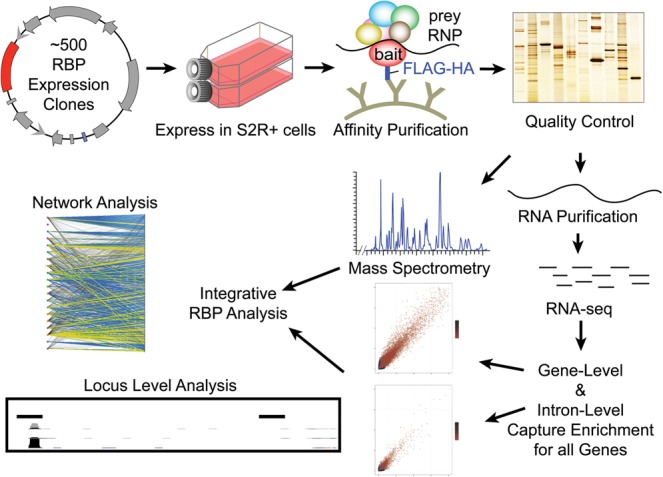
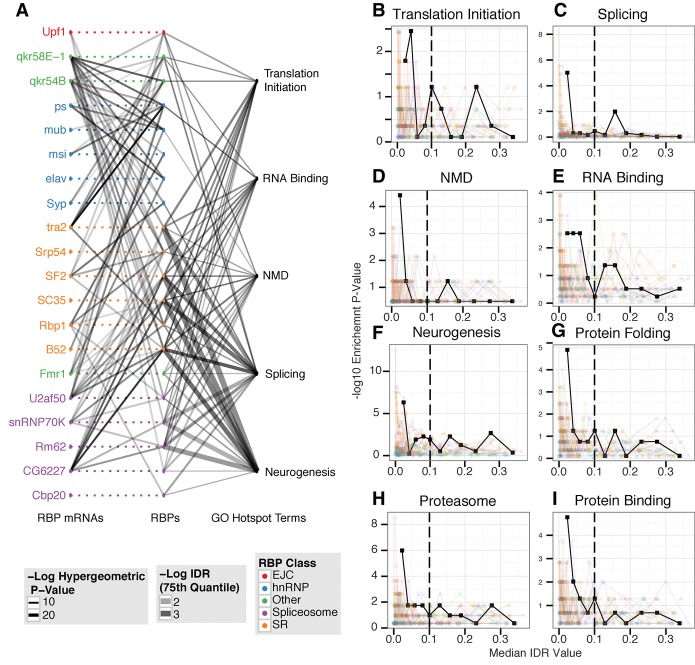
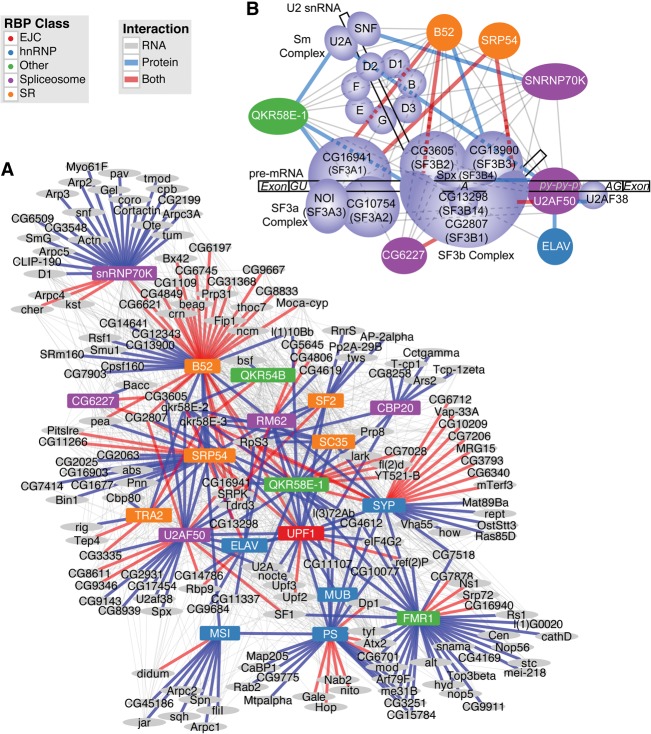
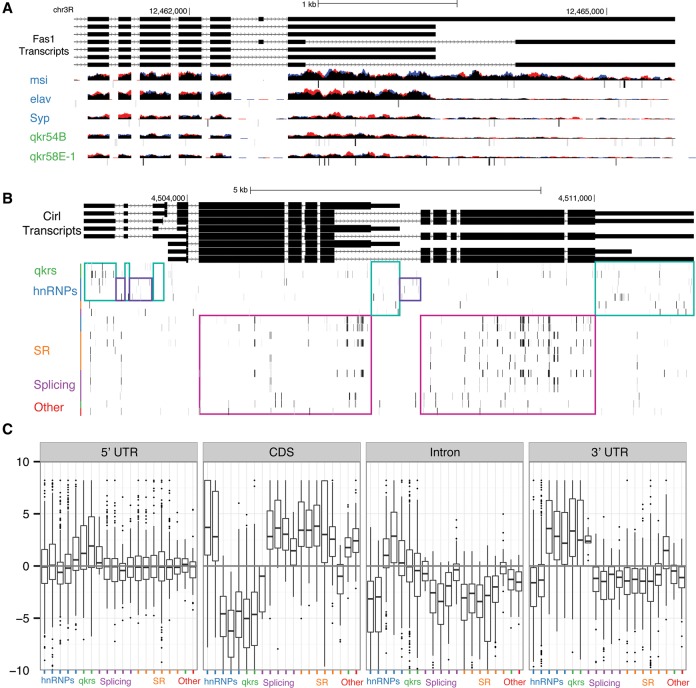
In eukaryotic cells, RNAs exist as ribonucleoprotein particles (RNPs). Despite the importance of these complexes in many biological processes, including splicing, polyadenylation, stability, transportation, localization, and translation, their compositions are largely unknown. We affinity-purified 20 distinct RNA-binding proteins (RBPs) from cultured Drosophila melanogaster cells under native conditions and identified both the RNA and protein compositions of these RNP complexes. We identified "high occupancy target" (HOT) RNAs that interact with the majority of the RBPs we surveyed. HOT RNAs encode components of the nonsense-mediated decay and splicing machinery, as well as RNA-binding and translation initiation proteins. The RNP complexes contain proteins and mRNAs involved in RNA binding and post-transcriptional regulation. Genes with the capacity to produce hundreds of mRNA isoforms, ultracomplex genes, interact extensively with heterogeneous nuclear ribonuclear proteins (hnRNPs). Our data are consistent with a model in which subsets of RNPs include mRNA and protein products from the same gene, indicating the widespread existence of auto-regulatory RNPs. From the simultaneous acquisition and integrative analysis of protein and RNA constituents of RNPs, we identify extensive cross-regulatory and hierarchical interactions in post-transcriptional control.


Figures

Figure 1.
Figure 1.
Data production and processing. The data processing pipeline is described here, starting from transfection of RNA-binding proteins into S2R+ cells. Immunoprecipitation is then performed to pull down ribonucleoprotein particles (RNPs). The protein and RNA components of the RNPs are then separated and measured with MS/MS and RNA sequencing. These data are then analyzed together at global and local levels.
Figure 2.
Figure 2.
RBP-RNA–binding network. (A) This plot presents a global view of the RNA–protein interaction network. Each point in the center column represents an RBP (RIP-seq experiment). Corresponding points on the left represent each RBP's mRNA. Dashed lines represent hypothetical binding events that cannot be observed due to the overexpressed background. Lines join an RBP and an RBP's mRNA if significant binding is observed (Methods), and the lines are shaded according to the strength of binding (−log IDR value) for this interaction. Points on the right represent the set of genes annotated with the corresponding hotspot GO term. Lines are drawn between an RBP and a hotspot GO term if the bound set of RNAs significantly overlaps (P < 0.01) the GO term set. The thickness of these lines represents the significance of the overlap between the corresponding sets of RNAs. The shading of these lines indicates the binding strength of this set of bound RNAs (defined as the 75th percentile of the –log IDR values for the bound RNAs). (BI) HOT RNAs are driven by the most enriched RNAs. Each plot represents the enrichment for a single hotspot GO term gene set across all experiments. The one solid line represents the median IDR value for each RNA for of all RBPs, and each transparent line represents a single RBP. Each point represents 100 RNAs binned by IDR value in increasing order. The y-value for each point represents the −log hypergeometric P-value for the overlap between the 100 bound RNAs and the GO term gene set. Each plot represents the “down-the-rank-list” enrichment for a particular hotspot GO term: (B) translation initiation, (C) splicing, (D) NMD, (E) RNA binding, (F) neurogenesis, (G) protein folding, (H) proteasome, and (I) protein binding.
Figure 3.
Figure 3.
RBP–protein–RNA interactions. (A) Plot represents combined interactions between RBPs and all proteins pulled down in at least one experiment, as well as their corresponding transcripts. Edges are drawn where an RBP participates in an interaction with a gene. Gray lines indicate RBP–RNA interactions; blue lines, RBP–protein interactions; and red lines, both interactions with the same gene. (B) Diagram of the U2 snRNP (adapted from Kotake et al. 2007), showing the interactions between core proteins of the U2 snRNP and the RBPs from this study. Only those RBPs involved in protein–protein interactions are presented. The U2 snRNP is composed of U2 snRNA, the SF3a and SF3b splicing complexes, and the Sm proteins. Lavender-colored proteins are components of the U2 snRNP (along with U2AF50). RBPs from this study are colored according to their primary class designation used consistently throughout the article. Lines indicate the type of interaction as in A.
Figure 4.
Figure 4.
Gene structure binding. (A) The 3′ UTR region of the Fas1 locus, where we observe MSI binding specifically to the 3′ UTR extended isoform. It has been previously reported that this 3′ UTR extension is controlled by ELAV. (B) Cirl is a hotspot RNA in our analysis (bound by, in order of lowest to highest IDR value, SRP54, U2AF50, B52, RBP1, RM62, CG6227, MUB, TRA2, QKR58E-1, PS, and SNRNP70K). We note that motifs hits cluster in the gene structure regions. (C) This plot represents the enrichment of each RBP's motif along gene structure (5′ UTR, CDS, 3′ UTR). The annotation was collapsed into regions that are only observed as a particular gene structure. Significant motif k-mers (top 1% most likely k-mers given the RBP PWM) are then identified across the transcriptome and overlapped with the gene structure. Each point represents the enrichment of motif-hit proportion within a gene element over the length of the gene structure element at the locus. Note that only enriched loci for each RBP with at least 20 motif hits are plotted.
Figure 5.
Figure 5.
Retained intron signal in the data. (A) The number of intron and gene level targets is represented for each RBP on the y- and x-axes, respectively. The amount of overlap between each RBP's intron and gene level targets, as measured by the Jaccard index at the locus level, is indicated by each point's size. (B) The Xrp1 locus is indicative of several genes that produce different cohorts of RBPs binding to different retained introns. The exon regions of reads are removed from this figure. The height of each sequence track is 20 bases per kilobase per million mapped reads. Red and blue portions of the tracks indicate biological replicates.

References

    1. Anders S, Huber W. 2010. Differential expression analysis for sequence count data. Genome Biol 11: R106. - PMC - PubMed
    1. Bailey TL, Elkan C. 1995. The value of prior knowledge in discovering motifs with MEME. Proc Int Conf Intell Syst Mol Biol 3: 21–29. - PubMed
    1. Bechara EG, Didiot MC, Melko M, Davidovic L, Bensaid M, Martin P, Castets M, Pognonec P, Khandjian EW, Moine H, et al. 2009. A novel function for fragile X mental retardation protein in translational activation. PLoS Biol 7: e16. - PMC - PubMed
    1. Boley N, Stoiber MH, Booth BW, Wan KH, Hoskins RA, Bickel PJ, Celniker SE, Brown JB. 2014. Genome-guided transcript assembly by integrative analysis of RNA sequence data. Nat Biotechnol 32: 341–346. - PMC - PubMed
    1. Brazao TF, Demmers J, van IW, Strouboulis J, Fornerod M, Romao L, Grosveld FG. 2012. A new function of ROD1 in nonsense-mediated mRNA decay. FEBS Lett 586: 1101–1110. - PubMed

Publication types

MeSH terms

Associated data