. 2012 Aug 24;47(4):633-47.
doi: 10.1016/j.molcel.2012.06.019. Epub 2012 Jul 26.

DNA methylation dynamics during in vivo differentiation of blood and skin stem cells

Affiliations

DNA methylation dynamics during in vivo differentiation of blood and skin stem cells

Christoph Bock et al. Mol Cell. .

Abstract

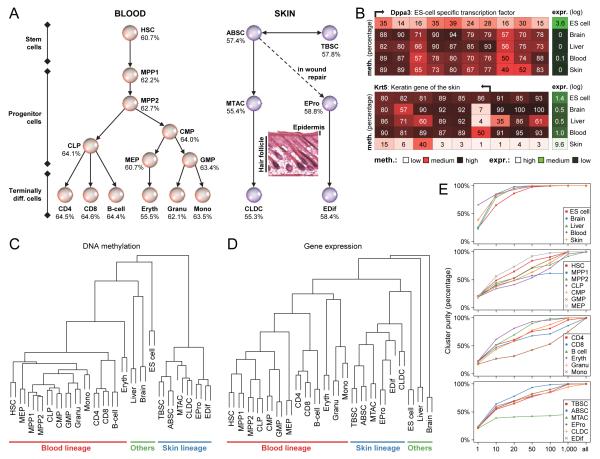
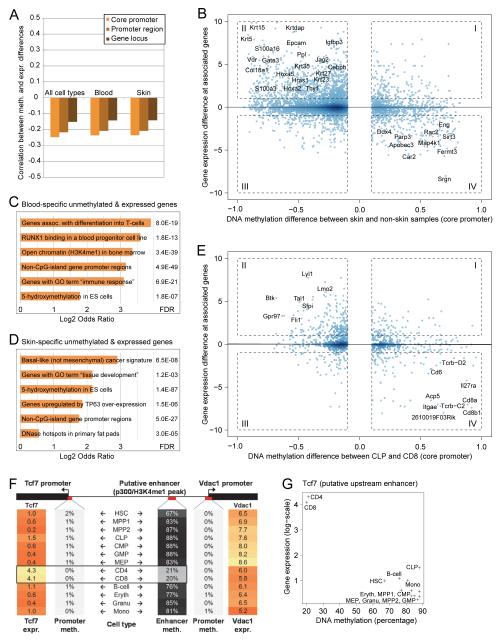
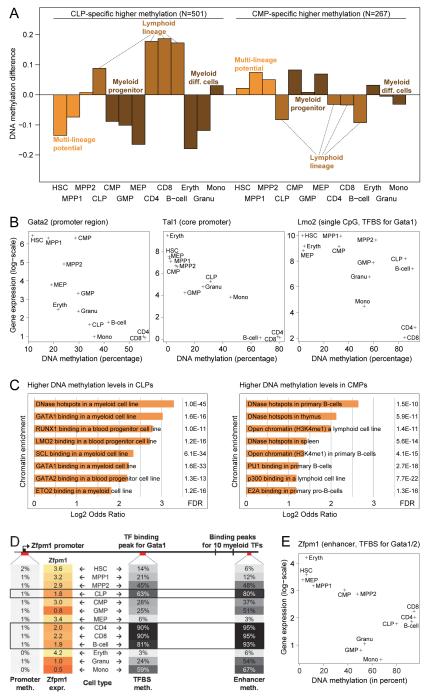
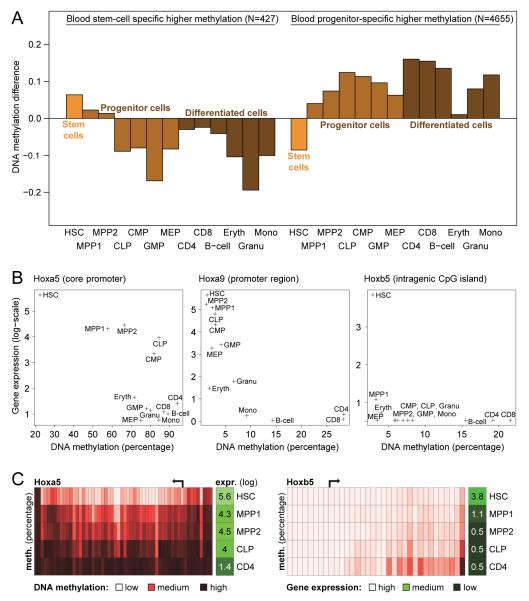
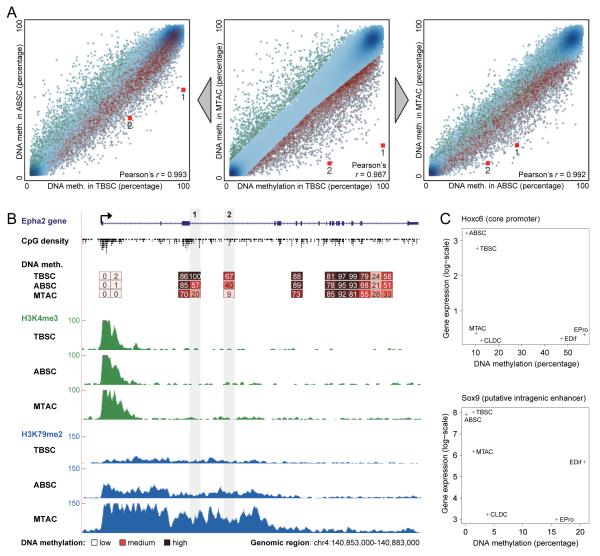
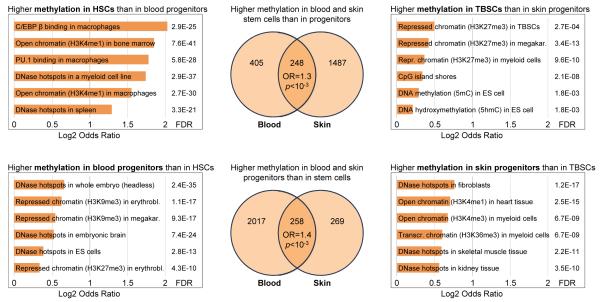
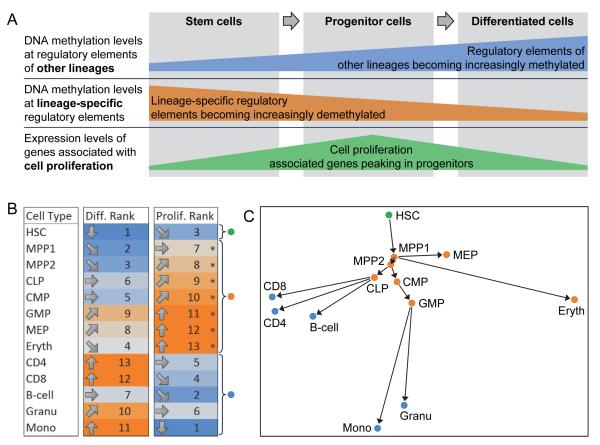
DNA methylation is a mechanism of epigenetic regulation that is common to all vertebrates. Functional studies underscore its relevance for tissue homeostasis, but the global dynamics of DNA methylation during in vivo differentiation remain underexplored. Here we report high-resolution DNA methylation maps of adult stem cell differentiation in mouse, focusing on 19 purified cell populations of the blood and skin lineages. DNA methylation changes were locus specific and relatively modest in magnitude. They frequently overlapped with lineage-associated transcription factors and their binding sites, suggesting that DNA methylation may protect cells from aberrant transcription factor activation. DNA methylation and gene expression provided complementary information, and combining the two enabled us to infer the cellular differentiation hierarchy of the blood lineage directly from genome-scale data. In summary, these results demonstrate that in vivo differentiation of adult stem cells is associated with small but informative changes in the genomic distribution of DNA methylation.


Figures

Figure 1
Figure 1
Genomic DNA methylation maps reflect cellular lineage choice and differentiation stage (A) Schematic drawing of adult stem cell differentiation in the blood and skin lineages: HSC, Hematopoietic stem cell; MPP1, Multipotent progenitor 1 (Flk2 negative); MPP2, Multipotent progenitor 2 (Flk2 positive); CLP, Common lymphoid progenitor; CMP, Common myeloid progenitor; GMP, Granulocyte-monocyte progenitor; MEP, Megakaryocyte-erythroid progenitor; CD4, T helper cell (CD4 positive); CD8, Cytotoxic T cell (CD8 positive); Eryth, Nucleated erythrocyte; Granu, Granulocyte; Mono, Monocyte; TBSC, Telogen (quiescent) bulge stem cell; ABSC, Anagen (activated) bulge stem cell; MTAC, Matrix/transit-amplifying cell; CLDC, Companion layer differentiated cell; EPro, Epidermis progenitor cell; EDif, Epidermis differentiated cell. Percentage values denote mean DNA methylation levels of 1-kilobase tiling regions with sufficient RRBS coverage across the genome. (B) High-resolution view of DNA methylation and gene expression for a TF that is specific to ES cells (Dppa3) and a skin-specific keratin gene (Krt5). Red boxes refer to single CpGs (regions are not drawn to scale), with mean DNA methylation levels of single CpGs shown as a percentage values. Green boxes denote expression levels on a truncated log scale ranging from 0 (minimal expression) to 10 (maximal expression). Genomic regions: Dppa3, chr15:101,536,000-101,546,000; Krt5, chr6:122,576,000-122,581,000. (C) Hierarchical clustering based on the mean DNA methylation levels of 1-kilobase tiling regions throughout the genome. In this type of clustering, the ordering of samples within a cluster or subtree is arbitrary and does not carry biological information. Here, within the constraints imposed by the data-derived clustering tree, cell types were ordered in the same way as in Supplementary Table 1. (D) Hierarchical clustering based on the expression levels of Ensembl-annotated genes throughput the genome. The ordering of samples was performed in the same way as in Figure 1C. (E) Percentage of DNA-methylation based clustering analyses in which all biological replicates of the listed cell types cluster more closely with each other than with any other sample. Each data point represents 1,000 hierarchical clustering analyses performed on random subsets of different sizes (x-axis) drawn from the data underlying Figure 1C.
Figure 2
Figure 2
DNA methylation and gene expression changes intersect at cell type specific genes (A) Correlation between differences in DNA methylation and in the expression of associated genes, focusing on differentially methylated regions in all cell types (left bars), among blood cells (center bars) and among skin cells (right bars). (B) Scatterplot of differences in DNA methylation and in the expression of associated genes between skin cells and nonskin samples (i.e. ES cells, brain tissue, liver tissue, blood cells). Genomic regions that exhibit a significant positive correlation (I and III) or negative correlation (II and IV) are shown in boxes and selected genes are highlighted. (C) Enrichment of genomic properties among regions exhibiting blood-specific reduced DNA methylation and an associated increase in gene expression (box II in Figure S4A). Full results are available from http://invivomethylation.computational-epigenetics.org/. (D) Enrichment of genomic properties among regions exhibiting skin-specific reduced DNA methylation and an associated increase in gene expression (box II in Figure 2B). (E) Scatterplot of differences in DNA methylation and in the expression of associated genes between two lymphoid cell types (CLP and CD8). (F) Interplay of DNA methylation and gene expression at the Tcf7-Vdac1 gene locus. Expression of the Tcf7 gene is specific to T-cells (left orange column), while Vdac1 is a widely expressed house-keeping gene (right orange column). The promoters of Tcf7 and Vdac1 are unmethylated in all cell types (left and right columns in grey). In contrast, a putative enhancer located upstream of Tcf7 and Vdac1 (Figure S1B) is specifically unmethylated in T-cells (black column). (G) Correlation between DNA methylation levels of the putative Tcf7 enhancer highlighted in Figure 2F and the expression levels of the Tcf7 gene within the blood lineage. Genomic region: chr1:3,027,000-3,028,000.
Figure 3
Figure 3
Myeloid TFs and their binding sites become methylated in lymphoid cells (A) DNA methylation of genomic regions that are differentially methylated between CLPs and CMPs. Focusing only on regions that are significantly more highly methylated in CLPs than in CMPs (left) or vice versa (right), the diagram shows these regions’ mean DNA methylation levels for all cell types of the blood lineage. To be able to plot multiple regions with different DNA methylation levels on the same scale, DNA methylation levels (y-axis) are shown as absolute differences relative to the mean methylation levels of CLPs and CMPs in each genomic region. (B) Correlation between DNA methylation and expression levels at myeloid transcription-regulatory genes within the blood lineage. Shown are the mean DNA methylation levels (x-axis) of the 1-kilobase tiling regions that exhibit the highest association with the genes’ expression levels (y-axis). Genomic regions: Gata2, chr6:88,150,000-88,151,000; Tal1, chr4:114,732,000-114,733,000; Lmo2, chr2:103,798,108-103,798,109. (C) Enrichment of genomic properties among regions that are significantly more highly methylated in CLPs than in CMPs (left) or vice versa (right). (D) Interplay of DNA methylation and gene expression at the Zfpm1 gene locus. Lymphoid-specific reduced expression of the Zfpm1 gene is associated with increased DNA methylation levels at an intronic Gata1 binding site (center) and also at a putative enhancer element further toward the 3′ end of the gene (right). This putative enhancer overlaps with ChIP-seq binding peaks of multiple myeloid TFs, namely Gata1, Gata2, Lmo2, Lyl1, Runx1, Tal1, Erg, Fli1, Gfi1b and Meis1. (E) Correlation between DNA methylation levels of the putative Zfpm1 enhancer highlighted in Figure 3D and the expression levels of the Zfpm1 gene within the blood lineage. Genomic region: chr8:124,833,000-124,834,000.
Figure 4
Figure 4
Blood stem cell differentiation coincides with specific DNA demethylation of hematopoietic regulator genes (A) DNA methylation of genomic regions that are differentially methylated between blood stem cells (HSCs) and progenitor cells (MPP1, MPP2, CLP, CMP, GMP, MEP). Focusing only on genomic regions that are significantly more highly methylated in stem cells than in progenitor cells (left) or vice versa (right), the diagram shows these regions’ mean DNA methylation levels for all cell types of the blood lineage. DNA methylation levels (y-axis) are shown as absolute differences relative to the mean methylation levels of HSCs and the average of all progenitor cells in each genomic region. (B) Correlation between DNA methylation and gene expression levels at homeobox genes within the blood lineage. Genomic regions: Hoxa5, chr6:52,154,000-52,155,000; Hoxa9, chr6:52,178,000-52,179,000; Hoxb5, chr11:96,166,000-96,167,000. (C) Single-basepair resolution view of DNA methylation and gene expression for the Hoxa5 and Hoxb5 genes. The format is the same as in Figure 1B. Genomic regions: Hoxa5, chr6:52,151,500-52,155,000; Hoxb5, chr11:96,164,500-96,168,500.
Figure 5
Figure 5
Skin stem cells undergo epigenetic remodeling upon cell cycle activation and upon differentiation (A) Pairwise scatterplots of DNA methylation observed in skin stem cells (TBSC, ABSC) and skin progenitor cells (MTAC). Genomic regions that were significantly more highly methylated in TBSCs than in MTACs are highlighted in red across all three diagrams, and genomic regions that were significantly less methylated in TBSCs than in MTACs are highlighted in green. Numbered red squares highlight two specific genomic regions that are displayed in detail in Figure 5B. (B) DNA methylation and histone modifications at the Epha2 gene locus. Red boxes refer to 1-kilobase genomic regions, with the mean DNA methylation level of each region shown as a percentage value. The frequency plots display ChIP-seq read counts of the promoter-associated histone modification H3K4me3 (green) and the transcription-associated histone modification H3K79me2 (blue) across the locus, based on published ChIP-seq data (Lien et al., 2011). Genomic region: chr4:140,853,000-140,883,000. (C) Correlation between DNA methylation and gene expression levels at the Hoxc6 and Sox9 genes within the skin lineage. Genomic regions: Hoxc6, chr15:102842000-102843000; Sox9, chr11:112,646,000-112,647,000.
Figure 6
Figure 6
Stem cells and progenitors exhibit characteristic DNA methylation signatures Magnitude of overlap and enrichment of genomic properties among regions that are consistently more highly methylated in stem cells (top row) or in progenitor cells (bottom row) of the blood and skin lineages. Differences between blood stem cells (HSCs) and progenitor cells (MPP1, MPP2, CLP, CMP, GMP, MEP) were compared to differences between quiescent skin stem cells (TBSCs) and progenitor cells (MTACs), and the significance of overlap was assessed by the odds ratio (OR) and Fisher’s exact test (p). The total numbers of genomic regions in the Venn diagrams are lower than in the separate analyses of the blood and skin lineages because fewer regions fulfill the minimum coverage filtering across all cell types.
Figure 7
Figure 7
Cellular lineage hierarchies can be inferred from DNA methylation maps and gene expression profiles (A) Schematic drawing summarizing trends in the DNA methylation and gene expression data that were observed among the blood and skin lineages. The size of the blue, orange and red bars are not drawn to scale, i.e. they do not attempt to quantify what percentage of regulatory regions and genes are methylated or expressed in each cell type. (B) Differentiation and proliferation ranking of all analyzed blood cell types. The cell type with the lowest differentiation rank was tagged in green (“stem cell”), all cell types with proliferation scores above the mean (indicated by asterisks) were tagged in orange (“progenitor cells”), and all remaining cell types were tagged in blue (“terminally differentiated cells”). (C) Blood lineage hierarchy inferred from genomic data. Similarities and differences between the DNA methylation and gene expression profiles among cell types were projected onto a two-dimensional map, each cell type was colored following the classification in Figure 7B, and the points were connected by arrows according to a method for data-driven lineage inference described in the Experimental Procedures.

References

    1. Adolfsson J, Mansson R, Buza-Vidas N, et al. Identification of Flt3+ lympho-myeloid stem cells lacking erythro-megakaryocytic potential a revised road map for adult blood lineage commitment. Cell. 2005;121:295–306. - PubMed
    1. Bird A. DNA methylation patterns and epigenetic memory. Genes Dev. 2002;16:6–21. - PubMed
    1. Blanpain C, Lowry WE, Geoghegan A, et al. Self-renewal, multipotency, and the existence of two cell populations within an epithelial stem cell niche. Cell. 2004;118:635–648. - PubMed
    1. Bock C, Kiskinis E, Verstappen G, et al. Reference Maps of Human ES and iPS Cell Variation Enable High-Throughput Characterization of Pluripotent Cell Lines. Cell. 2011;144:439–452. - PMC - PubMed
    1. Bock C, Tomazou EM, Brinkman AB, et al. Quantitative comparison of genome-wide DNA methylation mapping technologies. Nat Biotechnol. 2010;28:1106–1114. - PMC - PubMed

Publication types

Associated data