. 2023 Nov 18;14(1):7501.
doi: 10.1038/s41467-023-43077-6.

Transcriptome-wide association analyses reveal the impact of regulatory variants on rice panicle architecture and causal gene regulatory networks

Affiliations

Transcriptome-wide association analyses reveal the impact of regulatory variants on rice panicle architecture and causal gene regulatory networks

Luchang Ming et al. Nat Commun. .

Abstract

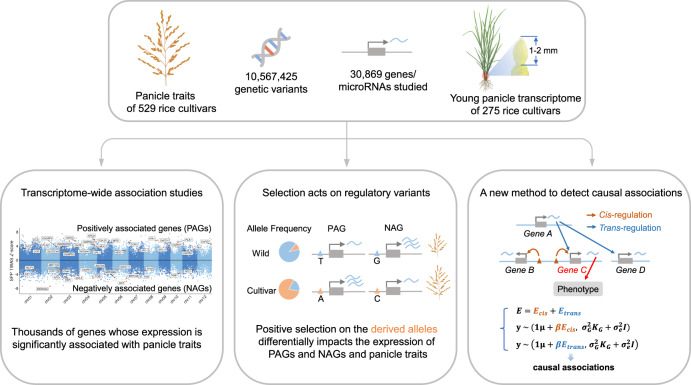
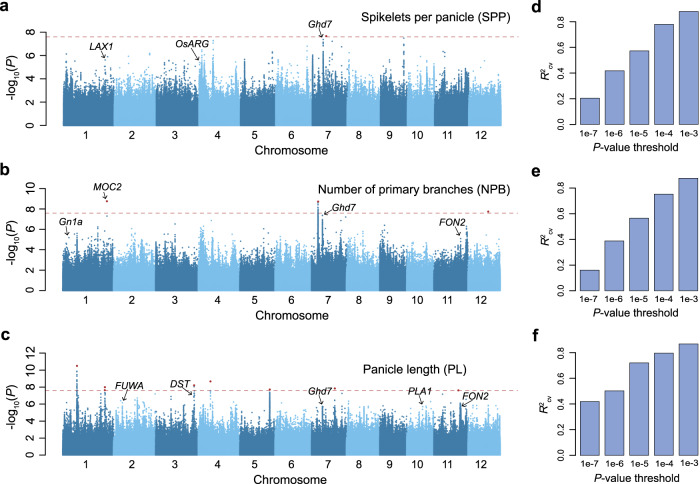
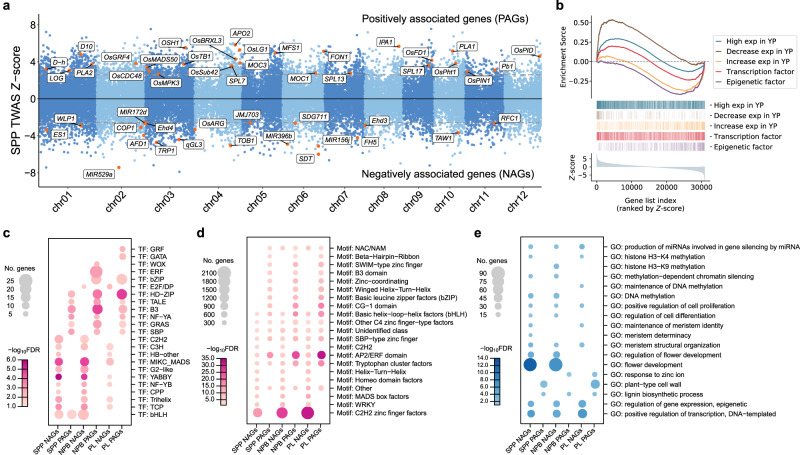
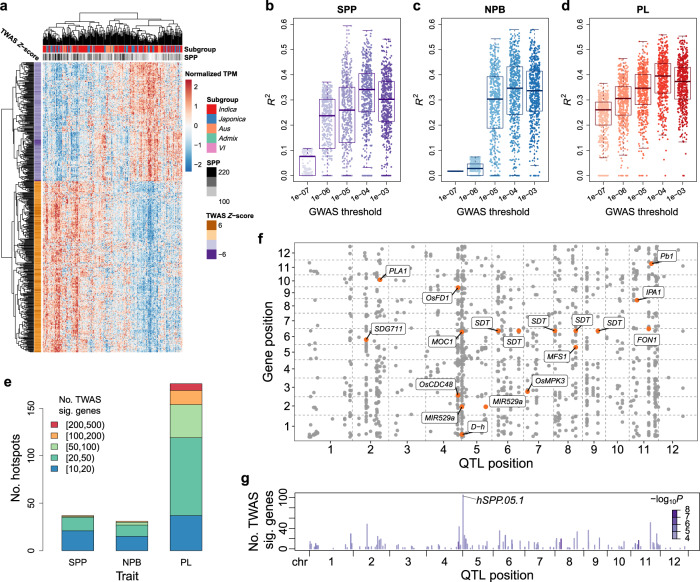
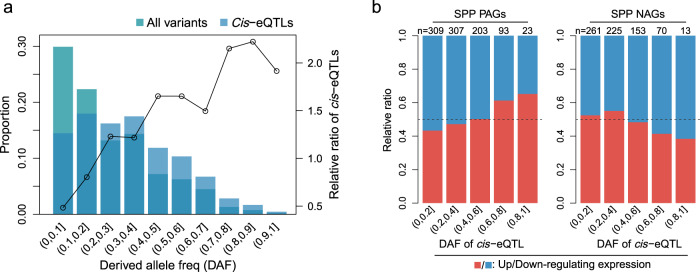
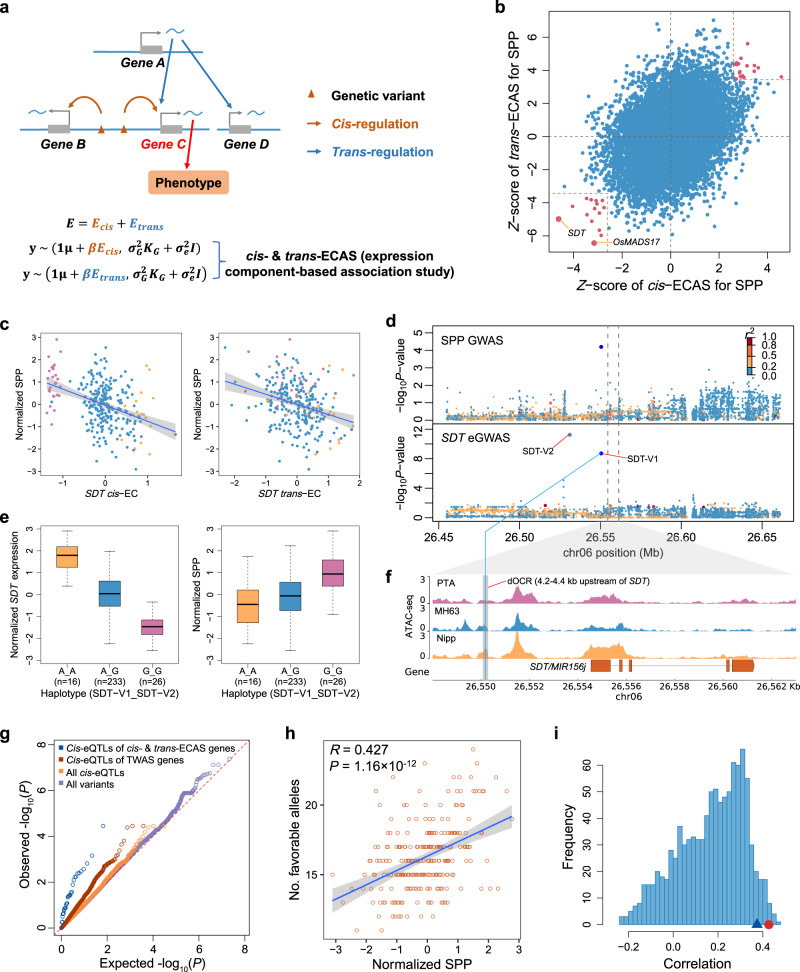
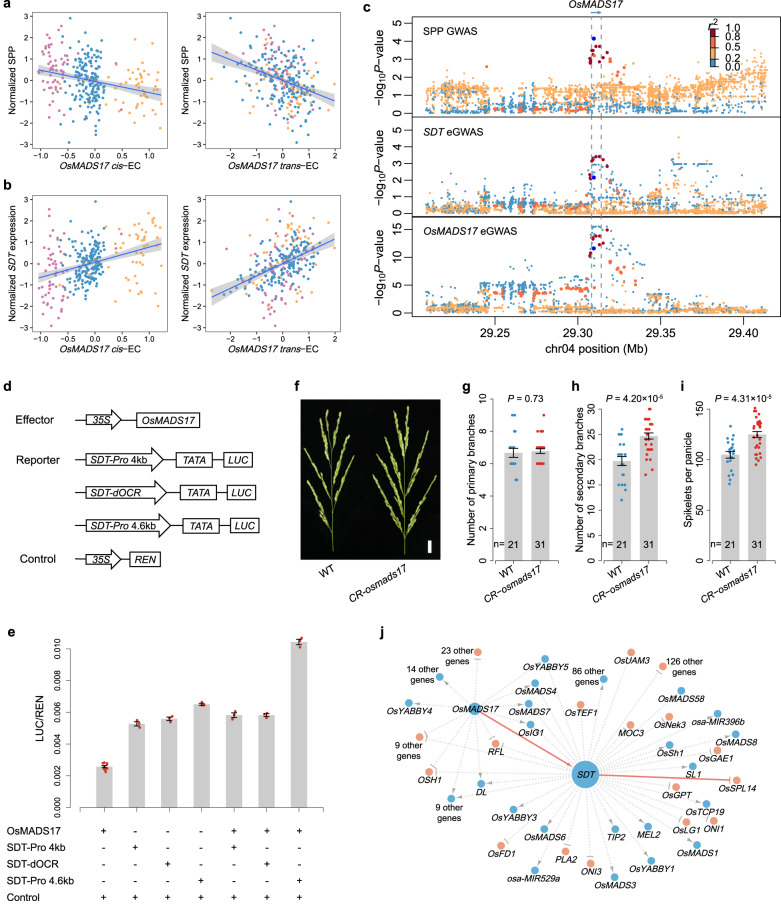
Panicle architecture is a key determinant of rice grain yield and is mainly determined at the 1-2 mm young panicle stage. Here, we investigated the transcriptome of the 1-2 mm young panicles from 275 rice varieties and identified thousands of genes whose expression levels were associated with panicle traits. Multimodel association studies suggested that many small-effect genetic loci determine spikelet per panicle (SPP) by regulating the expression of genes associated with panicle traits. We found that alleles at cis-expression quantitative trait loci of SPP-associated genes underwent positive selection, with a strong preference for alleles increasing SPP. We further developed a method that integrates the associations of cis- and trans-expression components of genes with traits to identify causal genes at even small-effect loci and construct regulatory networks. We identified 36 putative causal genes of SPP, including SDT (MIR156j) and OsMADS17, and inferred that OsMADS17 regulates SDT expression, which was experimentally validated. Our study reveals the impact of regulatory variants on rice panicle architecture and provides new insights into the gene regulatory networks of panicle traits.


Conflict of interest statement

The authors declare no competing interests.

Figures

Fig. 1
Fig. 1
Overview of the study.
Fig. 2
Fig. 2. GWAS and genetic variance composition of panicle traits.
ac Manhattan plots of GWAS using linear mixed model for the number of spikelets per panicle (SPP), the number of primary branches (NPB), and panicle length (PL). The red dashed lines indicate the genome-wide significance threshold (2.54 × 10−8, multiple comparisons corrected by 0.05/No. independent variants), and the red points indicate lead variants of genome-wide significant QTLs. Genes that have been reported to be related to panicle architecture within 100 kb of significant loci at the 1 × 10−5 threshold are marked out. df The phenotypic variance explained by GWAS lead variants identified at different p value thresholds for SPP, NPB, and PL. The explained phenotypic variances are assessed by tenfold cross-validation using LASSO. R2: predicted values versus observed phenotypes.
Fig. 3
Fig. 3. Transcriptome-wide association study (TWAS) for SPP and enrichment analysis of TWAS significant genes.
a Manhattan plot of TWAS for SPP. TWAS Z-scores (y-axis) are plotted against gene positions (x-axis) on each of the chromosomes. The gray dashed lines indicate the Z-scores at the FDR of 0.05, and genes exceeding this threshold are defined as TWAS significant genes in the following analysis. Known genes related to panicle development are labeled and marked as orange dots. b Gene Set Enrichment Analysis for TWAS significant genes of SPP. All genes were sorted in descending order (x-axis) by the TWAS Z-scores. The y-axis of the bottom panel indicates the TWAS Z-scores. Genes from different gene sets are shown in different colors. In the middle panel, a gene belonging to a certain gene set is indicated by a colored vertical line. In the top panel, the enrichment scores (y-axis) for each gene set are plotted against the rank of TWAS Z-scores (x-axis). High exp in YP: genes preferentially expressed in young panicles. Decrease exp in YP: genes progressively down-regulated in panicle development. Increase exp in YP: genes progressively up-regulated in panicle development. ce Transcription factor families (c), TF binding motifs (d), and gene ontology terms (e) enriched in TWAS significant genes for panicle traits (FDR <0.05). NAGs and PAGs: negatively and positively associated genes, respectively. The bubble size indicates the number of overlapping genes and the bubble color indicates the −log10 FDR of the enrichment.
Fig. 4
Fig. 4. Associations between GWAS QTLs and TWAS significant genes.
a Expression patterns of the top 500 TWAS significant genes of SPP in the 275 varieties. Each column is a variety, and each row is a gene. bd R2: the square of the Pearson correlation coefficient between the panicle trait and the predicted expression values of the top 500 TWAS significant genes of SPP (b), NPB (c), and PL (d), respectively. Each point represents a gene. The predicted expression values are predicted using the LASSO model based on lead variants of GWAS QTLs identified at different thresholds in the 275 varieties’ panel. For each box plot, the center line represents the median, the box’s lower and upper boundaries indicate the first and third quartiles, and the whiskers extend to data points within 1.5 times the interquartile range from the box. e Bar plot of the number of pQTL-eQTL hotspots for TWAS significant genes. A GWAS QTL of panicle traits (pQTL, p value <1 × 10−4) is defined as a pQTL-eQTL hotspot if it is an expression quantitative trait locus (eQTL, p value <1 × 10−4) for many genes and these genes are significantly enriched for more than 10 TWAS significant genes (BH-adjusted one-sided Fisher’s exact test p value <0.05). The pQTL-eQTL hotspots are categorized according to the number of TWAS significant genes in the associated targets and indicated by different colors. f Associations between the expression levels of TWAS significant genes and pQTLs for SPP. The genomic positions of TWAS significant genes (y-axis) are plotted against the positions of lead variants of pQTLs (x-axis) for each significant association. Known panicle development-related genes associated with pQTL-eQTL hotspots are labeled and marked as orange dots. g The number of TWAS significant genes associated with each GWAS QTL of SPP. The color of each bar represents the −log10 p value of GWAS for that QTL. Source data underlying (bg) are provided as a Source Data file.
Fig. 5
Fig. 5. Distribution of derived allele frequency (DAF) at cis-eQTLs and impact of derived alleles on the expression of SPP TWAS-significant genes.
a Variants with high DAF are enriched for cis-regulatory variants. All variants and lead variants of cis-eQTLs were divided into different DAF intervals. The bar plot represents the proportion of all variants (cyan) or lead variants of cis-eQTLs (sky blue) in each DAF interval (left y-axis). The line indicates the relative ratio of the proportion of cis-eQTLs to the proportion of all variants in each DAF interval (right y-axis). A total of 13,877 lead variants were used in this analysis. Derived alleles were identified based on wild rice data (“Methods”). b High-frequency derived alleles at cis-eQTLs of SPP TWAS-significant genes tend to have a positive effect on SPP. The cis-eQTLs of SPP PAGs (left panel) and NAGs (right panel) are divided into different intervals (x-axis) according to DAF, and the y-axis represents the proportion of cis-eQTLs whose derived allele is up-regulating gene expression (red) or down-regulating gene expression (blue). The numbers at the top of the bars indicate the number of TWAS significant genes containing cis-eQTL in each interval. Source data are provided as a Source Data file.
Fig. 6
Fig. 6. Identification of putative causal genes by cis- and trans-expression component-based association study (cis- and trans-ECAS).
a A schematic diagram of identifying putative causal genes by cis- and trans-ECAS. See main text for details. b Scatter plot of the association of SPP with cis-EC (x-axis) and trans-EC (y-axis) of genes. Red dots indicate genes whose both cis- and trans-EC are significantly associated with SPP. c Correlations of SPP with cis-EC (left) and trans-EC (right) of SDT. The colors of the dots represent different haplotypes which are the same as in (e). The error bands indicate 95% confidence intervals. d Regional association plots of GWAS for SPP (top) and SDT expression (eGWAS, bottom) in a 200-kb region centered on SDT. The colors of the dots represent the linkage disequilibrium (measured by r2) of each variant with the lead variant of GWAS for SPP (dark blue). p values of SDT-V1 and SDT-V2 were calculated using a multivariate linear mixed model with SDT-V1 and SDT-V2 as independent variables, while p values for the other variants were calculated using a linear mixed model with SDT-V1 and SDT-V2 as covariates. e Box plots of SDT expression and SPP of different haplotypes. The x-axis indicates the haplotypes formed by combining genotypes of SDT-V1 (A/G) and SDT-V2 (A/G). The definitions of the box plots are the same as Fig. 4b. f Chromatin accessibility profiles of three varieties with different haplotypes around the SDT. PTA, MH63, and Nipp indicate the varieties of Padi Tarab Arab, Minghui63, and Nipponbare, respectively, which belong to the three haplotypes in (e) (G_G, A_G, and A_A, respectively). The y-axis values are Counts Per Million mapped reads (CPM) of ATAC-seq. The gray rectangular area indicates the distal open chromatin region (dOCR) surrounding SDT-V1 (blue line), where changes in chromatin accessibility are consistent with variations in SDT expression. g Q-Q plot of GWAS signals for SPP for different groups of variants. h The correlation between SPP and the number of favorable alleles at cis-eQTLs for the cis- and trans-ECAS significant genes of SPP in each variety. The analysis included 254 varieties, for which transcriptome data were not acquired. Alleles that up-regulate PAGs or down-regulate NAGs are defined as favorable alleles. Pearson’s correlation coefficient is used for the test. i Histogram of the correlations between SPP and the number of favorable alleles at cis-eQTLs for randomly selected TWAS significant genes. The same number of genes as the cis- and trans-ECAS genes were selected each time from TWAS significant genes with significant cis-genetic variance and repeated 1000 times. The blue triangle indicates the 0.95 quantiles of the correlations, and the red dots indicate the correlation between phenotypes and the numbers of favorable alleles at cis-eQTLs for the cis- and trans-ECAS genes. Source data underlying (b, c, e, h) are provided as a Source Data file.
Fig. 7
Fig. 7. OsMADS17 regulates SDT transcription and affects SPP.
a Correlations of SPP with cis-EC (left) and trans-EC (right) of OsMADS17. The colors of the dots represent different genotypes of the OsMADS17-V1 variant: reference type (orange), 11-bp deletion type (blue), and 39-bp deletion type (purple). The error bands indicate 95% confidence intervals. b Correlations of SDT expression with cis-EC (left) and trans-EC (right) of OsMADS17. The colors of the dots represent different genotypes of OsMADS17-V1, as in (a). c Regional association plots of GWAS using linear mixed model for SPP (top), SDT expression (middle) and OsMADS17 expression (bottom) in a 200-kb region centered on OsMADS17. d Schematic diagram of the effector and reporter constructs used for transient transcriptional activity assay in (e). Firefly luciferase gene LUC, driven by the 4-kb and 4.6-kb promoters of SDT as well as dOCR (4.2–4.4 kb upstream of SDT, as shown in Fig. 6f), was used as the reporter. e Transient transcriptional activity assay showing that OsMADS17 transactivates SDT transcription and this transactivation requires the dOCR upstream of SDT. All data are means ± SEM (9 biologically independent samples for OsMADS17 + control and 3 for the others). f Panicle morphologies of CR-osmads17 mutant and WT. WT wild-type. Scale bar, 2 cm. gi Quantification of the number of primary branches (g), number of secondary branches (h), and spikelets per panicle (i) in the main panicle of CR-osmads17 mutant and WT. Data are means ± SEM. Comparisons are made by two-tailed Student’s t test. j Gene regulatory networks constructed using cis- and trans-ECAS. The SPP TWAS-significant genes (FDR <0.01) were used as e-traits, and the network centered on SDT and OsMADS17 (SDT and OsMADS17 as regulatory genes) is shown. The color of the nodes indicates the regulatory direction of genes for SPP: light salmon for positive correlation and blue for negative correlation. The size of each node circle indicates the number of nodes it connects to. Solid lines represent the regulatory relationships validated in this study and those previously reported. Source data underlying (a, b, e, gi) are provided as a Source Data file.

References

    1. Xing Y, Zhang Q. Genetic and molecular bases of rice yield. Annu. Rev. Plant Biol. 2010;61:421–442. doi: 10.1146/annurev-arplant-042809-112209. - DOI - PubMed
    1. Tsuda K, Ito Y, Sato Y, Kurata N. Positive autoregulation of a KNOX gene is essential for shoot apical meristem maintenance in rice. Plant Cell. 2011;23:4368–4381. doi: 10.1105/tpc.111.090050. - DOI - PMC - PubMed
    1. Komatsu K, et al. LAX and SPA: major regulators of shoot branching in rice. Proc. Natl Acad. Sci. USA. 2003;100:11765–11770. doi: 10.1073/pnas.1932414100. - DOI - PMC - PubMed
    1. Ashikari M, et al. Cytokinin oxidase regulates rice grain production. Science. 2005;309:741–745. doi: 10.1126/science.1113373. - DOI - PubMed
    1. Jiao Y, et al. Regulation of OsSPL14 by OsmiR156 defines ideal plant architecture in rice. Nat. Genet. 2010;42:541–544. doi: 10.1038/ng.591. - DOI - PubMed

Publication types