. 2013 May;31(5):434-9.
doi: 10.1038/nbt.2564. Epub 2013 Apr 14.

Generation of oligodendroglial cells by direct lineage conversion

Affiliations

Generation of oligodendroglial cells by direct lineage conversion

Nan Yang et al. Nat Biotechnol. 2013 May.

Abstract

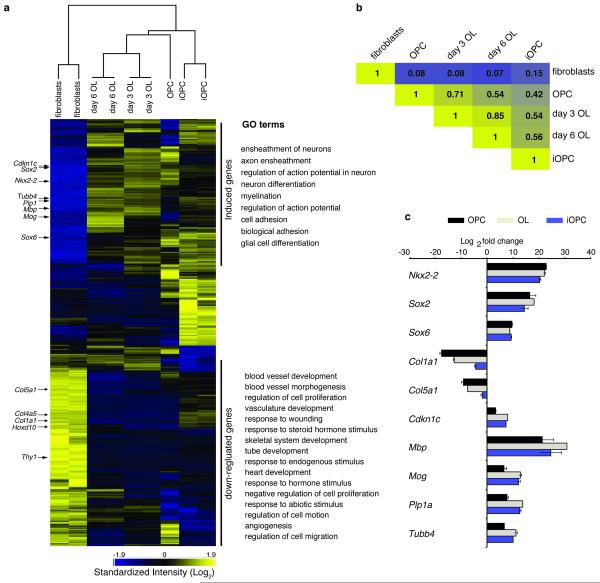
Transplantation of oligodendrocyte precursor cells (OPCs) is a promising potential therapeutic strategy for diseases affecting myelin. However, the derivation of engraftable OPCs from human pluripotent stem cells has proven difficult and primary OPCs are not readily available. Here we report the generation of induced OPCs (iOPCs) by direct lineage conversion. Forced expression of the three transcription factors Sox10, Olig2 and Zfp536 was sufficient to reprogram mouse and rat fibroblasts into iOPCs with morphologies and gene expression signatures resembling primary OPCs. More importantly, iOPCs gave rise to mature oligodendrocytes that could ensheath multiple host axons when co-cultured with primary dorsal root ganglion cells and formed myelin after transplantation into shiverer mice. We propose direct lineage reprogramming as a viable alternative approach for the generation of OPCs for use in disease modeling and regenerative medicine.


Figures

Figure 1
Figure 1. Identification of candidate factors for the generation of iOPCs
(a) Schematic representation of the strategy to test candidate OPC-inducing factors. (b) Plp::EGFP+ cells and O4-labeled cells derived from MEFs 3 weeks after infection with the 10-factor pool. Ectopic expression of Sox10 alone is sufficient to induce Plp::EGFP positive cells. (c, d, e) Quantification of Plp::EGFP+ cells with indicated factor combinations 3 weeks after transgene induction. Shown are average numbers of EGFP+ cells per 20× visual field from at least 15 randomly picked fields. Data are presented as mean ± SD. Scale bars, 50 μm (b).
Figure 2
Figure 2. Induction of OPC-like cells from rat fibroblasts
(a) Schematic of the experimental setup and strategy to derive and isolate iOPCs from rat embryonic fibroblasts. (b) Phase contrast image of iOPCs derived from rat fibroblasts by a combination of 3 factors (Sox10, Olig2 and Zfp536) three weeks after infection. (c) iOPCs with immature morphology can be labeled with O4 antibodies 3 weeks after infection. (d) Phase contrast image of O4-immunopanned iOPCs in proliferation media. (e-g) O4+ cells can be labeled with additional OPC markers including NG2 (e), A2B5 (f), S100β (g) 3 weeks after infection. (h) FACS analysis revealed an initial slow and later exponential increase of O4+ cells during reprogramming whereas the total number of rtTA virus infected fibroblasts cultured in OPC expansion media did not change over time. (i) The reprogramming yield was determined by the ratio of O4-immunopanned cells/cm2 20 days after induction and the total number of fibroblasts that ectopically express all three reprogramming factors 48h after infection. For both (i) and (k) shown are individual data points, averages and SEM. (k) The purity of iOPCs on day 20 was determined by the ratio of recovered O4+ cells after immunopanning and the total number of harvested cells before immunopanning. Scale bars, 100 μm (b), 50 μm (c, d), 20 μm (e, f, g).
Figure 3
Figure 3. Global transcriptional reprogramming of iOPCs
(a) Heatmap of microarray data illustrating differentially expressed genes among iOPCs, fibroblasts, OPCs, and OPCs differentiated for 3 or 6 days (day 3 oligodendrocytes (OLs), day 6 OLs). Shown are 5,765 probe sets selected on fold change ≥ ±2 in iOPCs vs. fibroblasts. Expression levels are shown as mean centered log2 values. Yellow indicates up-regulated genes whereas blue indicates down-regulated genes. The scale extends from 1.988- to 15.691-fold over mean (−2 to +2 in log2 space) as indicated at the bottom. Hierarchical clustering among all the samples is presented as array tree. The position of representative fibroblast and OPC genes is indicated by arrows. Significantly enriched Gene ontology (GO) terms (p<10−9) of induced and repressed gene clusters in iOPCs after reprogramming are shown on the right side of the heatmap. (b) Pearson’s correlation analyses of all differentially expressed genes among fibroblasts, OPC, day3 OLs, day6 OLs and iOPCs. R2 values are indicated on a corresponding heatmap. (c) qRT-PCR analysis of the expression levels of characteristic OPC, fibroblast and oligodendrocyte marker genes in fibroblasts, iOPCs, OPCs and differentiated OPCs (OL). Data are presented as log2 fold change between indicated cell types and fibroblasts.
Figure 4
Figure 4. Differentiation potential of fibroblasts-derived iOPCs in vitro
Three weeks after culture in differentiation medium, iOPCs adopt mature oligodendrocyte morphologies and express MBP (a) and CNP (b). GFAP (c) and Nestin (d) expressing cells were also detected. (e) When iOPCs were co-cultured with pre-established dorsal root ganglion neurons (DRGs), mature oligodendrocytes were identified by MBP immunofluorescence (red). Myelinating iOPC-derived oligodendrocytes extended multiple distinctive smooth tubes, which were aligned with axons marked by neurofilament (NF) staining (grey). The right panels represent zoomed images of the boxed area showing MBP, NF staining. (f) Quantification of MBP, GFAP, and Nestin-positive cells 3 weeks after differentiation of iOPCs with or without DRGs. Scale bars, 50 μm (a-d), 20 μm (e).
Figure 5
Figure 5. Fibroblasts-derived iOPC cells are myelinogenic in vivo
(a) iOPCs purified by immunopanning were injected into early perinatal Mbpshi/shi mice and brains were analyzed 12 weeks later. MBP+ cells with typical mature oligodendrocyte morphology were detected in all injection sites analyzed (n=3 brains, 4 injection sites/brain). Nuclei were counterstained with DAPI (blue). (b, c) All engrafted MBP+ cells express the additional oligodendrocyte marker Plp but not P0. (d) Confocal projection image showing the MBP+ tube-like structures in the Mbpshi/shi mouse brain. (e) Single-focal plane image showing the close association of nerve fibers revealed by neurofilament immunofluorescence (green) and MBP+ oligodendrocyte membrane wraps (red). (f) Electron microscope image showing dense myelin sheaths formed by engrafted iOPCs in the Mbpshi/shi mouse brain. Scale bars, 20 μm (a), 50 μm (b,c), 10 μm (d,e), 500 nm (f).

Comment in

References

    1. Potter GB, Rowitch DH, Petryniak MA. Myelin restoration: progress and prospects for human cell replacement therapies. Arch Immunol Ther Exp (Warsz) 2011;59:179–193. - PubMed
    1. Franklin RJ, Ffrench-Constant C. Remyelination in the CNS: from biology to therapy. Nat Rev Neurosci. 2008;9:839–855. - PubMed
    1. Goldman SA. Progenitor cell-based treatment of the pediatric myelin disorders. Arch Neurol. 2011;68:848–856. - PMC - PubMed
    1. Cummings BJ, et al. Human neural stem cells differentiate and promote locomotor recovery in spinal cord-injured mice. Proc Natl Acad Sci U S A. 2005;102:14069–14074. - PMC - PubMed
    1. Franklin RJ, Ffrench-Constant C. Stem cell treatments and multiple sclerosis. BMJ. 2010;340:c1387. - PubMed

Publication types

Substances

Associated data