Comparative Study
. 2013 Jul;10(7):623-9.
doi: 10.1038/nmeth.2483. Epub 2013 May 19.

Comparative analysis of RNA sequencing methods for degraded or low-input samples

Affiliations
Comparative Study

Comparative analysis of RNA sequencing methods for degraded or low-input samples

Xian Adiconis et al. Nat Methods. 2013 Jul.

Erratum in

  • Nat Methods. 2014 Feb;11(2):210

Abstract

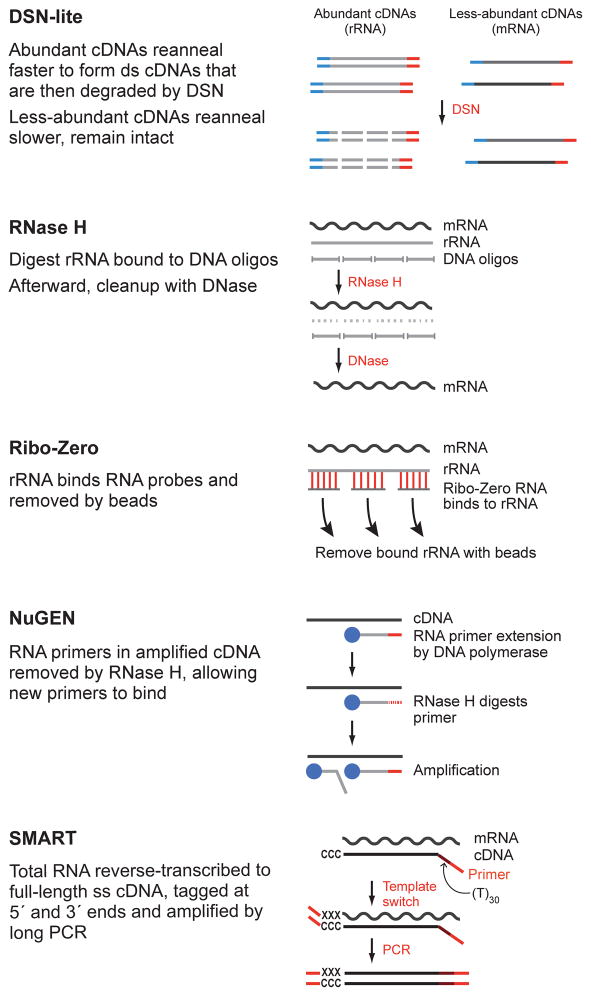
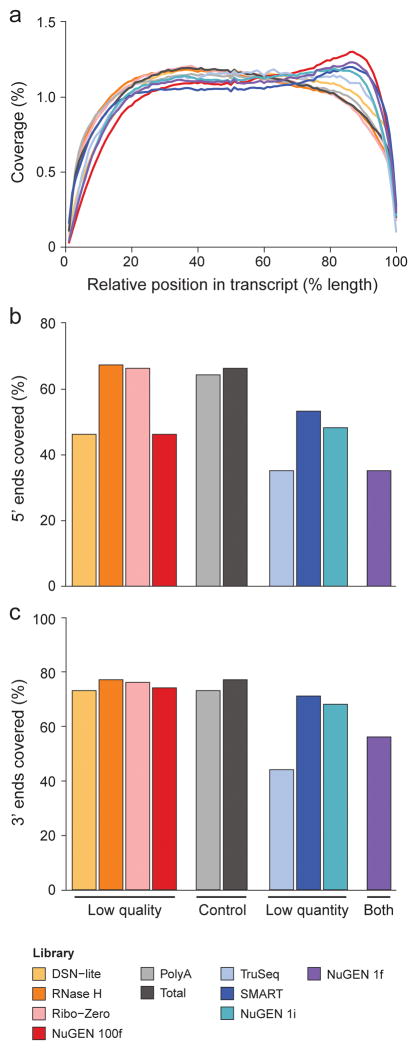
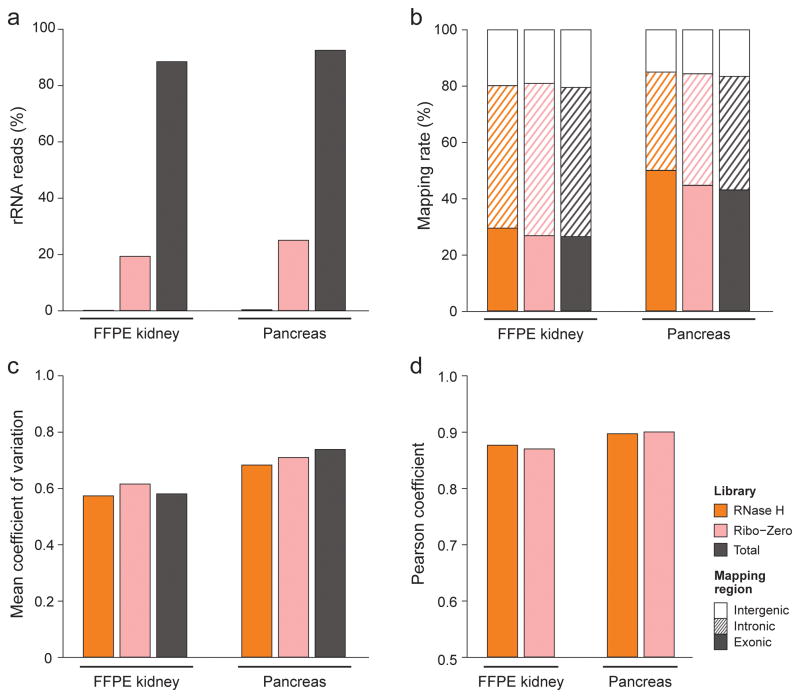
RNA-seq is an effective method for studying the transcriptome, but it can be difficult to apply to scarce or degraded RNA from fixed clinical samples, rare cell populations or cadavers. Recent studies have proposed several methods for RNA-seq of low-quality and/or low-quantity samples, but the relative merits of these methods have not been systematically analyzed. Here we compare five such methods using metrics relevant to transcriptome annotation, transcript discovery and gene expression. Using a single human RNA sample, we constructed and sequenced ten libraries with these methods and compared them against two control libraries. We found that the RNase H method performed best for chemically fragmented, low-quality RNA, and we confirmed this through analysis of actual degraded samples. RNase H can even effectively replace oligo(dT)-based methods for standard RNA-seq. SMART and NuGEN had distinct strengths for measuring low-quantity RNA. Our analysis allows biologists to select the most suitable methods and provides a benchmark for future method development.


Figures

Figure 1
Figure 1. Methods for total RNA-Seq
Shown are the salient details for five protocols for total RNA-Seq. DSN-lite (Duplex-specific nuclease, low C0t normalization), RNase H, and Ribo-Zero were tested for low quality samples; SMART was tested for low quantity samples. NuGEN, which generates double-stranded cDNA amplified using Ribo-SPIA (Single Primer Isothermal Amplification), was tested for both types of samples: (NuGEN 100f for low quality; NuGEN 1i for low quantity, and NuGEN 1f for low quantity and low quality). In each case, RNA and matching cDNA are in black, adaptors and primers in color, and rRNA is in grey.
Figure 2
Figure 2. Sequence alignment and uniformity of coverage metrics
Shown is the performance of each library (x axis, color coded as in legend) for each of (a) Percent of rRNA mapping reads; (b) Percent of duplicated reads; (c) Proportion of reads mapping to exons (solid), introns (hatched), and intergenic (white) regions; (d) Evenness of coverage. Shown is the mean coefficient of variation (y axis) for the top 1,000 expressed transcripts in each library (x axis); and (e) Proportion of transcript covered at each expression level. Shown are the Lowess fits of the percentage of the transcript length covered (y axis) for transcripts at each expression level (x axis). Transcript coverage was aggregated for all isoforms of each gene.
Figure 3
Figure 3. 5′ to 3′ sequence coverage
(a) Normalized coverage by position. For each library, shown is the average relative coverage (y axis) at each relative position along the transcripts’ length. (b,c) 5′ and 3′ end coverage. For each library, shown is the percentage of annotated 5′ (b) and 3′ (c) ends covered by reads.
Figure 4
Figure 4. Expression metrics
(a) Pearson correlation coefficient between each library and the control Total library. (b–e) Illustrative scatter plots (b,c) and Q-Q plots (d,e) between a low quality library (RNase H, b,d, y axis) or a low quantity library (SMART, c,e, y axis) and the control Total library (x axis). For Q-Q plots, if the two samples originated from the same distribution, then the points will lie on a straight line. TPM = Transcripts Per Million.
Figure 5
Figure 5. Length and GC biases in expression metrics
Shown are the Pearson correlation coefficient between each library (columns) and the control Total library for either all transcripts (top row) or for transcripts with (a) different lengths; or (b) different GC content. The number of transcripts expressed in the control Total library in bins with length < 1,000, 1,000–5,000, and > 5,000 was 3,716, 38,088, and 7,050, respectively. The number of transcripts expressed in the control Total library in bins with GC content < 37%, 37–62%, and > 62% was 2,358, 42,660, and 3,836, respectively.
Figure 6
Figure 6. Performance for actual degraded samples
Shown are key metrics for RNase-H (orange), Ribo-Zero (pink) and total (black) libraries from pancreas and FFPE kidney RNA. (a) Percent of rRNA mapping reads; (b) Proportion of reads mapping to exons (solid), introns (hatched), and intergenic (white) regions; (c) mean coefficient of variation (y axis) for the top 1,000 expressed transcripts in each library (x axis); (d) Pearson correlation coefficient between each library and a control Total library.

References

    1. Aviv H, Leder P. Purification of biologically active globin messenger RNA by chromatography on oligothymidylic acid-cellulose. Proc Natl Acad Sci U S A. 1972;69:1408–1412. - PMC - PubMed
    1. Yang L, Duff MO, Graveley BR, Carmichael GG, Chen LL. Genomewide characterization of non-polyadenylated RNAs. Genome Biol. 2011;12:R16. - PMC - PubMed
    1. Tang F, et al. mRNA-Seq whole-transcriptome analysis of a single cell. Nat Methods. 2009;6:377–382. - PubMed
    1. Ramskold D, et al. Full-length mRNA-Seq from single-cell levels of RNA and individual circulating tumor cells. Nat Biotechnol. 2012 - PMC - PubMed
    1. Islam S, et al. Characterization of the single-cell transcriptional landscape by highly multiplex RNA-seq. Genome Res. 2011;21:1160–1167. - PMC - PubMed

Publication types

Associated data