. 2012 Dec 26;109(52):21360-5.
doi: 10.1073/pnas.1210371110. Epub 2012 Dec 10.

Selective inhibition of Ezh2 by a small molecule inhibitor blocks tumor cells proliferation

Affiliations

Selective inhibition of Ezh2 by a small molecule inhibitor blocks tumor cells proliferation

Wei Qi et al. Proc Natl Acad Sci U S A. .

Abstract

Ezh2 (Enhancer of zeste homolog 2) protein is the enzymatic component of the Polycomb repressive complex 2 (PRC2), which represses gene expression by methylating lysine 27 of histone H3 (H3K27) and regulates cell proliferation and differentiation during embryonic development. Recently, hot-spot mutations of Ezh2 were identified in diffused large B-cell lymphomas and follicular lymphomas. To investigate if tumor growth is dependent on the enzymatic activity of Ezh2, we developed a potent and selective small molecule inhibitor, EI1, which inhibits the enzymatic activity of Ezh2 through direct binding to the enzyme and competing with the methyl group donor S-Adenosyl methionine. EI1-treated cells exhibit genome-wide loss of H3K27 methylation and activation of PRC2 target genes. Furthermore, inhibition of Ezh2 by EI1 in diffused large B-cell lymphomas cells carrying the Y641 mutations results in decreased proliferation, cell cycle arrest, and apoptosis. These results provide strong validation of Ezh2 as a potential therapeutic target for the treatment of cancer.


Conflict of interest statement

The authors declare no conflict of interest.

Figures

Fig. 1.
Fig. 1.
Biochemical characterization of EI1 inhibition of PRC2 complex. (A) Chemical structure of EI1. (B) Inhibition curves of EI1 for wild-type enzyme with unmethylated H3K27 as the substrate and Y641F enzyme with di-methylated H3K27 as the substrate. Each data point represents the mean of two replicates at each concentration of the compounds. The data are fit to a dose–response equation using PRISM. (C) Plot of IC50 values of EI1 as a function of SAM concentration relative to the Michaelis–Menten constant (Km) of SAM. Using the Cheng–Prusoff equation for competitive inhibitors [IC50 = Ki (1+[S]/Km)], the Ki value of EI1 was derived from the linear regression fitting.
Fig. 2.
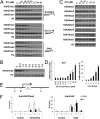
Fig. 2.
EI1 inhibits cellular H3K27 methylation and activates p16 expression. (A) Inhibition of H3K27 methylation by different concentrations of EI1. SU-DHL6 (Ezh2Y641N) and OCI-LY19 (Ezh2WT) cells were treated with EI1 for 4 d, and G401 cells were treated with EI1 for 2 d at the indicated concentrations. H3K27me3, H3K27me2, H3K27me1, and H3 were detected by immunoblot. (B) Time course of H3K27 methylation inhibition by EI1. WSU-DLCL2 (Ezh2Y641F) cells were treated with EI1 at 10 μM for indicated time periods. (C) Immunoblot against histone H3 methylation modifications using WSU-DLCL2 (Ezh2Y641F) cell lysates treated with indicated concentrations of EI1. (D) qPCR analysis of p16 mRNA level in G401 (Ezh2WT) cells. p16 mRNA is normalized to GAPDH level and plotted as fold to control base line samples. (Left) The expression of p16 gene in G401 cells treated by different concentrations of EI1 for 2 d. (Right) Time course of p16 expression in G401 cells treated by EI1 (10 μM) for indicated time. (E) Graphic presentation of p16 genomic locus. The regions A, B, and C indicate the primer location for ChIP-PCR. (F) ChIP-PCR using anit-Ezh2 and H3K27me3 antibodies at the indicated regions on p16 promoter before and after 48 h of EI1 treatment. Rabbit and mouse IgG are used as controls. Relative enrichment is calculated as percent of input.
Fig. 3.
Fig. 3.
EI1 inhibits H3K27me3 similarly as Ezh2 knockout. (A) Inhibition of H3K27me3 by EI1 and Ezh2 knockout induced by 4-OH-T. Immortalized MEF (Ezh2f/f) cells were treated with 3.3 μM EI1, 4-OH-T, or the combination of EI1 and 4-OH-T. After cell harvesting, indicated proteins were detected by immunoblot. (B) Proliferation of the immortalized MEFs after treatment by 3.3 μM EI1, Ezh2 knockout induced by 4-OH-T, or the combination of EI1 and 4-OH-T. Viable cells were counted at days 3, 6, and 11. The results were plotted on a linear scale.
Fig. 4.
Fig. 4.
EI1 selectively inhibits the proliferation and colony formation of DLBCL cell lines carrying Ezh2 Y641 mutations. (A) Proliferation of WSU-DLCL2 (Ezh2Y641F) and OCI-LY19 (Ezh2WT) cells. Viable cells were counted every 3 or 4 d in the presence of siRNAs against Ezh2 and results were plotted on a logarithmic scale. (B) Proliferation of WSU-DLCL2 (Ezh2Y641F), SH-DHL-6 (Ezh2Y641N), OCI-LY19 (Ezh2WT), and GA10 (Ezh2WT) cells in the presence of EI1 at the indicated concentrations. Viable cells were similarly counted as in A. (C) Effect of EI1 on the proliferation of DLBCL cell lines with wild-type Ezh2, or cells carrying Ezh2 Y641 mutations. Cells were similarly cultured and counted as in B and IC50 values were calculated at 14 or 15 d of treatment. The level bars indicate median for each group (see also Fig. S3). (D) Colony formation of WSU-DLCL2 (Ezh2Y641F) and OCI-LY19 (Ezh2WT) cells in the presence of EI1 at the indicated concentrations. (Upper) On day14, photomicroscopy of cell colonies was taken at 20× magnification. (Lower) Quantification of colony formation by AlamarBlue. The data are plotted as percentage of DMSO.
Fig. 5.
Fig. 5.
EI1 causes cell cycle G0/1 arrest and apoptosis in DLBCL cell lines carrying Ezh2 Y641 mutations. (A) Cell cycle analysis of WSU-DLCL2 (Ezh2Y641F) and OCI-LY19 (Ezh2WT) cells after 7-d treatment with DMSO or EI1 (10 μM). The analysis was performed using BrdU incorporation with 7-AAD staining followed by flow cytometry. Annotations indicate distribution of cells to G0/1, S, and G2/M phases of cell cycle. One representative result of multiple experiments is shown. (B) Cell cycle changes analyzed by FACS after treatment as in A. The cell lines are: WSU-DLCL2 (Ezh2Y641F), SU-DHL6 (Ezh2Y641N), Karpas422 (Ezh2Y641N), OCI-LY19 (Ezh2WT), GA10 (Ezh2WT), and Toledo (Ezh2WT). (C) Immunoblot analysis. Cells were similarly cultured and treated as in A (see also Fig. S4). (D) Immunoblot using SU-DHL6 cell lysates treated with 10 μM of EI1 for indicated time periods.
Fig. 6.
Fig. 6.
Ezh2 inhibition by EI1 causes down-regulation of DLBCL proliferation signature and up-regulation of memory B-cell signature. (A) Gene-expression changes of Karpas422 cell at different time points after EI1 (5 μM) treatment. Changes in gene expression were filtered by fold-change >1.5 or ≤1.5 and by P < 0.05. (B and F). GSEA showing enrichment of “Proliferation signature in DLBCL” (B) (34) and “Nuytten Ezh2 targets down” (F) (37) in genes down-regulated by 6 d of EI1 treatment. (C–E). GSEA showing enrichment of “Splenic marginal zone memory B cell high vs. GC B cell” (C) (36), “genes negative correlated with Ezh2 mRNA in DLBCL” (D) (25), and “Nuytten Ezh2 targets up” (E) (37) in genes up-regulated by 6 d of EI1 treatment. See also Table S1.

References

    1. Simon JA, Lange CA. Roles of the EZH2 histone methyltransferase in cancer epigenetics. Mutat Res. 2008;647(1–2):21–29. - PubMed
    1. Cao R, et al. Role of histone H3 lysine 27 methylation in Polycomb-group silencing. Science. 2002;298(5595):1039–1043. - PubMed
    1. Morey L, Helin K. Polycomb group protein-mediated repression of transcription. Trends Biochem Sci. 2010;35(6):323–332. - PubMed
    1. Margueron R, Reinberg D. The Polycomb complex PRC2 and its mark in life. Nature. 2011;469(7330):343–349. - PMC - PubMed
    1. Lewis EB. A gene complex controlling segmentation in Drosophila. Nature. 1978;276(5688):565–570. - PubMed

MeSH terms

Substances

Associated data