. 2024 Jan 8;15(1):363.
doi: 10.1038/s41467-023-44210-1.

Distinct mesenchymal cell states mediate prostate cancer progression

Affiliations

Distinct mesenchymal cell states mediate prostate cancer progression

Hubert Pakula et al. Nat Commun. .

Abstract

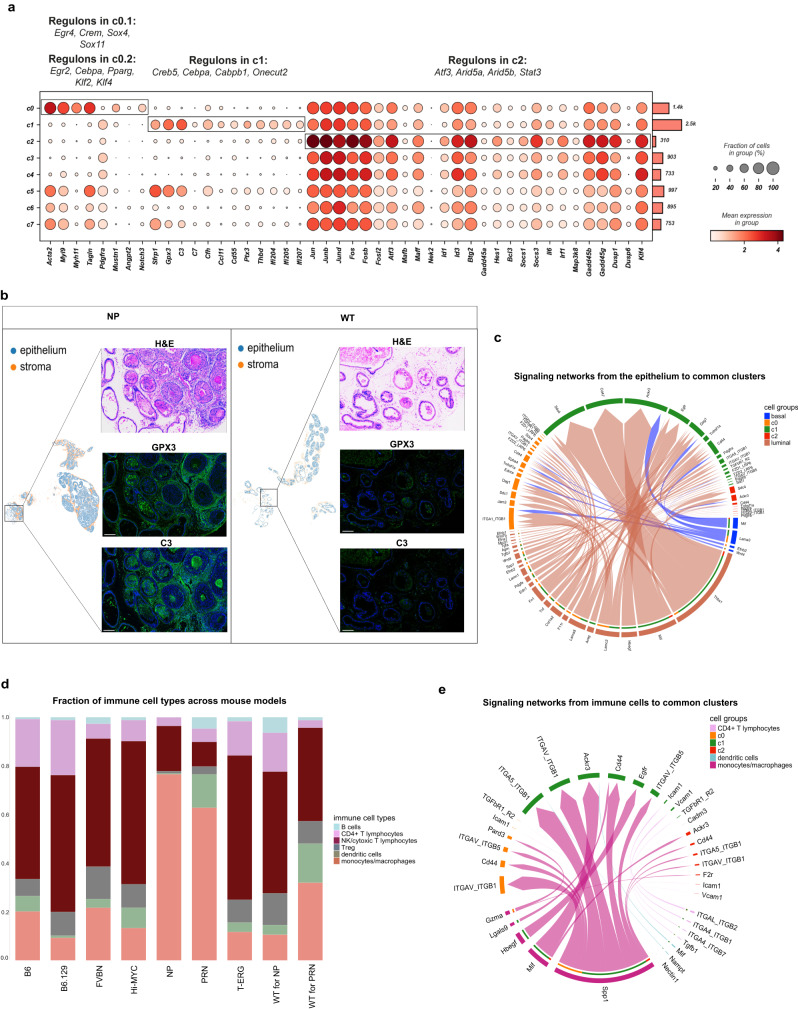
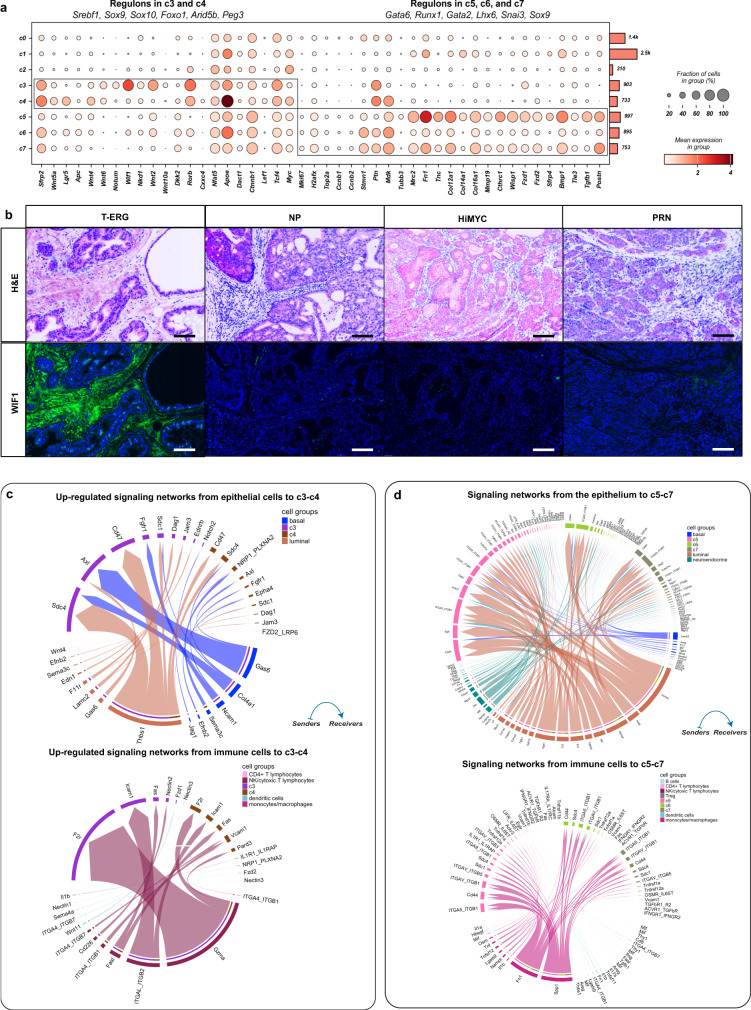
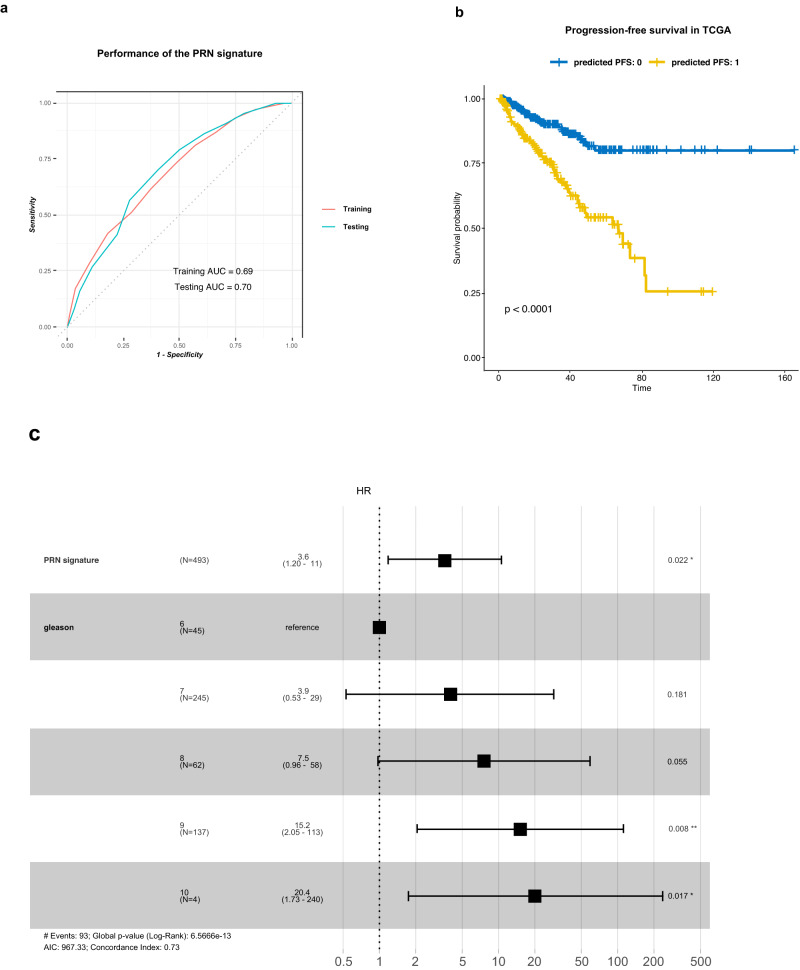
In the complex tumor microenvironment (TME), mesenchymal cells are key players, yet their specific roles in prostate cancer (PCa) progression remain to be fully deciphered. This study employs single-cell RNA sequencing to delineate molecular changes in tumor stroma that influence PCa progression and metastasis. Analyzing mesenchymal cells from four genetically engineered mouse models (GEMMs) and correlating these findings with human tumors, we identify eight stromal cell populations with distinct transcriptional identities consistent across both species. Notably, stromal signatures in advanced mouse disease reflect those in human bone metastases, highlighting periostin's role in invasion and differentiation. From these insights, we derive a gene signature that predicts metastatic progression in localized disease beyond traditional Gleason scores. Our results illuminate the critical influence of stromal dynamics on PCa progression, suggesting new prognostic tools and therapeutic targets.


Conflict of interest statement

The authors declare no competing interests.

Figures

Fig. 1
Fig. 1. Differential enrichement of stromal cell clusters in wild type versus genetically-engineered mouse models (GEMMs).
a Visualization of 8574 mesenchymal cells using Uniform Manifold Approximation and Projection (UMAP), color-coded based on their assignment to different clusters by graph-based clustering (left panel). The middle and right panels color-code these cells based on their model of origin (mutant vs. wild type). b Parallel categories plot showing the distribution of mesenchymal cell clusters (left) across the different mouse models (right). c Heatmap of the significant outgoing ligand-receptor (L-R) interaction patterns in the GEMMs (left) and wild-type (right) mice. The color bar represents the relative strength of a signaling pathway across cells. The top-colored bar plot represents the total signaling strength of each compartment by summing all the signaling pathways shown in the heatmap. The right gray bar plot indicates the total signaling strength of a particular pathway by summing all compartments presented in the heatmap. d Chord diagrams displaying the significant signaling networks between the stroma, epithelium, and immune compartments in mutants (left) and wild types (right). Each sector represents a distinct compartment, and the size of the inner bars represents the signal strength received by their targets. Up- and down-regulated signaling L-R pairs were identified based on differential gene expression analysis between mutants and wild types, with a log-fold change (logFC) of 0.2 set as a threshold. Communication probabilities for the L-R interactions were calculated after adjusting for the size of cell populations, and then aggregated on the signaling pathway-level. UMAP: Uniform Manifold Approximation and Projection.
Fig. 2
Fig. 2. A common cluster of contractile mesenchymal cells encompasses myofibroblasts and pericytes.
a Canonical myogenic and smooth muscle genes characterize c0 (n = 1401 cells) as contractile mesenchymal cells (left panel), but 2 subpopulations: c0.1 (n = 902 cells) and c0.2 (n = 499 cells) can be further subclassified (middle panel). Relative contribution of the different GEMMs and WTs to c0 is shown in the right panel. b UMAP projection of cells from c0 (n = 1401 cells), showing the expression of different myogenic and smooth muscle genes. Acta2, Myl9, Myh11, and Tangl mark myofibroblasts and pericytes, while Rgs5, Mef2c, and Pdgfrb distinguish pericytes (c0.2). The color scale is proportional to the expression levels. c Dot plot showing the expression levels of genes that distinguish myofibroblasts (c0.1) from pericytes (c0.2). The color scale represents the mean gene expression in the cell groups. d The expression levels of regulons that distinguish myofibroblasts (c0.1) from pericytes (c0.2). The color scale represents the mean expression levels. GEMMs: genetically-engineered mouse models; UMAP: Uniform Manifold Approximation and Projection; WT: wild type.
Fig. 3
Fig. 3. A functional atlas of the mouse prostate cancer mesenchyme.
a Dot plot showing the mean expression of marker genes for the common clusters (c0-c2). The boxes mark the clusters identified by each set of marker genes. The total number of cells in each cluster is indicated by the bar plot on the right. Significantly enriched regulons identified by gene regulatory network analysis are denoted on top of each boxed cluster. The color scale represents the mean gene expression in the cell groups. b Representative images of C3 and GPX3 overexpression in tumor desmoplastic stroma in the NP model (n = 3) (left panels) and matching WTs (n = 3) (one representative image for each model) (right panels). All images are at ×200 magnification with a scalebar of 300 µm. c Chord diagram of the significant ligand-receptor interactions from the epithelium to the common stromal clusters (c0-c2). Each sector represents a different cell population, and the size of the inner bars indicates the signal strength received by their targets. Communication probabilities were calculated after adjusting for the number of cells in each cluster. The displayed interactions are derived from all examined mouse models. Non-transformed basal cells and basal-like tumor epithelial cells are all grouped under the term basal. P-values are computed from a permutation test by randomly permuting the cell group labels (100 permutations), and then recalculating the communication probability. Only significant interactions (p-value < 0.05) are shown. d Bar plots showing the fraction of different immune cell types in the different mouse models. e Chord diagram showing the significant ligand-receptor interactions from different types of immune cells to the common stromal clusters c0-c2. Each sector represents a different cell population, and the size of the inner bars represents the signal strength received by their targets. Communication probabilities were calculated after adjusting for the number of cells in each cluster. The displayed interactions are derived from all examined mouse models. P-values are computed from a permutation test by randomly permuting the cell group labels (100 permutations), and then recalculating the communication probability. Only significant interactions (p-value < 0.05) are shown. H&E: hematoxylin & eosin staining; WT: wild type.
Fig. 4
Fig. 4. GEMM-specific mesenchymal clusters define complex signaling pathways in the reactive stroma.
a Dot plot showing the mean expression of marker genes for model-specific clusters c3-c7. Boxes indicate the clusters marked by each marker gene set. The total number of cells in each cluster is indicated by the bar plot on the right. Significantly enriched regulons identified by gene regulatory networks are denoted on top of each boxed cluster. The color scale represents the mean gene expression in the cell groups. b Representative images of WIF1 expression in tumor desmoplastic stroma in the T-ERG (n = 4), NP (n = 3), Hi-MYC (n = 3), and PRN (n = 3) mouse models (one representative image for each model). Magnification for all images ×200. Scalebar: 300 µm. c Chord diagrams showing the significantly upregulated ligand-receptor interactions from the luminal-like and basal-like epithelium (upper panel), and immune cells (lower panel) to c3 and c4 in T-ERG compared to Hi-MYC mouse models. d Chord diagrams showing the significant ligand-receptor interactions from the luminal, and neuroendocrine-like epithelium (upper panel), and also from immune cells (lower panel) to the PRN-associated clusters (c5-c7) in the PRN mouse model compared to its wild type. Communication probabilities were calculated after adjusting for the number of cells in each cluster. H&E: hematoxylin & eosin staining.
Fig. 5
Fig. 5. Mesenchymal Periostin overexpression is associated with aggressive, neuroendocrine prostate cancer.
a UMAP projection of PRN clusters c5-c7 (n = 2645 cells) (left), along with the expression levels of Postn (middle) and Ar (right) in prostate mesenchyme (n = 8574 cells). b Dot plots of the mean expression of Postn and Ar in the different mouse models. The color scale represents the mean gene expression. c, d Multiplexed staining for a panel of proteins including Periostin, AR, and Chromogranin in PRN model (n = 3; one representative image of PRN is shown) (c) and human samples (n = 3; one representative image of human sample is shown) (d) showing high Periostin and low AR expression in stroma adjacent to neuroendocrine prostate cancer (NEPC) foci (right panel), and weak to moderate AR expression around in the stroma surrounding adenocarcinoma foci (left panel). Images are captured at ×200 and ×150 magnification for the PRN model and human cases, respectively with a scalebar of 300 µm. e Visium spatial transcriptomics of prostate tissue from the PRN mouse model and its wild type validates the expression of c5-c7 markers. Shown are the H&E-stained tissue sections (left) and overlay of the identified cell types based on gene expression (right). The violin plots compare the expression of Ar and Postn in the stroma. The p-values are derived from a two-tailed t-test, and are as follows: Ar versus Postn expression in PRN stroma (n = 1638 cell spots): p = 1.41e−39, Ar versus Postn expression in WT stroma (n = 1166 cell spots): p = 9.94e−09. f Quantification of 22rv1 overexpressing MYCN and with Rb1 knockdown migration in Boyden chamber transwell assay. Data are expressed as mean ± SEM values of three independent experiments (n = 3, mean ± SEM). One-way ANOVA with Tukey’s test, *p < 0.05, **p < 0.01, ***p < 0.0003. g Comprehensive analysis of scRNA-seq data obtained from primary prostate fibroblasts co-cultured with T-ERG and PRN epithelial cells. The UMAP plot on the left illustrates fibroblasts clustering, with each group annotated based on their genotypic identity indicating their co-culture conditions: T-ERG (n = 10529 cells), PRN (n = 7535 cells), or control group (n = 6921 cells). The UMAP plot on the right shows the fibroblast populations annotated according to their transcriptional similarities to the stromal subtypes identified in the scRNA-seq analysis of prostate tissues: c0 (n = 27), c1 (n = 8182), c2 (n = 19), c3 (n = 9327), c4 (n = 7), c5 (n = 8), c6 (n = 1066), and c7 (n = 6349). CAFs: cancer-associated fibroblasts; H&E: hematoxylin & eosin staining; IF: immunofluorescence; NEPC: neuroendocrine prostate cancer; UMAP: Uniform Manifold Approximation and Projection; WT: wild type.
Fig. 6
Fig. 6. The transcriptional profiles of the PRN-derived clusters are predictive of metastatic progression in prostate cancer.
a Receiver Operating Characteristics (ROC) curve displaying the predictive performance of the PRN signature for metastasis in both the training (n = 930) and testing (n = 309) data. The signature was trained and validated on bulk expression profiles derived from primary tumor samples of PCa patients. AUC: area under the ROC curve. b Kaplan–Meier survival plot illustrating the differences in progression-free survival (PFS) between patients predicted to have metastasis (predicted PFS:1) and those predicted to be metastasis-free (predicted PFS:0) in the TCGA prostate adenocarcinoma cohort (n = 439). The x-axis represents survival time in months. The observed difference in survival is statistically significant with a p-value of <0.0001, assessed using the log-rank test. c Forest plot for multivariate Cox proportional hazards model depicting the hazard ratio (HR) (central black square) and 95% confidence interval (CI) (horizontal lines) for both the PRN signature (p = 0.02) and different Gleason grades (Gleaon 7 p = 0.18, Gleason 8 p = 0.06, Gleason 9 p = 0.01, Gleason 10 p = 0.02). Significance, indicated by an asterisk, is based on the p-value from the Wald test in the Cox model (*p-value < 0.05).
Fig. 7
Fig. 7. Analysis of human scRNA-seq data suggests the relevance of prostate mesenchyme in human PCa pathobiology.
a Parallel categories plot showing the relationship between the mesenchymal clusters and ERG status (left). UMAP projection of the eight mesenchymal clusters (n = 8628 cells) in the human scRNA-seq data (center) and AR expression across the human mesenchymal clusters (right). b Violin plots depicting the expression of marker genes for stromal clusters in the human scRNA-seq data, derived from n = 9 patients, encompassing a total of 8628 individual cells. The width of the violins at different values represents the density of the data. The embedded box plots display the median of the data (white dot), the bounds of the box represent the 25th and 75th percentiles (interquartile range), and the data within these bounds represent the minima and maxima of the non-outlying data. P: p-value derived from Welch’s t-test comparing the expression of each marker gene in each corresponding cluster to its expression in the remaining clusters and are as follows: ACTA2: p < 0.0001, MYL9: p < 0.0001, JUN: p < 0.0001, FOS: p < 0.0001, WNT4: p = 0.0004, RORB: p < 0.0001, POSTN: p = 0.39, SFRP4: p < 0.0001. c UMAP of the selected cell types from the bone metastasis scRNA-seq data derived from Kfoury (left) and their corresponding annotation using the eight mesenchymal clusters definition (middle). d Violin plots showing the mean expression of POSTN, RUNX2, SPP1, and BGN across the mesenchymal clusters in the scRNA-seq bone metastasis cohort from Kfoury, derived from n = 9 bone samples, encompassing a total of 1872 individual cells. The embedded box plots display the median of the data (white dot), the bounds of the box represent the 25th and 75th percentiles (interquartile range), and the data within these bounds represent the minima and maxima of the non-outlying data. P: p-values resulting from Welch’s t-test comparing the expression of each marker gene in c5-c7 versus the remaining clusters and are as follows: POSTN: p < 0.001, BGN: p < 0.0001, RUNX2: p < 0.0001, SPP1: p = 0.08. UMAP: Uniform Manifold Approximation and Projection.

Update of

References

    1. Rebello RJ, et al. Prostate cancer. Nat. Rev. Dis. Prim. 2021;7:9. doi: 10.1038/s41572-020-00243-0. - DOI - PubMed
    1. Robinson D, et al. Integrative clinical genomics of advanced prostate cancer. Cell. 2015;161:1215–1228. doi: 10.1016/j.cell.2015.05.001. - DOI - PMC - PubMed
    1. Shoag J, Barbieri CE. Clinical variability and molecular heterogeneity in prostate cancer. Asian J. Androl. 2016;18:543–548. doi: 10.4103/1008-682X.178852. - DOI - PMC - PubMed
    1. Pederzoli F, et al. Targetable gene fusions and aberrations in genitourinary oncology. Nat. Rev. Urol. 2020;17:613–625. doi: 10.1038/s41585-020-00379-4. - DOI - PubMed
    1. Dakhova O, Rowley D, Ittmann M. Genes upregulated in prostate cancer reactive stroma promote prostate cancer progression in vivo. Clin. Cancer Res. 2014;20:100–109. doi: 10.1158/1078-0432.CCR-13-1184. - DOI - PMC - PubMed

Publication types