. 2013 Jul 3;154(1):185-96.
doi: 10.1016/j.cell.2013.05.056.

The evolution of lineage-specific regulatory activities in the human embryonic limb

Affiliations

The evolution of lineage-specific regulatory activities in the human embryonic limb

Justin Cotney et al. Cell. .

Abstract

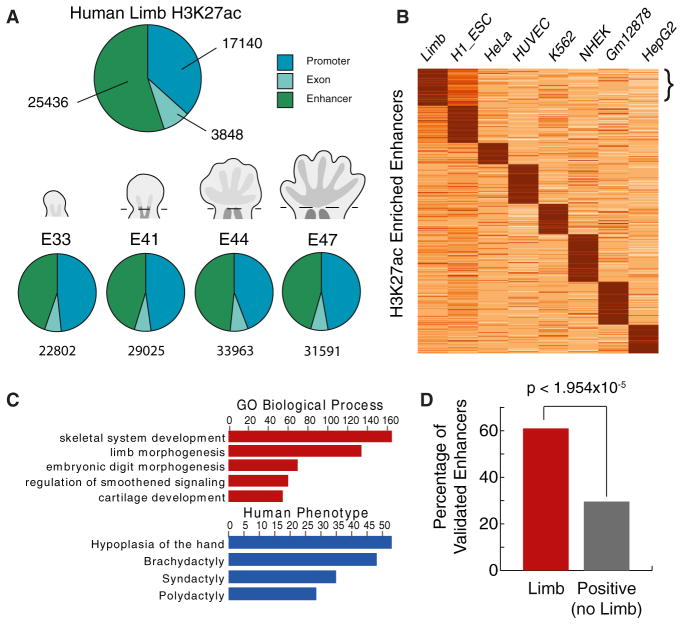
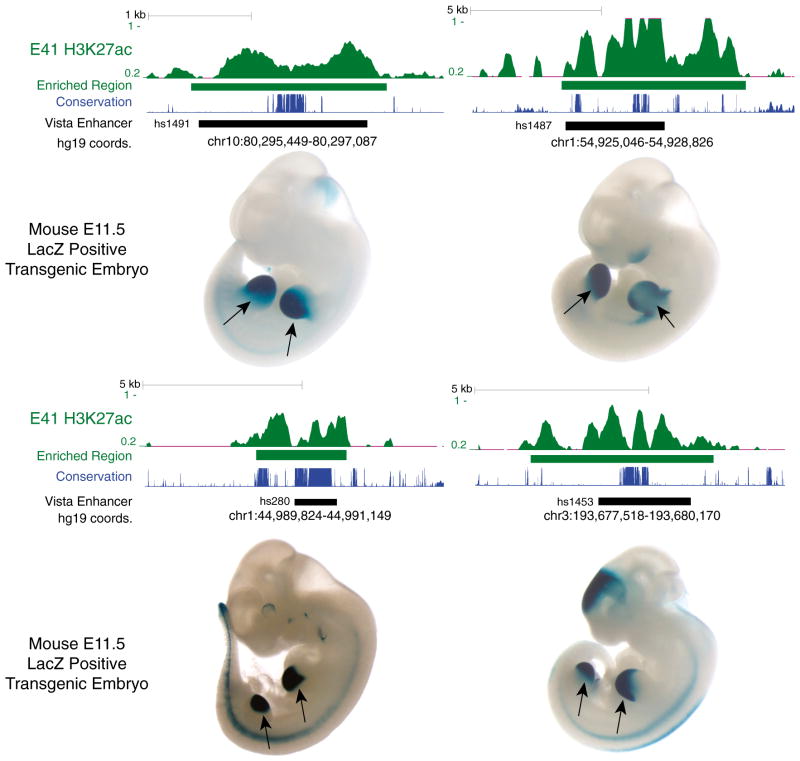
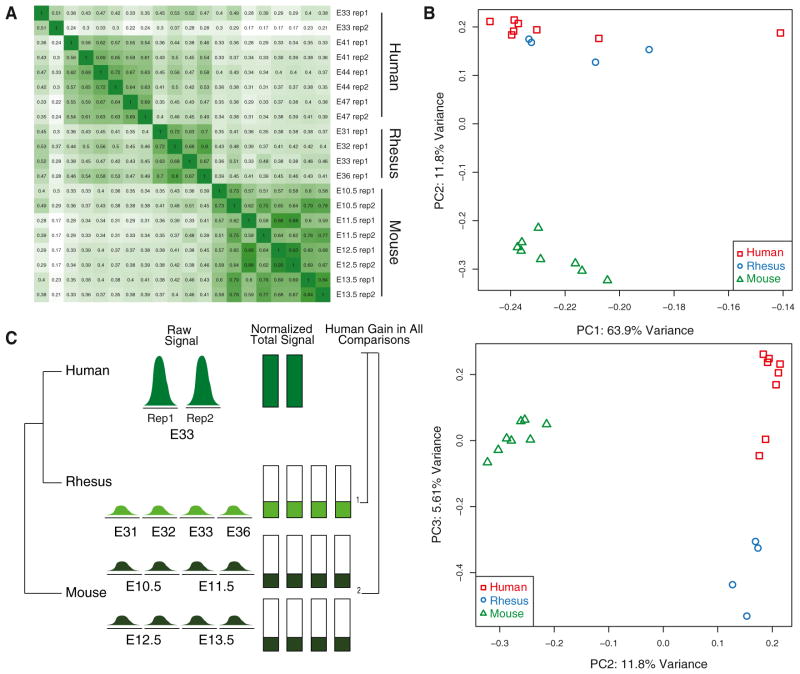
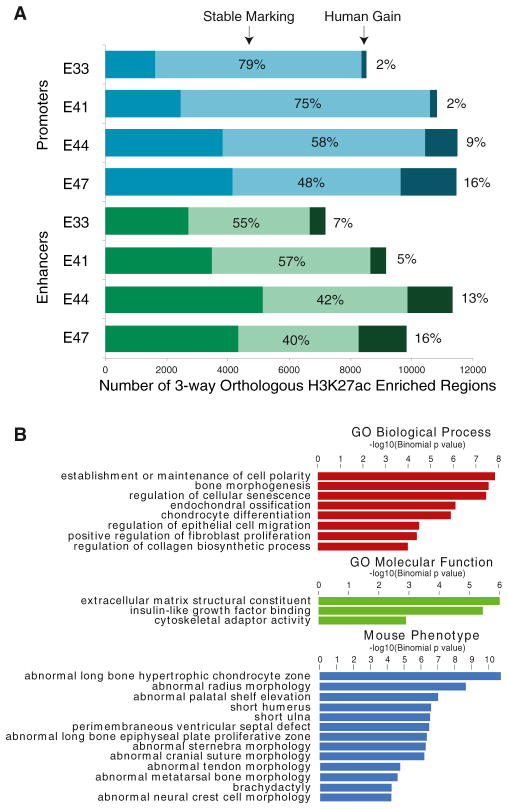
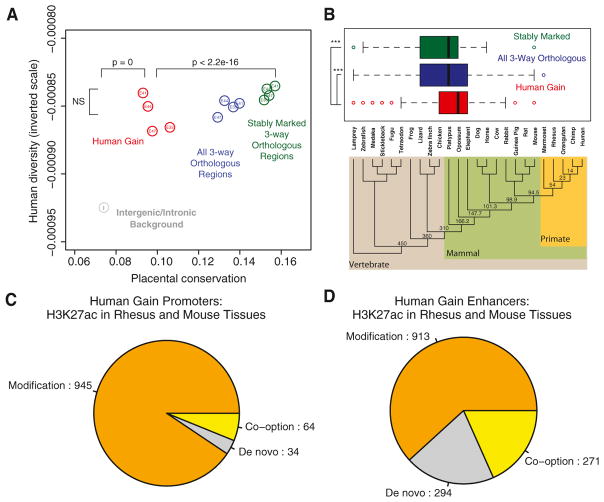
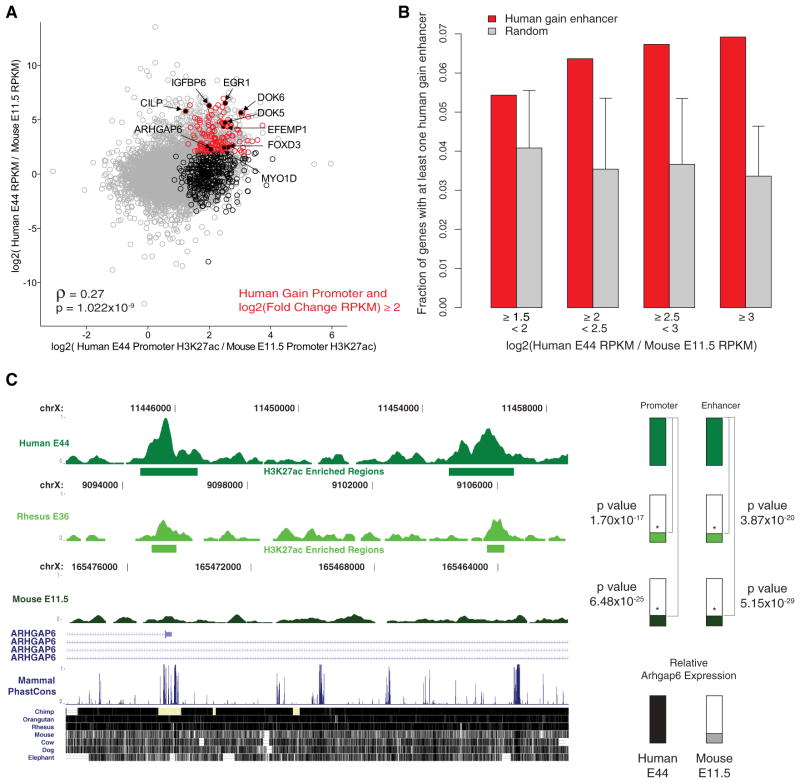
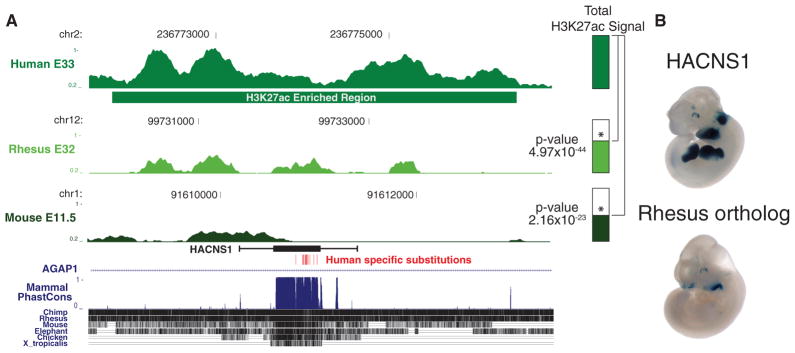
The evolution of human anatomical features likely involved changes in gene regulation during development. However, the nature and extent of human-specific developmental regulatory functions remain unknown. We obtained a genome-wide view of cis-regulatory evolution in human embryonic tissues by comparing the histone modification H3K27ac, which provides a quantitative readout of promoter and enhancer activity, during human, rhesus, and mouse limb development. Based on increased H3K27ac, we find that 13% of promoters and 11% of enhancers have gained activity on the human lineage since the human-rhesus divergence. These gains largely arose by modification of ancestral regulatory activities in the limb or potential co-option from other tissues and are likely to have heterogeneous genetic causes. Most enhancers that exhibit gain of activity in humans originated in mammals. Gains at promoters and enhancers in the human limb are associated with increased gene expression, suggesting they include molecular drivers of human morphological evolution.


Figures

Figure 1
Figure 1. Genome-wide Identification of Promoters and Enhancers Active in Human Embryonic Limb
(A) Annotating reproducible H3K27ac-enriched regions in limb. Top: union of all H3K27ac regions identified at one or more time points. Bottom: annotation at each time point. A schematic of limb morphology is shown for each stage (not to scale). See also Figures S1A and S1B and Table S1. (B) K-means clustering of H3K27ac signals across 104,228 putative enhancer regions identified in human limb or ENCODE cell lines (k = 8). The bracket indicates a cluster of enhancers strongly marked in limb compared to the other data sets. See also Figure S1D. (C) Gene ontology and human phenotype enrichments calculated by GREAT (McLean et al., 2010) (y axis = −log10 binomial p value) for the strong limb-specific enhancers in (B). See also Figure S1D. (D) Percentage of human enhancers annotated in the VISTA Enhancer Browser as active in limb or other tissues that are marked by H3K27ac in human limb (Visel et al., 2007). The p value was calculated using Fisher’s exact test.
Figure 2
Figure 2. H3K27ac Signal Profiles in Human Embryonic Limb at Experimentally Validated Enhancers
The normalized H3K27ac signal (Extended Experimental Procedures) and corresponding enriched region (green), in human E41 limb bud at four sequences demonstrated in a mouse transgenic enhancer assay to drive reproducible LacZ expression in E11.5 mouse limb (indicated by arrows). Images and enhancer locations were obtained from the VISTA Enhancer Browser (http://enhancer.lbl.gov) (Visel et al., 2007). The location of each sequence tested in the enhancer assay is shown as a black bar, accompanied by the corresponding genomic coordinates (UCSC hg19 assembly) and VISTA identifier. The level of sequence conservation (phastCons scores) at each site in placental mammals is shown in blue.
Figure 3
Figure 3. Cross-Species Comparisons of H3K27ac Marking in the Embryonic Limb
(A) Spearman correlation matrix of H3K27ac signal at orthologous sites in all three species generated by this study. (B) Principal component analysis of H3K27ac signal at orthologous sites in all data sets. The proportion of variance explained by the first three components is shown. See also Figure S3B. (C) A schematic illustrating the cross-species H3K27ac signal comparison strategy used in this study. An idealized example of human lineage gain at E33 is shown. See also Figures S2 and S3A and Table S2.
Figure 4
Figure 4. Identification of Promoters and Enhancers with Human Lineage Gain of H3K27ac
(A) Number of orthologous promoters and enhancers marked by H3K27ac at each time point. The percentage exhibiting stable marking or human lineage gain of marking is indicated in each bar. (B) Gene ontology and mouse phenotype enrichments for human gain enhancers calculated using GREAT (McLean et al., 2010) (y axis = −log10 binomial p value). See also Figure S4 and Tables S2, S3, S4, S6, and S7.
Figure 5
Figure 5. Conservation and Putative Ancestral Activities of Promoters and Enhancers with Human Lineage Increases in H3K27ac
(A) Mean per-element conservation and hetero-zygosity values (1000 Genomes Project Consortium et al., 2012) for all orthologous human limb enhancers (blue), stably marked enhancers (green), human gain enhancers (red), and background intergenic or intronic regions (gray). p values are shown for comparisons discussed in the text. (B) Distribution of age estimates for all orthologous, stably marked, and human gain enhancers at human E44, mapped onto the known phylogeny of vertebrate genomes used in the analysis. We estimated the age of each enhancer by identifying the most distant vertebrate lineage with an orthologous sequence (Extended Experimental Procedures). Estimated ages (in millions of years) for internal nodes in the phylogeny are shown. In the box plots, the right, middle and left bars of the boxes represent the 25th, 50th, and 75th percentiles of the data, respectively. Whiskers extend from the box to the most extreme data point that is <1.5 times the interquartile range. Human gain enhancers show a significantly more recent origin compared to all orthologous and stably marked regions (***, Wilcoxon rank-sum p < 0.0001). See also Figure S5A. (C and D) Inferred human gain mechanisms based on human E44 H3K27ac marking at the orthologous rhesus and mouse position in a total of 19 tissues and cell lines, for promoters (C) and enhancers (D). See also Figures S5B and S6 and Tables S3 and S6.
Figure 6
Figure 6. Human Lineage Increases in H3K27ac Correlate with Human Lineage Regulatory Activities
(A) Comparison of differential promoter H3K27ac marking and differential gene expression in human E44 and mouse E11.5 limb for 7,484 orthologous genes. Spearman rank correlation coefficient and p value, ρ and p respectively, indicate a significant positive correlation between H3K27ac level and gene expression. Grey dots represent 7,484 one-to-one orthologous genes between human and mouse. Black circles indicate 502 human genes associated with human gain promoters. Red circles indicate 142 human genes associated with gain promoters that also show a ≥4-fold change of gene expression in human compared to mouse. Genes with potential roles in human limb phenotypes are named and labeled in black. See also Table S7. (B) Fraction of human gain or the same number of randomly sampled stably marked regions assigned to a gene with the indicated level of increased expression in human E44 limb compared to mouse E11.5 limb (see also Figure S7A). Error bars represent 99.9% quantile values from 1,000 sampling iterations (Extended Experimental Procedures). (C) Limb H3K27ac signal from the indicated human, rhesus, and mouse time points at the promoter (left) and a potential enhancer (right) of the ARGHAP6 gene. Horizontal bars indicate regions of H3K27ac enrichment. Coordinates for human, rhesus, and mouse are for hg19, rheMac2, and mm9 genomes respectively. Vertical green bars indicate total signal in human region and relative signal in orthologous regions from rhesus and mouse; p values indicating significant human lineage increased marking are shown. Vertical black and gray bars indicate relative ARGHAP6 expression determined by human E44 and mouse E11.5 RNA-seq. See also Figure S7B and Table S7.
Figure 7
Figure 7. Human Lineage Increases in H3K27ac Identify an Enhancer with Human-Specific Regulatory Function In Vivo
(A) Normalized H3K27ac signal in human E33 limb at a conserved noncoding sequence exhibiting human-specific accelerated evolution (HACNS1) and at the orthologous positions in rhesus and mouse. The horizontal green bar indicates the H3K27ac-enriched region called in human. The H3K27ac signals at the orthologous positions in rhesus and mouse are also shown for the indicated time points. The location of HACNS1 is indicated in black; whiskers indicate the sequence shown to have human-specific enhancer activity in a mouse transgenic assay. p values indicate significantly increased marking in human compared to rhesus and mouse. See also Tables S2 and S5. (B) Activity of HACNS1 and its rhesus ortholog, indicated by LacZ reporter activity in mouse E11.5 transgenic embryos.

Comment in

References

    1. 1000 Genomes Project Consortium. Abecasis GR, Auton A, Brooks LD, DePristo MA, Durbin RM, Handsaker RE, Kang HM, Marth GT, McVean GA. An integrated map of genetic variation from 1,092 human genomes. Nature. 2012;491:56–65. - PMC - PubMed
    1. Aiello L, Dean C. An Introduction to Human Evolutionary Anatomy. San Diego: Academic Press; 2002.
    1. Alkan C, Coe BP, Eichler EE. Genome structural variation discovery and genotyping. Nat Rev Genet. 2011;12:363–376. - PMC - PubMed
    1. Bramble DM, Lieberman DE. Endurance running and the evolution of Homo. Nature. 2004;432:345–352. - PubMed
    1. Brawand D, Soumillon M, Necsulea A, Julien P, Csárdi G, Harrigan P, Weier M, Liechti A, Aximu-Petri A, Kircher M, et al. The evolution of gene expression levels in mammalian organs. Nature. 2011;478:343–348. - PubMed

Publication types

Associated data