. 2013 Mar 14;495(7440):241-5.
doi: 10.1038/nature11979. Epub 2013 Mar 6.

Ovarian surface epithelium at the junction area contains a cancer-prone stem cell niche

Affiliations

Ovarian surface epithelium at the junction area contains a cancer-prone stem cell niche

Andrea Flesken-Nikitin et al. Nature. .

Abstract

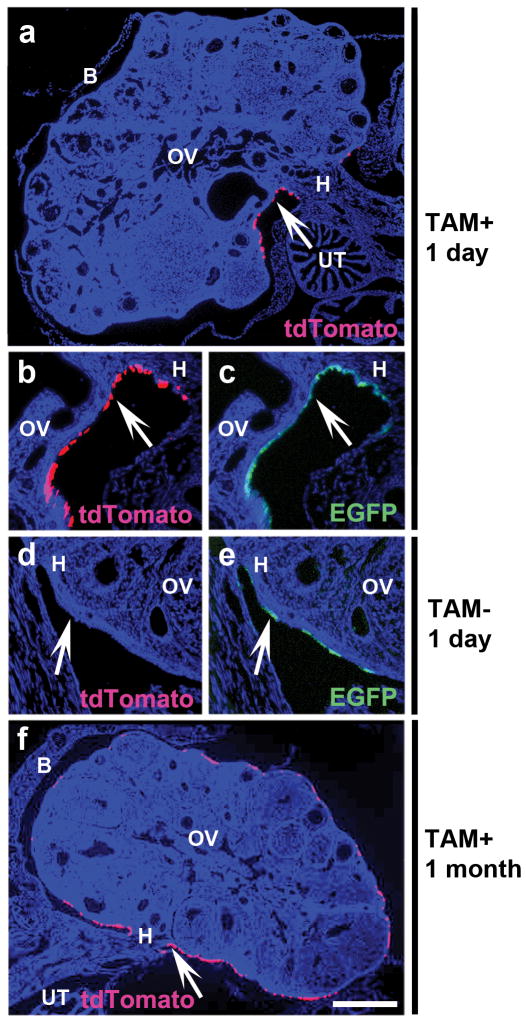
Epithelial ovarian cancer (EOC) is the fifth leading cause of cancer deaths among women in the United States, but its pathogenesis is poorly understood. Some epithelial cancers are known to occur in transitional zones between two types of epithelium, whereas others have been shown to originate in epithelial tissue stem cells. The stem cell niche of the ovarian surface epithelium (OSE), which is ruptured and regenerates during ovulation, has not yet been defined unequivocally. Here we identify the hilum region of the mouse ovary, the transitional (or junction) area between the OSE, mesothelium and tubal (oviductal) epithelium, as a previously unrecognized stem cell niche of the OSE. We find that cells of the hilum OSE are cycling slowly and express stem and/or progenitor cell markers ALDH1, LGR5, LEF1, CD133 and CK6B. These cells display long-term stem cell properties ex vivo and in vivo, as shown by our serial sphere generation and long-term lineage-tracing assays. Importantly, the hilum cells show increased transformation potential after inactivation of tumour suppressor genes Trp53 and Rb1, whose pathways are altered frequently in the most aggressive and common type of human EOC, high-grade serous adenocarcinoma. Our study supports experimentally the idea that susceptibility of transitional zones to malignant transformation may be explained by the presence of stem cell niches in those areas. Identification of a stem cell niche for the OSE may have important implications for understanding EOC pathogenesis.


Figures

Figure 1
Figure 1. Identification and location of putative OSE stem cells
a, OSE sphere, Phase contrast. Bar, 20 μm. b, Confocal imaging of compact (left) and expanded (right) OSE spheres from Tgβ-actin EGFP mice at 4 and 10 days, respectively. Green fluorescence, counterstaining with DAPI, blue. Bar, both images, 50 μm. c, Frequency of sphere formation by ALDH- and ALDH+ OSE cells for 5 consecutive generations (G, dissociation/clonal formation; n = 6, mean ± s.d.). ALDH- derived cells very rarely formed spheres in G2 and did not yield any spheres in G3. d, ALDH1 (brown color) is preferentially expressed in the OSE (arrows) of the hilum region as compared to that of the antral region, corpus luteum or distal region. ALDH1 staining is also present in the theca cells (TC) of the ovary. Rectangles in top left image indicate respective location (clockwise) of the regions in the mouse ovary. Arrowhead, the junction between OSE and tubal epithelium. B, bursa; CL, corpus luteum; F, follicle; H, hilum; OV, ovary; TC, theca cells; UT, uterine tube; U, uterus. 6 weeks old mouse. ABC Elite method, hematoxylin counterstaining. Bar, top left image, 500 μm; all other images, 50 μm. e, Quantification of BrdU label retaining cells (LRCs) in the antral, corpus luteum (CL), distal and hilum regions (n = 4, mean ± s.d.). At 3 months after BrdU pulse two tailed P: hilum (*) versus antral region, 0.0005; versus CL or distal region, < 0.0001. f, Detection of BrdU LRCs (green), ALDH1 (red) and overlay (orange) in the hilum OSE (arrows) after 3 months of chase. Arrowhead, BrdU LRC in the neighboring stroma. Counterstaining with DAPI, blue. Bar, 50 μm.
Figure 2
Figure 2. Functional characterization of the hilum OSE cells
a, Colony formation by OSE cells isolated from the anterior part (Ovary) and the hilum. 4.0 × 10³ cells per plate. Giemsa staining. Bar, 500 μm. b, Quantitative analysis of frequency of large colonies (≥ 20 cells) formed by OSE cells from the anterior part (n = 8, mean ± s.d., 11.4 ± 5.68) and the hilum (n = 6, 42.7 ± 12.8). Two tailed P < 0.0001. c, Frequency of the anterior part and hilum OSE sphere forming cells (SFC) for 1 (Ovary) 1 and 7 (hilum) consecutive generations (G, n = 3, mean ± s.d.). Anterior part derived cells very rarely formed spheres in G2 and did not yield any spheres in G3. d, Gene expression profiles of 3 independent pools (10 mice each) of ALDH- and ALDH+ cells. e, Expression of stem cell markers in ALDH- and ALDH+ cells. Quantitative PCR (n =3, mean ± s.d.; all P values <0.01, except for Lgr6). f, Detection of hilum cells (arrows) expressing CD133, CK6b, Lgr5 and Lef1. Immunofluorescence (CD133, CK6b, and Lef1) or EGFP expression under the control of Lgr5 promoter in Lgr5-EGFP-IRES-creERT2 mouse. All abbreviations as in Fig. 1d. Counterstaining with DAPI, blue. Bar for all images, 50 μm. g, Expression of microRNAs in ALDH- and ALDH+ cells. Quantitative PCR (n = 3, mean ± s.d.; all P values <0.01).
Figure 3
Figure 3. Tracing the fate of the Lgr5+ hilum cells
a-f, Detection of tdTomato (red, a, b, d, f) and EGFP (green, c, e) expression in the ovaries of Lgr5-EGFP-IRES-creERT2 Ai9 mice 1 day (a-e) and 1 month (f) after administration of either tamoxifen (a-c, f) or vehicle (d, e). All abbreviations as in Fig. 1d. Counterstaining with DAPI, blue. Arrows, hilum OSE. Bar, a, f, 600 μm; b-e, 130 μm.
Figure 4
Figure 4. Hilum cells show preferential transformation after conditional inactivation of Trp53 and Rb1
a-c, Characterization of primary OSE cells isolated from the hilum and the remainder of the ovary (Ovary) and evaluated at passage 6 after Cre-loxP mediated inactivation of Trp53 and Rb1. Quantification of BrdU positive OSE cells (a, n = 3, mean ± s.d., P< 0.0001). Detection (b) and quantitative analysis (c) of senescence associated-β-galactosidase (blue) in the ovary and hilum cells (c, n = 3, mean ± s.d., two tailed P = 0.002). Phase contrast. Bar, 500 μm. d, Survival of mice intraperitoneally transplanted with primary ovary (n = 12) and hilum (n = 8) OSE cells deficient for Trp53 and Rb1 (log-rank P = 0.0007). e, Neoplastic masses (arrows) arisen from hilum cells transplanted into the mouse abdominal cavity. f-n, Hilum derived-neoplastic cells have marked nuclear atypia (f), express cytokeratin 8 (CK8, g), are highly proliferative (h), grow in solid, nested and gland-like patterns (f-h, j, k, arrows), invade liver (i, arrow), metastasize to the lung (l-n, arrows) and express Wilms Tumour 1 (j, m) and PAX8 (k, n). Hematoxylin and eosin (HE) and immunostainings, ABC Elite method. Counterstaining with hematoxylin (CK8) and methyl green (Ki67, Wilms Tumour 1, PAX8). Bar, f-h, j, k, 100 μm; i, l-n, 200 μm.

Comment in

  • Stem cells: Anatomy of an ovarian cancer.
    Brenton JD, Stingl J. Brenton JD, et al. Nature. 2013 Mar 14;495(7440):183-4. doi: 10.1038/nature11962. Epub 2013 Mar 6. Nature. 2013. PMID: 23467086 No abstract available.
  • Ovarian cancer: At the starting line.
    Seton-Rogers S. Seton-Rogers S. Nat Rev Cancer. 2013 May;13(5):296-7. doi: 10.1038/nrc3510. Epub 2013 Mar 28. Nat Rev Cancer. 2013. PMID: 23535843 No abstract available.

References

    1. Siegel R, Naishadham D, Jemal A. Cancer statistics, 2012. CA Cancer J Clin. 2012;62:10–29. - PubMed
    1. Lengyel E. Ovarian cancer development and metastasis. Am J Pathol. 2010;177:1053–1064. - PMC - PubMed
    1. Bowtell DD. The genesis and evolution of high-grade serous ovarian cancer. Nat Rev Cancer. 2010;10:803–808. - PubMed
    1. Visvader JE. Cells of origin in cancer. Nature. 2011;469:314–322. - PubMed
    1. Auersperg N. The origin of ovarian carcinomas: a unifying hypothesis. Int J Gynecol Pathol. 2011;30:12–21. - PubMed

Publication types

MeSH terms

Associated data