. 2014 Feb;15(2):152-60.
doi: 10.1038/ni.2784. Epub 2013 Dec 8.

High-density lipoprotein mediates anti-inflammatory reprogramming of macrophages via the transcriptional regulator ATF3

Affiliations

High-density lipoprotein mediates anti-inflammatory reprogramming of macrophages via the transcriptional regulator ATF3

Dominic De Nardo et al. Nat Immunol. 2014 Feb.

Abstract

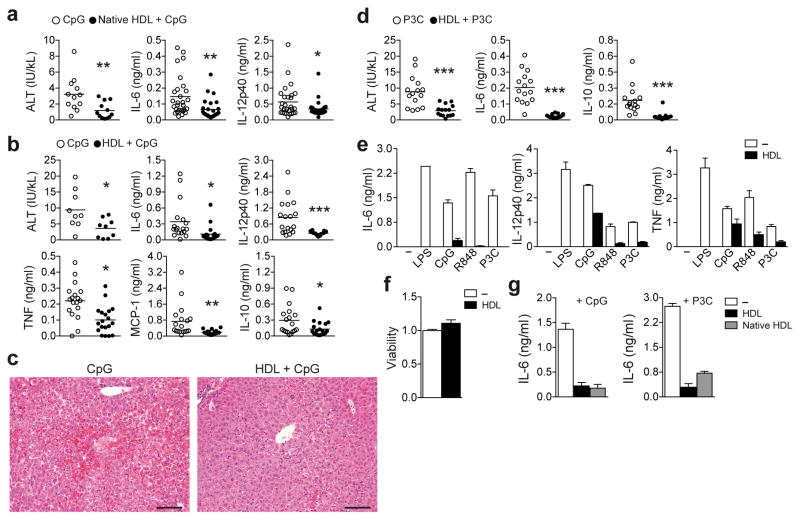
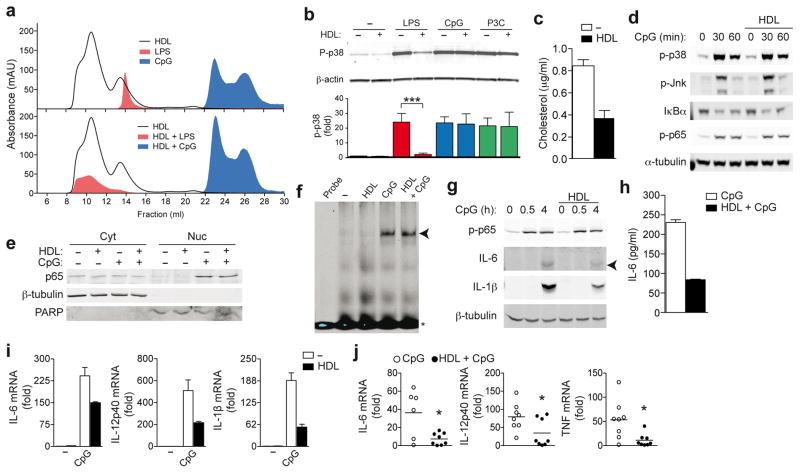
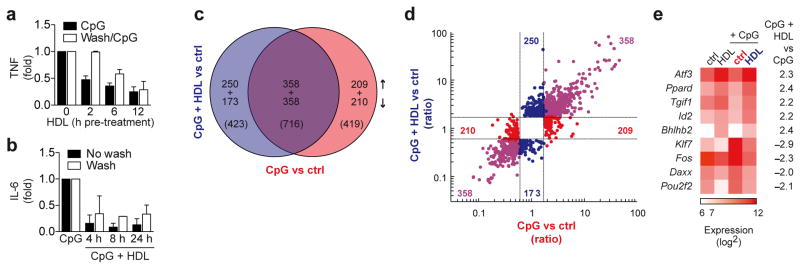
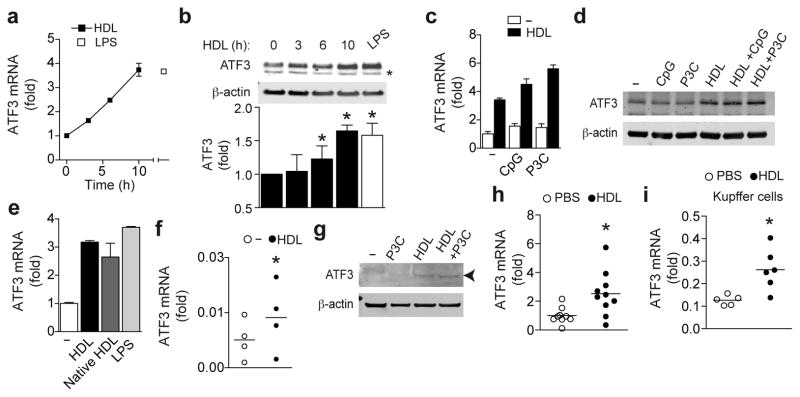
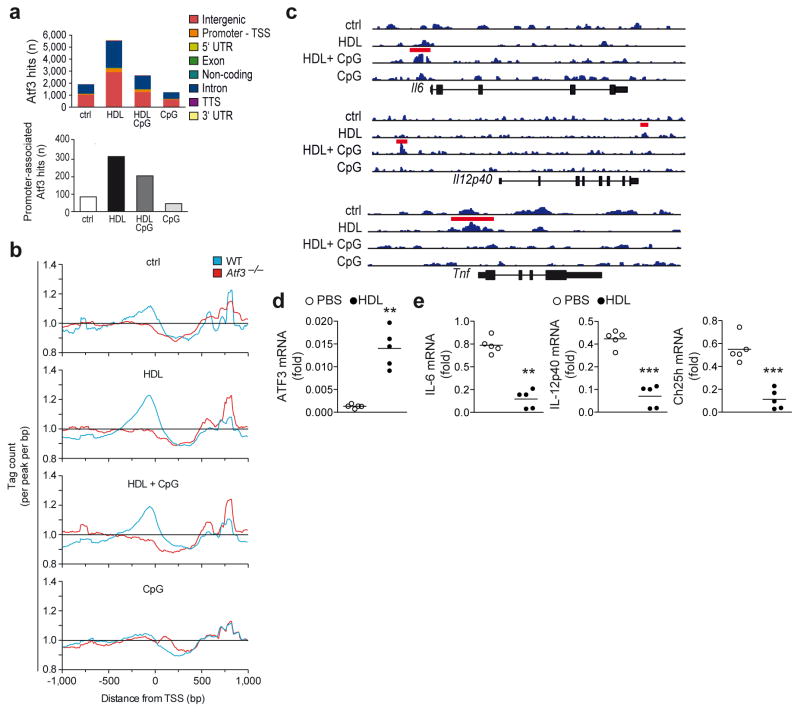
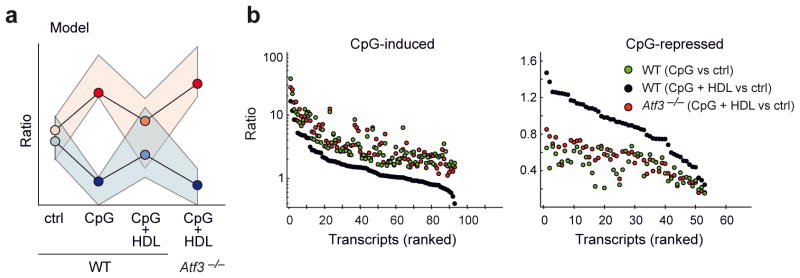
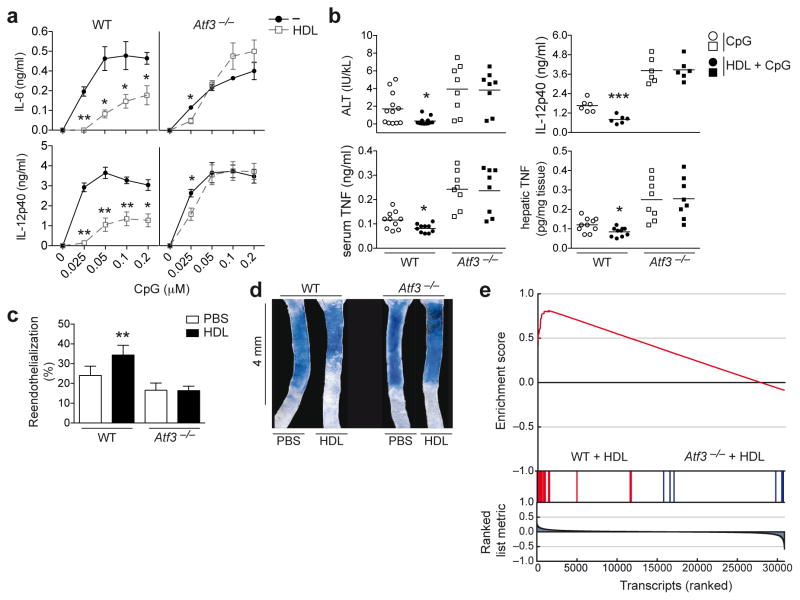
High-density lipoprotein (HDL) mediates reverse cholesterol transport and is known to be protective against atherosclerosis. In addition, HDL has potent anti-inflammatory properties that may be critical for protection against other inflammatory diseases. The molecular mechanisms of how HDL can modulate inflammation, particularly in immune cells such as macrophages, remain poorly understood. Here we identify the transcriptional regulator ATF3, as an HDL-inducible target gene in macrophages that downregulates the expression of Toll-like receptor (TLR)-induced proinflammatory cytokines. The protective effects of HDL against TLR-induced inflammation were fully dependent on ATF3 in vitro and in vivo. Our findings may explain the broad anti-inflammatory and metabolic actions of HDL and provide the basis for predicting the success of new HDL-based therapies.


Conflict of interest statement

COMPETING FINANCIAL INTERESTS

S.D.W is a paid employee of CSL Behring.

Figures

Figure 1
Figure 1
HDL inhibits TLR-induced cytokine production from macrophages in vivo and in vitro. (ad) Mice were injected intraperitoneally (i.p.) with 2 mg HDL for 6 h before i.p. injection of TLR ligand (CpG: 20 μg, P3C 2 μg) and D-galactosamine (10 mg). Serum cytokines were measured after 1 h and serum alanine aminotransferase (ALT) and liver histology after 10 h. a C3H/HeJ mice injected with native HDL and CpG: ALT release (n=12) and serum cytokines (CpG n=28, native HDL+CpG n= 27) were measured. b,c C57BL/6 mice injected with HDL and CpG: ALT release (n=9); serum cytokines (CpG n=18, HDL+CpG n=19) (b), and liver histology by hemotoxylin and eosin staining shows hepatic cell death. (c). d, C57BL/6 injected with HDL and P3C: ALT release (n=15) and serum cytokines (n=15) were measured. e, ELISA of BMDMs treated with 2 mg/ml HDL for 6 h followed by overnight stimulation with the TLR4 ligand, LPS (100 ng/ml); TLR9 ligand, CpG (100 nM); TLR7/8 ligand, R848 (5 ng/ml); or TLR2/1 ligand P3C (50 ng/ml). f, Cell viability was measured with CellTitre- Blue® reagent. g, BMDMs were pre-treated with recombinant or native HDL (2 mg/ml) for 6 h and stimulated overnight with CpG (100 nM) or P3C (50 ng/ml) and IL-6 cytokine secretion measured by ELISA. a,b,d Data are presented as mean values ±S.E.M, CpG versus HDLs+CpG *p<0.05, **p<0.01, ***p<0.005, c, images are representative of mice with median ALT concentration; scale bars, 100 μm, e,f,g data is shown as mean ±S.D. and is representative of at least three independent experiments.
Figure 2
Figure 2
HDL inhibits TLR-induced pro-inflammatory cytokine transcription. a, Bodipy-labeled LPS, Alexa 647-labeled CpG 1826 or HDL were run over an S200 size exclusion column separately (a, upper panel) or together (a, lower panel) and absorbance profiles examined. b, LPS (200 ng/ml), CpG (100 nM) or P3C (50 ng/ml) were incubated with HDL (2 mg/ml), and BMDMs stimulated for 30 min. Whole cell lysates were analyzed for p38 phosphorylation (p-p38) relative to total β-actin. c,d BMDMs were pre-treated with HDL (2 mg/ml) for 6 h before stimulation with CpG (100 nM) for indicated times: total cellular cholesterol (c) and phosphorylation of p38, JNK, NF-κB p65 and IκBα degradation (d). e,f BMDMs were pre-treated with HDL as before, and stimulated with CpG (100 nM) for 30 min: subcellular localization of NF-κB p65 (β-tubulin: cytoplasmic loading control; poly ADP ribose polymerase (PARP): nuclear loading control) (e) and NF-κB binding to a target probe as analysed by EMSA (f). g,h BMDMs were pre-treated with HDL as before: CpG-induced phospho-NF-κB p65 and intracellular IL-6 and IL-1β were measured in whole cell extracts, (g); secreted IL-6 measured by ELISA (h). mRNA expression of BMDMs pre-treated with HDL as before, and stimulated with 100 nM CpG for 4 h (i). j, Liver mRNA profile 1 h after C57BL/6 mice were injected with CpG following 6 h HDL pre-treatment (n=8). a, Data is representative of at least three independent experiments. b, Representative immunoblot and densitometric analysis combined from three independent experiments (mean ±S.E.M, each ligand; no HDL versus HDL incubation ***p<0.005). ci, Representative data from at least three independent experiments (mean ±S.D). j, Mean values ±S.E.M, CpG versus HDL+CpG *p<0.05.
Figure 3
Figure 3
Microarray analysis identifies ATF3 as a candidate gene for the anti-inflammatory function of HDL. a, Immortalized-BMDMs were pre-treated with HDL (2 mg/ml) for indicated times, then either washed twice in serum-free DMEM, or left unwashed, before overnight stimulation with CpG (100 nM). TNF secretion was measured by ELISA and normalized to CpG treatment alone. b, BMDMs were pre-treated with HDL (2 mg/ml) for 12 h, then either washed twice in serum-free DMEM, or left unwashed, before stimulation with CpG (100 nM) for indicated times. IL-6 was measured in culture supernatants and normalized to CpG treatment alone. cf, Microarray analysis of BMDMs pre-treated for 6 h with HDL (2 mg/ml) then stimulated with CpG (100 nM) for 4 h. c, Venn diagram shows genes with differential expression (vs control) and the overlap in these genes (Fold Change limit 1.8, False discovery rate p<0.05). d, A fold change/fold change plot shows directional gene expression resulting from CpG treatment (red), CpG and HDL treatment (blue) or genes that are co-regulated in both treatments (purple). e, Expression of transcription factors following HDL, CpG or combined treatment as described in the methods and presented as a heat map. TFs are ranked according change in expression across treatments, while color intensity shows the mean expression value per condition. a,b, Representative data from at least three independent experiments (mean ±S.D) ce, At least three biological replicates per condition were generated.
Figure 4
Figure 4
HDL induces ATF3 expression. a,b, BMDMs were treated with HDL (2 mg/ml) for the indicated time points or LPS (200 ng/ml) for 6 h, and ATF3 mRNA expression (a) or protein (*indicates a non-specific band) relative to total β-actin was analyzed (b) c,d, BMDMs were pre-treated with HDL (2 mg/ml) for 6 h and stimulated with CpG (100 nM) or P3C (50 ng/ml) for 4 h : ATF3 mRNA (c) and ATF3 protein (d). e, BMDMs were treated with HDL or native HDL (2 mg/ml) or LPS for 10 h and ATF3 mRNA expression was measured by qPCR (e). f,g CD14+ monocytes were pre-treated with HDL as before, and stimulated with P3C (1 μg/ml) for 4 h; ATF3 mRNA expression (f) or protein (g). h,i, qPCR analysis of ATF3 mRNA expression in the livers (n=9) (h) or Kupffer cells (n=6) (i) of C57BL/6 mice 10 h after 2 mg i.p. HDL injection. a,c,e One of at least three independent experiments shown (mean ±S.D.) b, Representative immunoblot and densitometric analysis combined from four independent experiments (mean ±S.E.M, untreated versus HDL treated *p<0.05). d,g, Representative blot of at least two separate experiments. f, Data is represented as the mean from four individual donors (one-tailed student t test, untreated versus HDL treated *p<0.05) h,i Data are shown as the mean ±S.E.M, PBS versus HDL injected mice *p<0.05.
Figure 5
Figure 5
ATF3 is active following induction by HDL. ac, ATF3 ChIP sequencing of BMDMs pre-treated with HDL (2 mg/ml) for 6 h followed by stimulation with CpG (100 nM) for 4 h. Distribution of ATF3 binding within the genome (upper) and promoter regions (lower panel) (a) and global ATF3 peak localization relative to transcription start site (TSS); normalized average of tags per peak per bp from −1kb to +1kb (b). Genomic loci of Il6, Il12p40 and Tnf with ChIP-Seq signals for ATF3 binding under the stimulation conditions, red bars indicate significant peaks (c). d,e qPCR analysis of ATF3, IL-6, IL-12p40 or Ch25h mRNA expression in livers from Apoe-deficient mice fed on a high fat diet diet and injected intravenously (i.v.) with PBS or HDL (100 mg/kg) (n=5). ac, At least three biological replicates per condition were generated. d,e Data are shown as the mean ±S.E.M, PBS versus HDL **p<0.01, ***p<0.001.
Figure 6
Figure 6
ATF3 mediates much of the transcriptional response to HDL treatment of macrophages. ab, Microarray and ChIP-Seq analysis of WT and Atf3-deficient BMDMs pre-treated with HDL (2 mg/ml) for 6 h and subsequently stimulated for 4 h with CpG (100 nM) or P3C (50 ng/ml). a Schematic representation of the model used to identify ATF3 target genes (also see Methods). b Visualization of transcripts induced (left panel) or repressed (right panel) by CpG. At least three biological replicates per condition were generated.
Figure 7
Figure 7
ATF3 is required for the anti-inflammatory effect of HDL in vitro and in vivo. a, ELISA from WT or Atf3-deficient BMDMs pre-treated with HDL (2 mg/ml) for 6 h prior to overnight stimulation with CpG (indicated doses). b, WT or Atf3-deficient mice injected i.p with HDL (2 mg) 6 h before subsequent injection with CpG (30 μg) and D-gal (10 mg) for a further 10 h. Serum ALT, serum TNF and hepatic TNF (WT n=10, Atf3−/− n=8,), and serum IL-12p40 (n=6) were measured. c,d, HDL increased re-endothelialization after carotid artery injury in WT, but not Atf3-deficient mice. Carotid injury was performed on WT or Atf3-deficient mice, 3 h later PBS or HDL (20 mg/kg) was injected i.v. Re-endothelialization was evaluated 3 days following carotid injury (WT PBS n=8, WT HDL n=7, Atf3−/− PBS n=7, Atf3−/− HDL n=9). e Gene set enrichment analysis using the macrophage/carotid injury overlapping gene set applied to the carotid injury dataset assessing gene enrichment in HDL treated samples derived from WT versus Atf3−/− mice. a, Combined data from three independent experiments are shown as the mean ±S.E.M (WT versus Atf3−/− *p<0.05, **p<0.01). b, Data are presented as mean values ±S.E.M, CpG versus HDL+CpG (per genotype) *p<0.05, ***p<0.001. c, Data are presented as mean values ±S.E.M, PBS vs HDL (per genotype) **p<0.01. d, Images are representative of each group in each genotype. e, At least three biological replicates per condition were generated.

Comment in

References

    1. Takeuchi O, Akira S. Pattern recognition receptors and inflammation. Cell. 2010;140:805–820. - PubMed
    1. Medzhitov R, Horng T. Transcriptional control of the inflammatory response. Nat Rev Immunol. 2009;9:692–703. - PubMed
    1. Gilchrist M, et al. Systems biology approaches identify ATF3 as a negative regulator of Toll-like receptor 4. Nature. 2006;441:173–178. - PubMed
    1. Hai T, Wolford CC, Chang YS. ATF3, a hub of the cellular adaptive-response network, in the pathogenesis of diseases: is modulation of inflammation a unifying component? Gene Expr. 2010;15:1–11. - PMC - PubMed
    1. Whitmore MM, et al. Negative regulation of TLR-signaling pathways by activating transcription factor-3. J Immunol. 2007;179:3622–3630. - PubMed

Publication types

MeSH terms

Associated data