. 2013 May 2;12(5):573-86.
doi: 10.1016/j.stem.2013.04.005.

Functional maturation of hPSC-derived forebrain interneurons requires an extended timeline and mimics human neural development

Affiliations

Functional maturation of hPSC-derived forebrain interneurons requires an extended timeline and mimics human neural development

Cory R Nicholas et al. Cell Stem Cell. .

Abstract

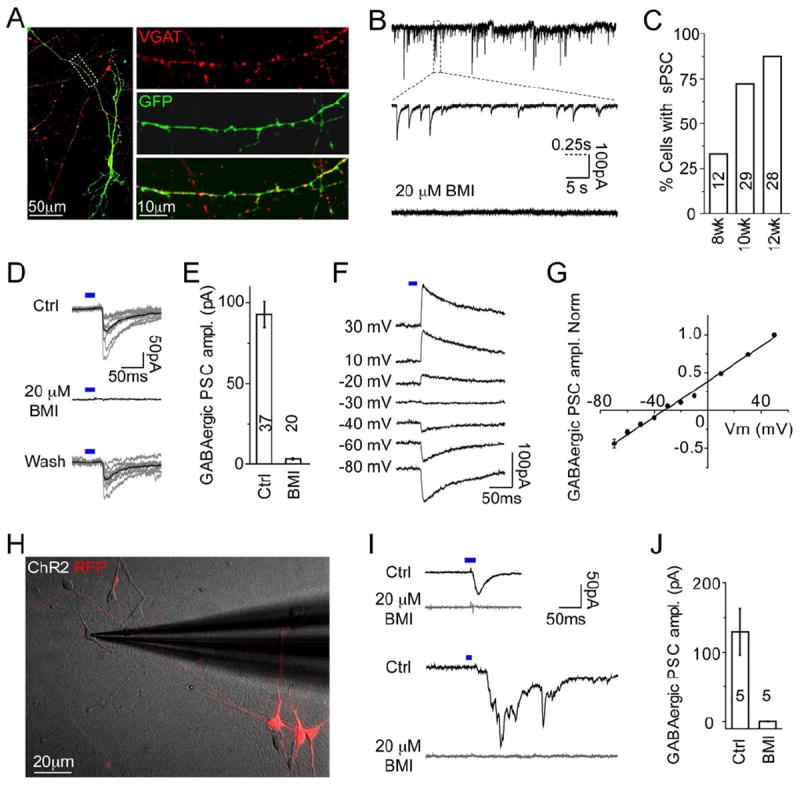
Directed differentiation from human pluripotent stem cells (hPSCs) has seen significant progress in recent years. However, most differentiated populations exhibit immature properties of an early embryonic stage, raising concerns about their ability to model and treat disease. Here, we report the directed differentiation of hPSCs into medial ganglionic eminence (MGE)-like progenitors and their maturation into forebrain type interneurons. We find that early-stage progenitors progress via a radial glial-like stem cell enriched in the human fetal brain. Both in vitro and posttransplantation into the rodent cortex, the MGE-like cells develop into GABAergic interneuron subtypes with mature physiological properties along a prolonged intrinsic timeline of up to 7 months, mimicking endogenous human neural development. MGE-derived cortical interneuron deficiencies are implicated in a broad range of neurodevelopmental and degenerative disorders, highlighting the importance of these results for modeling human neural development and disease.


Figures

Figure 1
Figure 1. hPSC-derived MGE-like Progenitors Exhibited VZ and SVZ Radial Glial-like Stem Cell Divisions
(A) Schematic of neuronal lineages emanating from the MGE, their gene expression profiles, and major cortical interneuron subtypes. Abbreviations: INs – Interneurons, PNs – Projection Neurons, FS – Fast Spiking, RSNP – Regular Spiking Non-Pyramidal, NFS – Non-Fast Spiking, DS – Delayed Spiking, BSNP – Burst Spiking Non-Pyramidal. (B) Outline of B27+5F method and corresponding figures. Abbreviations: sEB= suspension embryoid body; aEB= adherent embryoid body; ML= monolayer; FACS= fluorescence activated cell sorting; Y27632= Rho-associated kinase (ROCK) inhibitor; SB431542= inhibitor of the TGFβ1 activin receptor-like kinases; BMPRIA= Bone Morphogenetic Protein Receptor 1a Fc chimera; DKK1= Dickkopf homolog 1; PM= Purmorphamine; BDNF= Brain-derived Neurotrophic Factor; DAPT= inhibitor of γ-secretase. See also Supplemental Experimental Procedures, Figures S1-3, and Table S1. (C) Day 14 NKX2.1-GFP expression and a panel of markers in red shown merged and separate: N-Cadherin, KI67, and DCX. Blue: DAPI. Scale Bar: 50 μm. (D) A cluster of rosettes with RFP fluorescence alone or merged with NKX2.1-GFP. (E) NKX2.1-GFP expressing cells outside of the clusters. D,E Scale Bar: 100 μm. (F) Time-lapse imaging series of boxed region (D) showing three RFP+ cells (blue, orange, and green arrowheads) that displayed vRG-like INM behavior: translocation toward the rosette lumen and division (star) with a vertical cleavage plane. Time: hours. Scale Bar: 20 μm. See also Movie S1. (G) Time-lapse series of boxed region (E). A GFP+ cell with characteristic unipolar morphology (white arrowhead and smaller arrowheads to mark fiber) exhibited oRG-like MST behavior: translocation toward the fiber (46μm) and division (star) with a horizontal cleavage plane. Time: hours. Scale Bar: 50 μm. See also Movies S2 and S3.
Figure 2
Figure 2. hPSC-derived MGE-like Progenitors Differentiated into Neurons with Properties of Telencephalic GABAergic Interneurons
(A) aEBs fixed for immunofluorescence analysis on day 25. (B) Day 25 MGE-like progenitor cells robustly expressed NKX2.1-GFP, NKX2.1, FOXG1, and OLIG2. Some expressed ASCL1 and DLX2. Blue: DAPI. Scale Bar: 50 μm. (C) aEBs dissociated, replated as a ML, and fixed for day 35 immunofluorescence. (D) Day 35 dissociated cells continued to express NKX2.1-GFP, NKX2.1, and FOXG1, and upregulated TUJ1, ASCL1, DCX, DLX2, and GABA. Blue: DAPI. Scale Bar: 50 μm. (E) Quantification of day 35 immunostaining. The majority of NKX2.1-GFP+ cells expressed NKX2.1, FOXG1, ASCL1, TUJ, GABA, and DLX2. Data represented as mean ± SEM.
Figure 3
Figure 3. Microarray Gene Expression Profiling of hPSC-derived MGE-like NKX2.1-GFP+ Cell Populations
(A) Schematic and legend for microarray data. Undifferentiated hPSCs (black); and FACS-sorted GFP+ cells from day 20 aEBs (blue), day 35 ML cultures (orange), and GFP+ cells from d35 co-cultured to day 55 (green). (B) Representative FACS histogram analysis of each differentiation stage and undifferentiated hPSC controls (black). (C-H) Average transcript hybridization signal intensities for marker panels. IN=interneuron, DA=dopaminergic, ACh=cholinergic, Glu=glutamatergic. Data represented as mean ± SEM. See also Figure S4.
Figure 4
Figure 4. Maturation of hPSC-derived GABAergic Interneurons Expressing Subtype Markers
(A) Dissociated ML cultures infected with UbC-RFP lentivirus, FACS-sorted on day 35 for GFP+ and RFP+ cells, and co-cultured. (B) RFP+ neurons increased in size and dendritic complexity over time. Scale Bar: 20 μm. Cell somal size (μm) and # of primary branches quantified as mean ± SEM. (C) Quantification of immunostaining analyses over 30 WPD. Data represented as mean ± SEM. (D) Immunostaining of 30 WPD cultures showing highly branched RFP+ neurons that expressed VGAT, SST, CALB, and CALR. Scale Bar: 50 μm. (E-F) hPSC-derived TUJ1+ neurons at 15 WPD expressed LHX6, CXCR4, and PV. Some LHX6+, and most CXCR4+ and PV+, neurons downregulated NKX2.1 (arrows), suggesting a cortical-type interneuron lineage. (G) Double immunolabeling for SST and CR at 30 WPD. Single positives (arrows) and double positive (double arrows). E-G Scale Bars: 20 μm. See also Figure S5.
Figure 5
Figure 5. Maturation of hPSC-derived Interneuron Firing Properties
(A) DIC image of hPSC-derived neurons at 12 and 30 WPD, insets show RFP expression of recorded neurons. (B) hPSC-derived neuron labeled by intracellular filling with neurobiotin immunostained positive for SST at 30 WPD (C) Representative AP firing patterns at each stage upon near threshold (top) and superthreshold (bottom) current injection, and AP velocity (dV/dt) at threshold firing (middle). Scale bars: 50 mV or 40 Vs-1 for dV/dt, 100 ms. See also Figure S6. (D) Average first AP traces upon threshold current injection. Scale bars: 25 mV and 25 ms. (E) Statistical results showing AHPs at each stage (dashed line=baseline). (F) I-V curve of Na+ (I) and K+ currents (G) at each stage, measured under stepped voltages (500 ms duration). (H) Representative AP firing patterns of 22 gestational week (gw) human fetal cortical neurons upon near threshold (upper) and superthreshold (lower) current injection. Scale bars 50 mV and 100 ms. (I) Statistical results showing membrane resistance (Rm), resting membrane potential (RMP), membrane capacitance (Cm), and action potential (AP) 1/2-width. E, F, G, I: Data represented as mean ± SEM. ** represents p < 0.01, *** represents p < 0.001.
Figure 6
Figure 6. Functional GABAergic Synaptic Properties of hPSC-derived Interneurons
(A) Images showing VGAT expression in hPSC-derived NKX2.1-GFP+ neurons at 12 WPD. Right: zoom of dashed rectangle. Scale bar: left, 50 μm; right, 10 μm. (B) Traces showing spontaneous post-synaptic currents (PSCs) in hPSC-derived neurons, bottom: PSCs were fully blocked by BMI. Scale bar: 100 pA, 5 s and 0.25 s (dashed line) for middle trace. (C) Percentage of neurons showing spontaneous PSCs at different stages. (D) hPSC-derived neurons were transfected with ChR2-EYFP. Traces show pulses of blue light (blue bar) evoked PSCs in neighboring cells that were reversibly blocked by BMI. Scale bar: 50 pA and 50 ms. See also Figure S6. (E) Average amplitudes of light-evoked GABAergic PSCs and application of BMI. (F-G) Traces showing light-evoked (blue bar) PSCs at different holding potentials. Summarized results (n=7) showing I-V curve of light-evoked GABAergic PSCs (G). (H) Merged image showing DIC of human fetal cortical cells co-cultured with sorted UbC-RFP+ and ChR2 transfected hPSC-derived neurons. Scale bar: 20 μm. (I) Traces showing blue light (blue bar) stimulation of hPSC-derived neuron-evoked PSCs in RFP-negative recorded human fetal cortical neurons. Upper panel shows PSC mono-synaptic response, lower panel shows PSC with poly-synaptic responses – both fully blocked by BMI. Scale bar: 50pA and 50 ms. (J) Averaged amplitudes of light-evoked PSCs and application of BMI. E, J: Data represented as mean ± SEM.
Figure 7
Figure 7. hPSC-derived Interneuron Subtype Maturation and Functional Integration in the Mouse Brain
(A) hPSC-derived MGE-like interneuron precursors FACS-sorted for NKX2.1-GFP and PSA-NCAM, labeled with YFP or RFP virus, and injected into newborn mouse cortex. See also Supplemental Experimental Procedures and Table S2. (B) Human nuclei+ cells expressed DCX and migrated into the cortex by 3 months post-injection (MPI). Blue: DAPI. Scale Bar: 100μm. Right panel is zoom of dashed rectangle in separate channels and merged. Scale Bar: 20μm. See also Figure S7. (C-D) Quantification of lineage-specific marker histology at 2 (black), 4 (orange), and 7 (blue) MPI with d35 ML cells (C), or of subtype markers at 3 (black, blue) and 6 (orange, green) MPI with d50 aEB cells (D). Plotted as human cells near or dispersed from the injection site. Data represented as mean ± SEM. (E) Histological analysis of human nuclei+ cells pre-labeled with Syn-YFP at 6 MPI that co-expressed (arrow) subtype markers. Blue: DAPI. Scale Bar: 20 μm. See also Figure S5. (F) hPSC-derived neuron labeled by intracellular filling of neurobiotin (NB, green). Inset: UbC-RFP fluorescence of filled neuron 7 MPI. Scale bar: 20 μm; inset 5 μm. (G) Traces of AP firing patterns of type I (left) and type II (right) hPSC-derived neurons upon near threshold (top) and superthreshold (bottom) current injection at 7 MPI. Scale bars: 50 mV and 100 ms. See also Figure S7. (H) Left panel: traces of spontaneous PSCs recorded from hPSC-derived neurons at 7 MPI; upper right: BMI blocked PSCs with slow decay-time (arrow), and the remaining PSCs with fast decay-time (arrow head) were blocked by subsequent application of CNQX (lower right panel). Scale bars: 50 pA, 2.5 s and 0.2 s (dashed line) for zoomed traces.

Comment in

References

    1. Anderson SA, Marin O, Horn C, Jennings K, Rubenstein JL. Distinct cortical migrations from the medial and lateral ganglionic eminences. Development. 2001;128:353–363. - PubMed
    1. Braz JM, Sharif-Naeini R, Vogt D, Kriegstein A, Alvarez-Buylla A, Rubenstein JL, Basbaum AI. Forebrain GABAergic neuron precursors integrate into adult spinal cord and reduce injury-induced neuropathic pain. Neuron. 2012;74:663–675. - PMC - PubMed
    1. Butt SJ, Fuccillo M, Nery S, Noctor S, Kriegstein A, Corbin JG, Fishell G. The temporal and spatial origins of cortical interneurons predict their physiological subtype. Neuron. 2005;48:591–604. - PubMed
    1. Chambers SM, Fasano CA, Papapetrou EP, Tomishima M, Sadelain M, Studer L. Highly efficient neural conversion of human ES and iPS cells by dual inhibition of SMAD signaling. Nat Biotechnol. 2009;27:275–280. - PMC - PubMed
    1. Chao HT, Chen H, Samaco RC, Xue M, Chahrour M, Yoo J, Neul JL, Gong S, Lu HC, Heintz N, et al. Dysfunction in GABA signalling mediates autism-like stereotypies and Rett syndrome phenotypes. Nature. 2010;468:263–269. - PMC - PubMed

Publication types

MeSH terms

Associated data