. 2013 Jul 19;341(6143):1238303.
doi: 10.1126/science.1238303.

Tight coordination of protein translation and HSF1 activation supports the anabolic malignant state

Affiliations

Tight coordination of protein translation and HSF1 activation supports the anabolic malignant state

Sandro Santagata et al. Science. .

Abstract

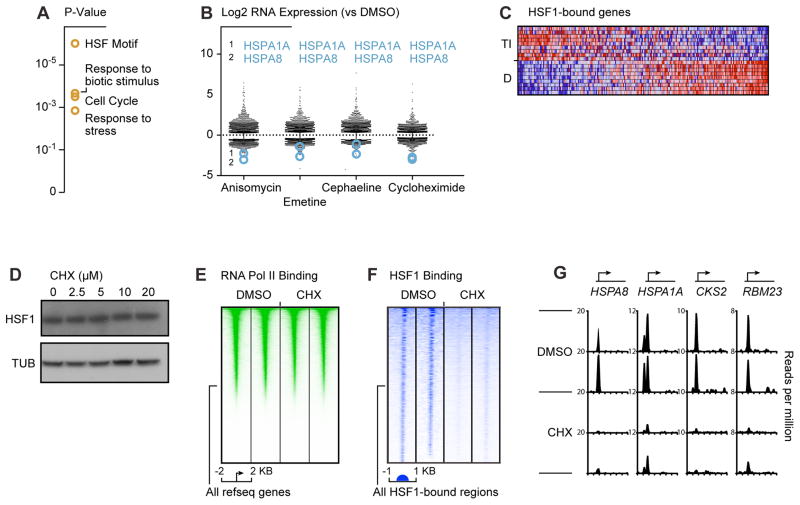
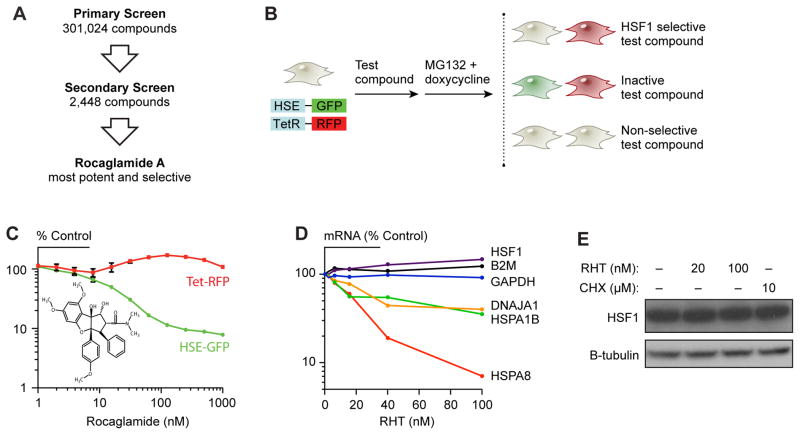
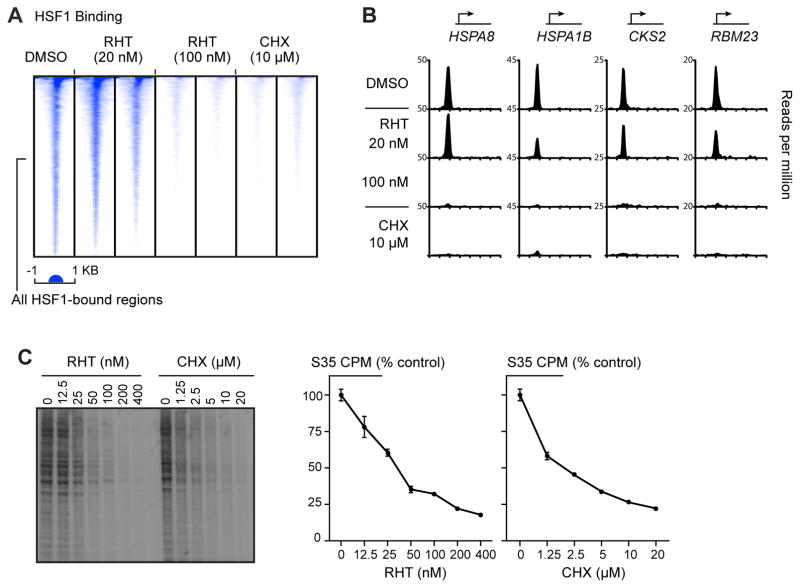
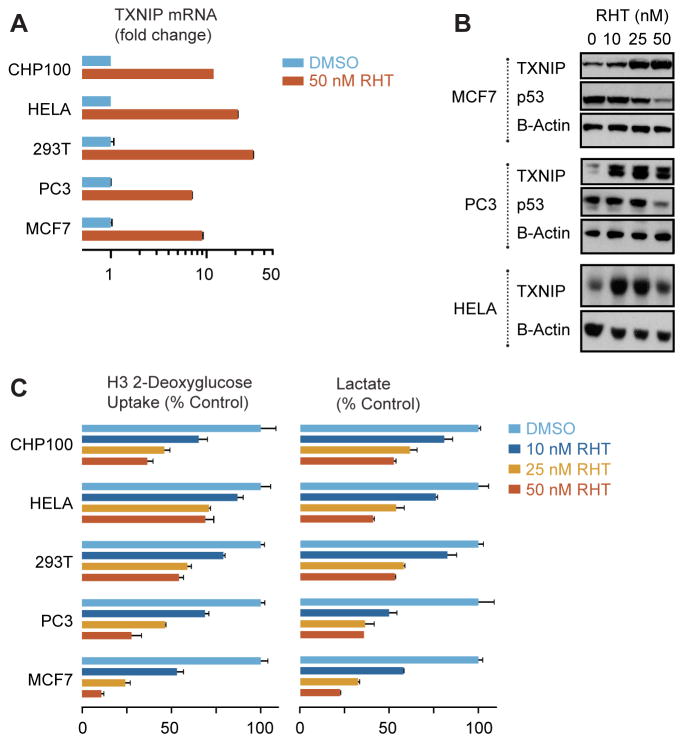
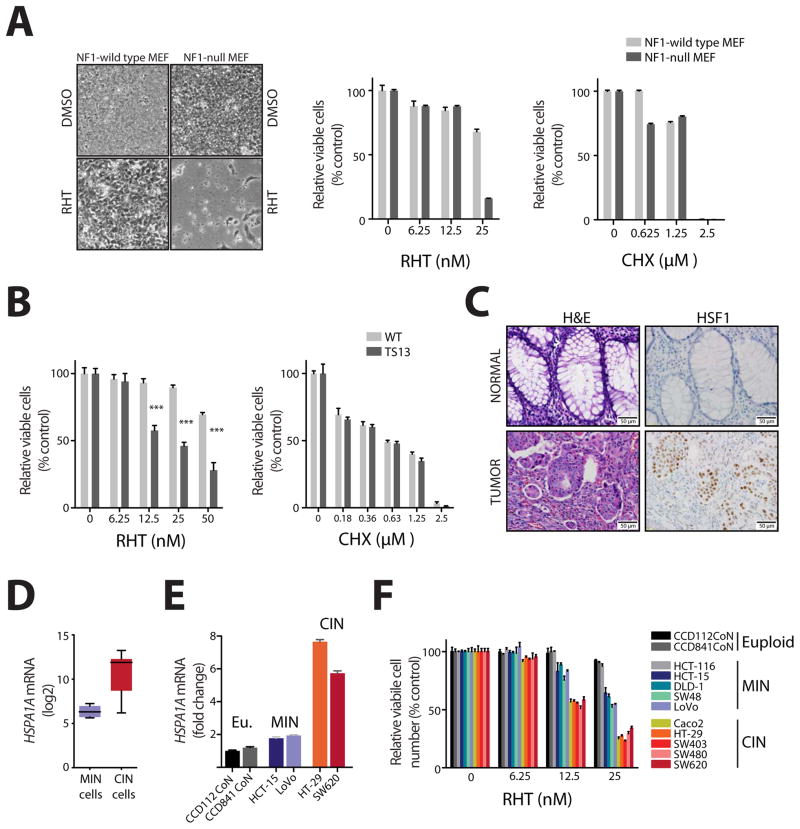
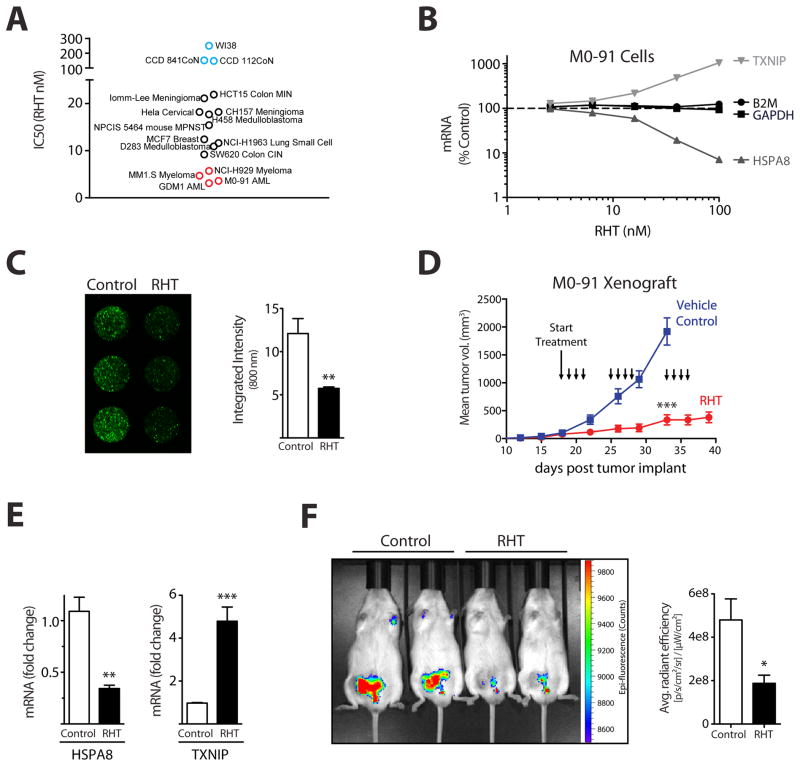
The ribosome is centrally situated to sense metabolic states, but whether its activity, in turn, coherently rewires transcriptional responses is unknown. Here, through integrated chemical-genetic analyses, we found that a dominant transcriptional effect of blocking protein translation in cancer cells was inactivation of heat shock factor 1 (HSF1), a multifaceted transcriptional regulator of the heat-shock response and many other cellular processes essential for anabolic metabolism, cellular proliferation, and tumorigenesis. These analyses linked translational flux to the regulation of HSF1 transcriptional activity and to the modulation of energy metabolism. Targeting this link with translation initiation inhibitors such as rocaglates deprived cancer cells of their energy and chaperone armamentarium and selectively impaired the proliferation of both malignant and premalignant cells with early-stage oncogenic lesions.


Figures

Fig. 1
Fig. 1. Inhibiting protein flux inactivates HSF1
(A) Gene set enrichment analysis was performed by using the MSigDB web service (http://www.broadinstitute.org/gsea/index.jsp) on genes negatively regulated in breast cancer cells following a 6 hr. incubation with inhibitors of protein translation elongation. Complete GSEA results are provided in table S1. (B) Scatter plot of levels of mRNA transcripts (log2) following a 6 hr. incubation with the indicated inhibitors of protein translation elongation. The levels of HSPA1A and HSPA8 levels are indicated for each elongation inhibitor. (C) Translation elongation inhibitors alter the basal transcriptional program in breast cancer cells. Genes bound by HSF1 in MCF7 were ranked by their differential expression between cells treated with translation elongation inhibitors (TI) and control DMSO. Each column represents a gene and is normalized across the column, with high expression in red and low expression in blue. (D). An immunoblot shows the levels of HSF1 protein and the loading control tubulin after a 6 hr. exposure to the indicated concentrations of cycloheximide (CHX). (E) Heat map of RNA polymerase II ChIP-Seq read density in MCF7 cells that were treated with DMSO or 10 μM CHX for 6 hrs. Genomic regions from −2kb to +2kb relative to the transcription start site for all RefSeq genes are shown. (F) Heat map of HSF1 ChIP-Seq read density in MCF7 cells that were treated with DMSO or 10 μM CHX for 6 hrs. Genomic regions from −1kb to +1kb relative to the peak of HSF1 binding for all HSF1 enriched regions (union of all HSF1 enriched regions in the four data sets depicted here) are shown. (G) Representative genes bound by HSF1 in MCF7 cells (HSPA8, HSPA1A, CKS2, and RBM23). x-axis: from 2kb from the transcription start site (TSS) to 5 kb from the TSS for each gene.
Fig. 2
Fig. 2. LINCS analysis reveals that targeting protein translation inactivates HSF1
A. Schematic representation of the LINCS analysis used to identify chemical and genetic modulators that are correlated with HSF1 inactivation. Pink represents genes whose levels increase and green represents genes whose levels decrease following shRNA mediated knockdown of HSF1. B. GSEA results of our HSF1 inactivation signature LINCS analysis. Perturbation signatures were rank-ordered by connectivity with the HSF1 inactivation signature and enrichment was determined for KEGG pathway gene sets and ATC chemical classes (see Materials and Methods for details). Normalized enrichment score (NES) of selected results are plotted (complete GSEA results are provided in table S4). C. Barcode plot of the connectivity score of all of the individual perturbations comprising the indicated enriched chemical or gene sets. The bagel plot in the center of the barcode plot summarizes the positive, negative and null (not connected) fractions for the indicated enriched class. All perturbations that are positively or negatively connected for the indicated enriched classes are shown. Total perturbations in each class are indicated on the right of the plot. Blue represents negatively connected and red represents positively connected classes of enriched perturbations.
Fig. 3
Fig. 3. Chemical screens reveal that targeting translation control inactivates HSF1
(A) Flowchart outlining the steps in the high-throughput MLPCN screen for inhibitors of HSF1 activation. (B) Schematic of dual reporter cell line used to counter-screen primary screen hits. GFP expression is regulated by a heat shock inducible promoter. RFP expression is regulated by a doxycycline response element (TetR). (C) Effect of rocaglamide A on the HSE-driven GFP and doxycycline-driven RFP signals following incubation with 2.5 mM MG132 and 2 μg/ml doxycycline. Chemical structure of rocaglamide A is displayed in the inset. (D) Effect of RHT on HSF1-regulated and control endogenous mRNA transcript levels in M0-91 leukemia cells measured by nanostring nCounter following 6 hr. incubation with indicated concentrations of RHT. Levels of endogenous transcript are shown as percent of DMSO treated control. (E) HSF1 protein levels are not affected in M0-91 leukemia cells treated with RHT. Immunoblot shows the levels of HSF1 protein and the loading control (Tubulin) after a 6 hr. exposure to the indicated concentrations of RHT.
Fig. 4
Fig. 4
(A) Heat map of HSF1 ChIP-Seq read density in M0-91 cells that were treated with DMSO, 20 nM RHT, 100 nM RHT or 10 μM CHX for 6 hrs. Genomic regions from −1kb to +1kb relative to the peak of HSF1 binding for all HSF1 enriched regions (union of all HSF1 enriched regions in the seven data sets depicted here) are shown. (B) Representative HSF1-bound genes in M0-91 cells (HSPA8, HSPA1B, CKS2, and RBM23). x axis: from −2kb from the transcription start site (TSS) to 5 kb from the TSS for each gene. (C) Autoradiograph of S35 labeled protein lysates from MCF7 cells treated for 6 hrs. with the indicated concentrations of RHT or CHX. Graphs show the counts per minute from acetone precipitation of proteins in each sample, quantitated using a scintillation counter.
Fig. 5
Fig. 5. Rocaglates modulate tumor energy metabolism
(A) TXNIP mRNA transcript levels in a panel of cancer cell lines measured by nanostring nCounter following 6 hr. incubation with 50 nM RHT. (B) Immunoblot showing TXNIP levels in the indicated cancer cell lines following a 6 hr. incubation with the indicated concentration of RHT. β-actin is the loading control. The effect on p53, a short half-life protein, is shown. (C) Effects of the indicated amount of RHT on [H3]-2-deoxyglucose uptake (left panel) and lactate production (right panel) in a panel of cancer cell lines.
Fig. 6
Fig. 6. Rocaglates selectively target aneuploid cancer cells and non-transformed cells with cancer-associated genetic aberrations
(A) Photomicrographs of Nf1 wild type and Nf1 null MEFs that were treated for 14 days with 25 nM RHT. The relative viable cell number of RHT-treated (middle panel) and CHX-treated (right panel) are shown. (B) Effect of either RHT (left panel) or cycloheximide (right panel) on the proliferation of MEFs (TS-13) carrying a single extra copy of 120 Mbp of chromosome 13 compared to MEFs derived from littermate controls (WT), (mean ± S.D., n=3, ***p<0.001, two-way ANOVA). (C) Photomicrographs of normal colon epithelial cells and invasive colon adenocarcinoma (H&E stains and HSF1 immunohistochemistry) from the same section of a human tumor resection (immunostained simultaneously). HSF1 expressing cells stain brown and HSF1 negative cells stain blue from the toluidine blue counterstain. Scale bar: 50 μm. (D) HSPA1A mRNA transcript levels are elevated in colorectal adenocarcinomas with high-grade aneuploid karyotypes. Data from three MIN and nine CIN colon cancer cell lines from the GSK Cancer Cell Line Genomic Profiling Data as described in the methods. (E) RT-PCR analysis of HSPA1A mRNA levels in the indicated euploid, MIN and CIN cancer cell lines. (F) Effect of RHT on the proliferation of a panel of cell lines with high-grade aneuploid karyotypes (CIN lines: Caco2, HT29, SW403, SW480, and SW620), near-euploid karyotypes with microsatellite instability (MIN lines: HCT-116, HCT-15, DLD-1, SW48, and LoVo) or non-transformed colon epithelial cell lines with a euploid chromosomal number (CCD112CoN and CCD841CoN), (mean ± S.D., n=3, ***p<0.001, two-way ANOVA).
Fig. 7
Fig. 7. Rocaglates suppress tumor growth, HSPA8 mRNA levels and glucose uptake in vivo
(A) Scatter plot of IC50 values of the growth of a diverse panel of cell lines treated with RHT. Cells were treated for 5 days. Red indicates hematopoietic cancer lines and blue indicates euploid non-transformed cells. (B) mRNA levels of HSPA8, TXNIP, and control housekeeping genes in M0-91 cells treated with RHT. (C) Glucose uptake of of IR Dye 800CW 2-deoyglucose (2-DG) in M0-91 cell lines treated with RHT. Imaging was performed using LICOR. Right panel: quantitation of measured intensity (mean ± SEM, p < .005, two-tailed t-test). (D) Plot of the tumor volume of M0-91 acute myeloid leukemia xenografts treated with vehicle or RHT. The mean tumor volume (mm3) is plotted over time. Mice were treated with subcutaneous injections starting on day 18 post-implantation (either vehicle alone or RHT (1mg/kg), on days marked by downward pointing arrows). Eight mice were in each treatment group (mean ± SE, p < 0.0001). (E) RT-PCR analysis of HSPA8 and TXNIP mRNA levels from tumor xenografts following a single treatment of either vehicle or RHT (1 mg/kg, S.C.; 5 mice in each group). Tumors were harvested 6 hrs. post-treatment (mean ± SEM, HSPA8: p < .005, TXNIP: p < .0005, two-tailed t-test). (F) Representative image of epifluorescence of IRDye 800CW 2-deoxyglucose (2-DG) uptake in M0-91 xenografts. Mice bearing tumors were treated with vehicle or RHT (1 mg/kg) as described in the Materials and Methods; 4 mice in each group. Images were acquired 36 hrs. following the last treatment. Right panel: quantitation of measured radiant efficiency from epifluorescence of IRDye 800CW 2-DG from images of M0-91 xenografts (mean ± SEM, p=0.031, two-tailed t-test).

Comment in

  • Cell biology. Trans-HSF1 express.
    Gandin V, Topisirovic I. Gandin V, et al. Science. 2013 Jul 19;341(6143):242-3. doi: 10.1126/science.1242359. Science. 2013. PMID: 23869008 No abstract available.
  • HSF1 in Translation.
    de Billy E, Clarke PA, Workman P. de Billy E, et al. Cancer Cell. 2013 Aug 12;24(2):147-9. doi: 10.1016/j.ccr.2013.07.017. Cancer Cell. 2013. PMID: 23948296

References

    1. Ruggero D, Pandolfi PP. Nat Rev Cancer. 2003 Mar;3:179. - PubMed
    1. Chan JC, et al. Sci Signal. 2011 Aug 30;4:ra56. - PubMed
    1. White RJ. Nat Rev Mol Cell Biol. 2005 Jan;6:69. - PubMed
    1. Hannan KM, et al. Mol Cell Biol. 2003 Dec;23:8862. - PMC - PubMed
    1. Silvera D, Formenti SC, Schneider RJ. Nat Rev Cancer. 2010 Apr;10:254. - PubMed

Publication types

MeSH terms

Associated data