. 2014 Mar 4;15(3):R49.
doi: 10.1186/gb-2014-15-3-r49.

Whole-genome analysis of 5-hydroxymethylcytosine and 5-methylcytosine at base resolution in the human brain

Whole-genome analysis of 5-hydroxymethylcytosine and 5-methylcytosine at base resolution in the human brain

Lu Wen et al. Genome Biol. .

Abstract

Background: 5-methylcytosine (mC) can be oxidized by the tet methylcytosine dioxygenase (Tet) family of enzymes to 5-hydroxymethylcytosine (hmC), which is an intermediate of mC demethylation and may also be a stable epigenetic modification that influences chromatin structure. hmC is particularly abundant in mammalian brains but its function is currently unknown. A high-resolution hydroxymethylome map is required to fully understand the function of hmC in the human brain.

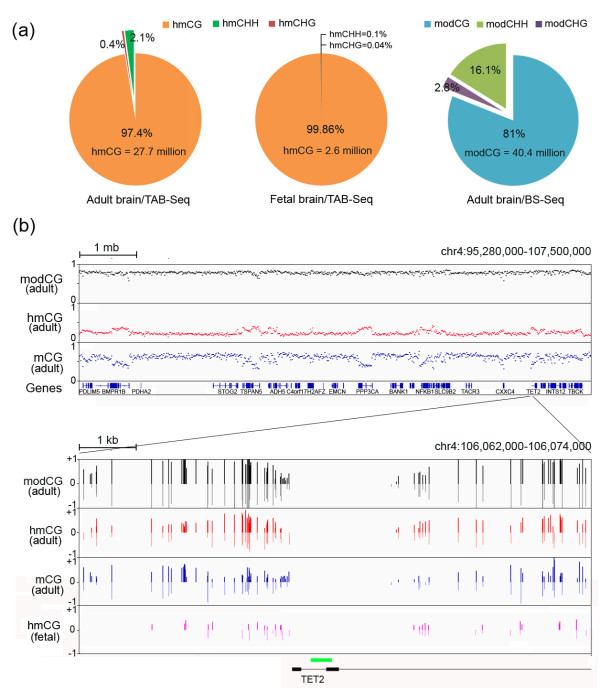
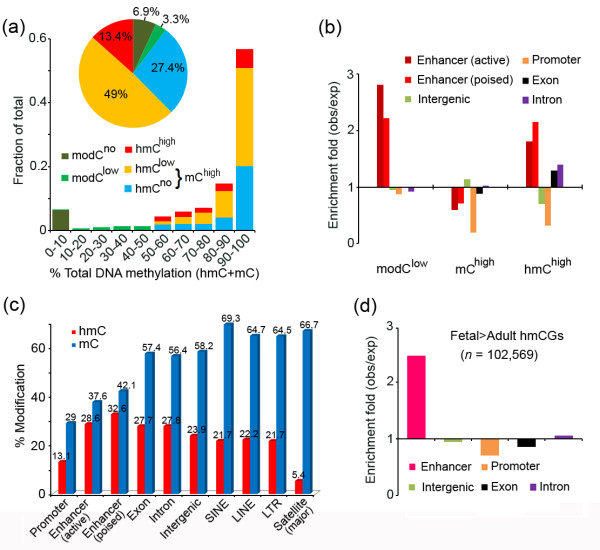
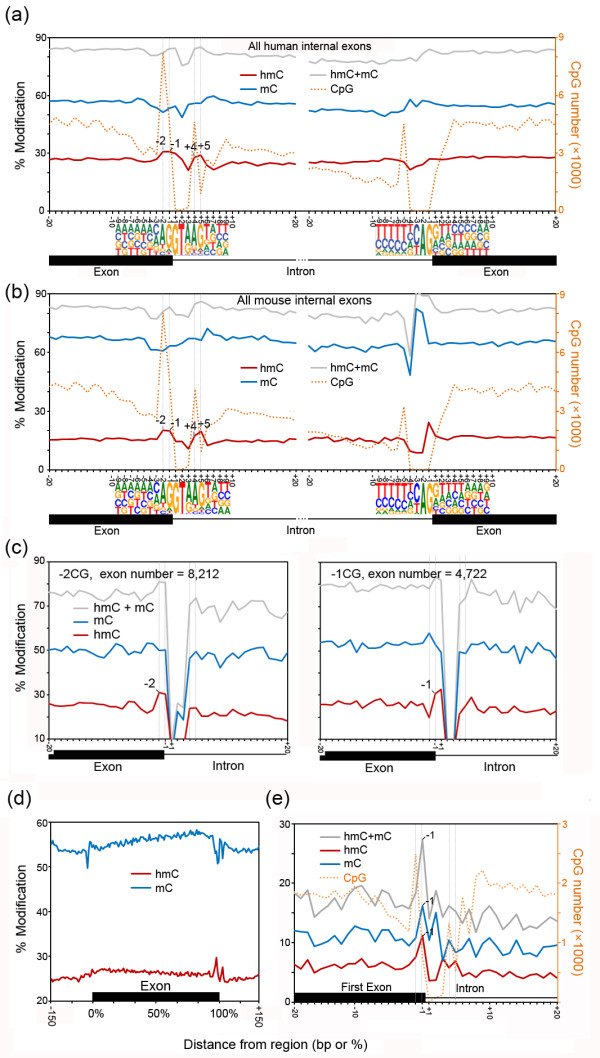
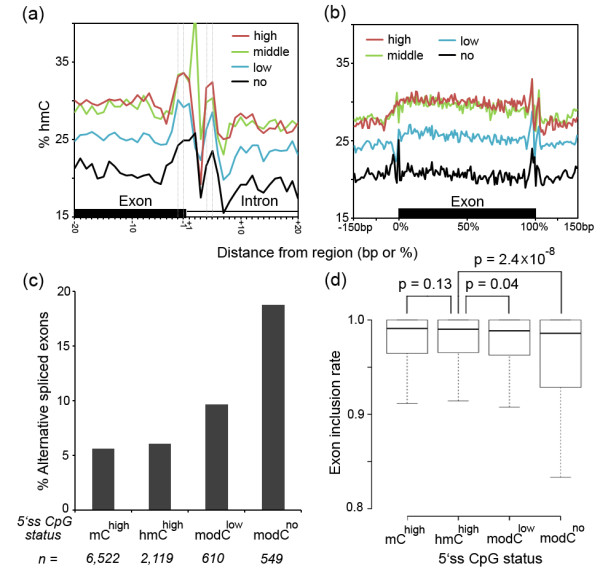
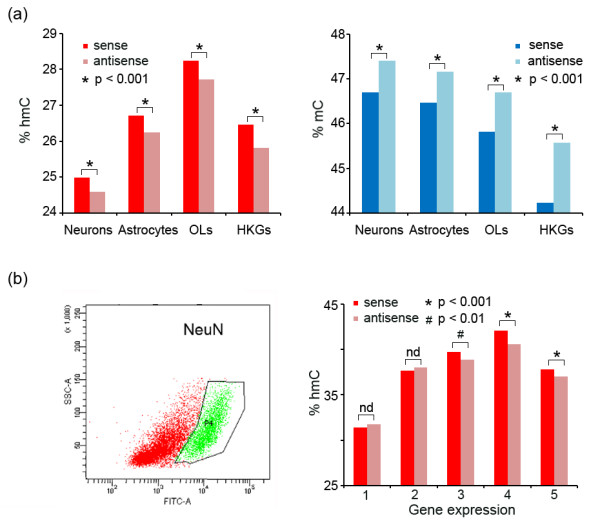
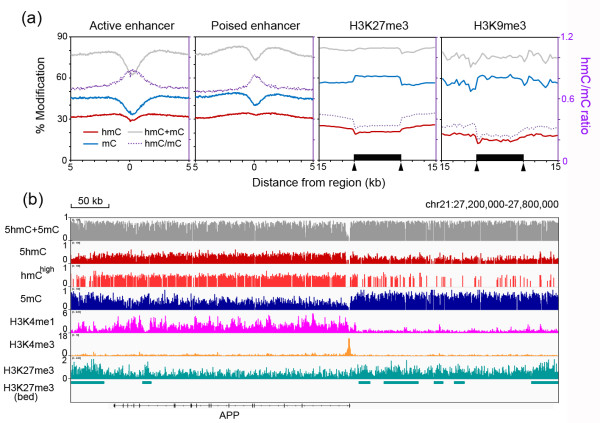
Results: We present genome-wide and single-base resolution maps of hmC and mC in the human brain by combined application of Tet-assisted bisulfite sequencing and bisulfite sequencing. We demonstrate that hmCs increase markedly from the fetal to the adult stage, and in the adult brain, 13% of all CpGs are highly hydroxymethylated with strong enrichment at genic regions and distal regulatory elements. Notably, hmC peaks are identified at the 5'splicing sites at the exon-intron boundary, suggesting a mechanistic link between hmC and splicing. We report a surprising transcription-correlated hmC bias toward the sense strand and an mC bias toward the antisense strand of gene bodies. Furthermore, hmC is negatively correlated with H3K27me3-marked and H3K9me3-marked repressive genomic regions, and is more enriched at poised enhancers than active enhancers.

Conclusions: We provide single-base resolution hmC and mC maps in the human brain and our data imply novel roles of hmC in regulating splicing and gene expression. Hydroxymethylation is the main modification status for a large portion of CpGs situated at poised enhancers and actively transcribed regions, suggesting its roles in epigenetic tuning at these regions.


Figures

Figure 1
Figure 1
Base-resolution hydroxymethylome and methylome in the human brain. (a) The percentages of hmCs or modCs in the adult or the fetal brain in the contexts of CG, CHH, and CHG. (b) Examples of the hmC, mC, and total modification (hmC + mC) profiles are shown for a genomic region of 12 mb on chromosome 4 as a scatterplot (Upper panel) and for a 12 kb region surrounding the TSS of the TET2 gene as a bar chart. The green box indicates the CpG island located in the TET2 promoter.
Figure 2
Figure 2
Features of hydroxymethylome in the human brain. (a) Classification of all CpGs in the adult brain according to their hydroxymethylation and methylation frequencies. (b) Fold enrichment of the CpG categories on different genomic elements. hmChigh is enriched in enhancers, exons and introns. (c) The absolute hmC and mC levels at different genomic elements in the adult brain. (d) Fold enrichment of the Fetal > Adult hmCGs, which exhibited higher hmC levels in the fetal brain than in the adult brain, on different genomic elements.
Figure 3
Figure 3
Prominent hmC changes mark the exon-intron boundary. (a, b) Profiles of hmC and mC for a 40-bp window around the exon-intron and intron-exon boundaries at single-nucleotide resolution in human (a) and mouse (b). Modification levels of hmC, mC, total DNA methylation (hmC + hmC), and the CpG number are shown for all internal exons in the sense strand. The sequences ± 9 bp around the 5′ and 3′ splicing sites are also indicated. The TAB-Seq and BS-Seq data to generate the mouse profile (b) were obtained from Lister et al.[25]. (c) Profiles of hmC and mC at the exon-intron boundary of exons which have a CpG at 5′ss position -2 (-2CG, n = 8,212) or -1 (-1CG, n = 4,277). Since a CpG at one position will lead to absence of CpG at the nearest neighboring position and thus no methylation value, we merged the data of the sense and the antisense strands for each type of exons. (d) Profiles of hmC and mC across exons. All internal exons were divided into 100 bins, and average hmC and mC levels were calculated for each bin, as well as ±150 bp surrounding the exon. (e) The hmC and mC profiles at the exon-intron boundary of the first exon.
Figure 4
Figure 4
Correlation of the hmC and mC changes at the exon-intron boundary with gene expression and splicing. (a, b) The hmC changes at the exon-intron boundary (a) and across the exon (b) are similar for exons expressed at high (red), middle (green), or low (blue) levels, as well as exons with no expression (black). (c, d) The percentages of alternatively spliced exons (c) and the inclusion rates (d) of the exons with the status of the 5′ss CpG site being mChigh, hmChigh, modClow, or modCno showing differential splicing of these exon types. Two-tailed MWW test. n, number of exons.
Figure 5
Figure 5
Strand-biased hmC and mC profiles on the gene body. (a) Profiles of hmC (left panel) and mC (right panel) on the sense (lined) and antisense (dotted) strands of the genes expressed at high (red), middle (green) and low (blue) expression levels, as well as the genes with no expression (black). TSS and TTS indicate the transcription starting site and the transcription terminal site, respectively. (b) Expressed genes were divided into 10 groups according to the expression levels (left panel), and the average levels of hmC (middle panel) and mC (right panel) for each strand of the gene body were measured. The values for the genes that are not expressed (expression level 0) and randomly selected intergenic regions as the control (C) are also shown. One-tailed paired Student’s t test. nd, no statistical difference (P >0.05). (c) Profiles of hmC on the sense (lined) and antisense (dotted) strands of exons with high (red) or no (black) expression. (d) The hmC and mC strand-biases are reduced at the sense-antisense gene (SAS) paired regions in comparison with the non-SAS regions. (e) The hmC profile on the sense (lined) and antisense (dotted) strands of the genes that are expressed (red) or not expressed (black) in the mouse brain exhibits the transcription-correlated hmC bias toward the sense strand similar to the human pattern. The TAB-Seq, BS-Seq, and RNA-Seq data for analysis were obtained from Lister et al.[25].
Figure 6
Figure 6
Strand-biased hmC and mC profiles in both neurons and glia. (a) The average levels of hmC (left panel) and mC (right panel) for each strand of genes enriched in different brain cell types including neurons, astrocytes and oligodendrocytes (OLs), as well as the house-keeping genes (HKGs). (b) Tet-assisted reduced representation bisulfite sequencing performed in neuron nuclei isolated by FACS using the NeuN antibody (left panel) revealed that hmC is significantly enriched on the sense strands of the neuronal genes expressed at high (3, 4, 5), but not low (1, 2) expression levels (right panel). One-tailed paired Student’s t test. nd, no statistical difference (P >0.05).
Figure 7
Figure 7
hmC/mC profiles on enhancers and repressive genomic regions. (a) The hmC, mC, and total DNA methylation levels, and the hmC/mC ratios were displayed surrounding the midpoints of active or poised enhancers, or across H3K27me3- and H3K9me3-enriched regions. Arrows indicate the starting and ending points of the H3K27me3- and H3K9me3-marked regions. (b) An example of a 600-kb genomic region surrounding the APP gene showing enrichment of hmC and H3K4me1 within the genic region and enrichment of mC and H3K27me3 in the neighboring intergenic regions. ChIP-Seq data for H3K4me1, H3K4me3, and H3K27me3 were obtained from Zhu et al.[26].

References

    1. Tahiliani M, Koh KP, Shen Y, Pastor WA, Bandukwala H, Brudno Y, Agarwal S, Iyer LM, Liu DR, Aravind L, Rao A. Conversion of 5-methylcytosine to 5-hydroxymethylcytosine in mammalian DNA by MLL partner TET1. Science. 2009;324:930–935. doi: 10.1126/science.1170116. - DOI - PMC - PubMed
    1. Kriaucionis S, Heintz N. The nuclear DNA base 5-hydroxymethylcytosine is present in Purkinje neurons and the brain. Science. 2009;324:929–930. doi: 10.1126/science.1169786. - DOI - PMC - PubMed
    1. He YF, Li BZ, Li Z, Liu P, Wang Y, Tang Q, Ding J, Jia Y, Chen Z, Li L, Sun Y, Li X, Dai Q, Song CX, Zhang K, He C, Xu GL. Tet-mediated formation of 5-carboxylcytosine and its excision by TDG in mammalian DNA. Science. 2011;333:1303–1307. doi: 10.1126/science.1210944. - DOI - PMC - PubMed
    1. Ito S, Shen L, Dai Q, Wu SC, Collins LB, Swenberg JA, He C, Zhang Y. Tet proteins can convert 5-methylcytosine to 5-formylcytosine and 5-carboxylcytosine. Science. 2011;333:1300–1303. doi: 10.1126/science.1210597. - DOI - PMC - PubMed
    1. Wu H, D’Alessio AC, Ito S, Wang Z, Cui K, Zhao K, Sun YE, Zhang Y. Genome-wide analysis of 5-hydroxymethylcytosine distribution reveals its dual function in transcriptional regulation in mouse embryonic stem cells. Genes Dev. 2011;25:679–684. doi: 10.1101/gad.2036011. - DOI - PMC - PubMed

Publication types

Associated data