. 2013 Dec;23(12):2126-35.
doi: 10.1101/gr.161679.113. Epub 2013 Oct 31.

Single-cell methylome landscapes of mouse embryonic stem cells and early embryos analyzed using reduced representation bisulfite sequencing

Affiliations

Single-cell methylome landscapes of mouse embryonic stem cells and early embryos analyzed using reduced representation bisulfite sequencing

Hongshan Guo et al. Genome Res. 2013 Dec.

Abstract

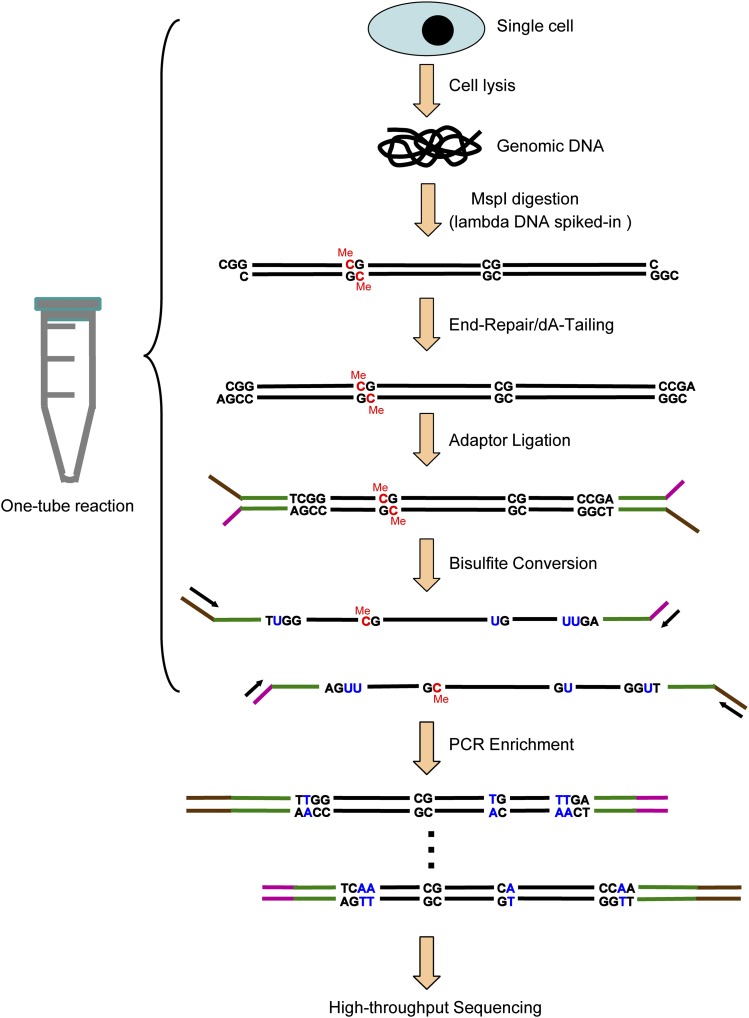
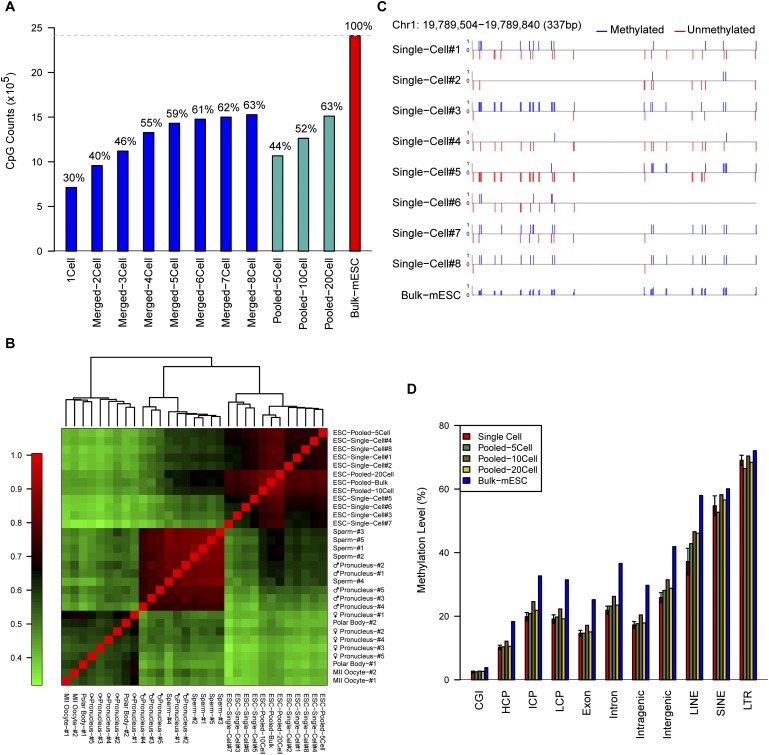
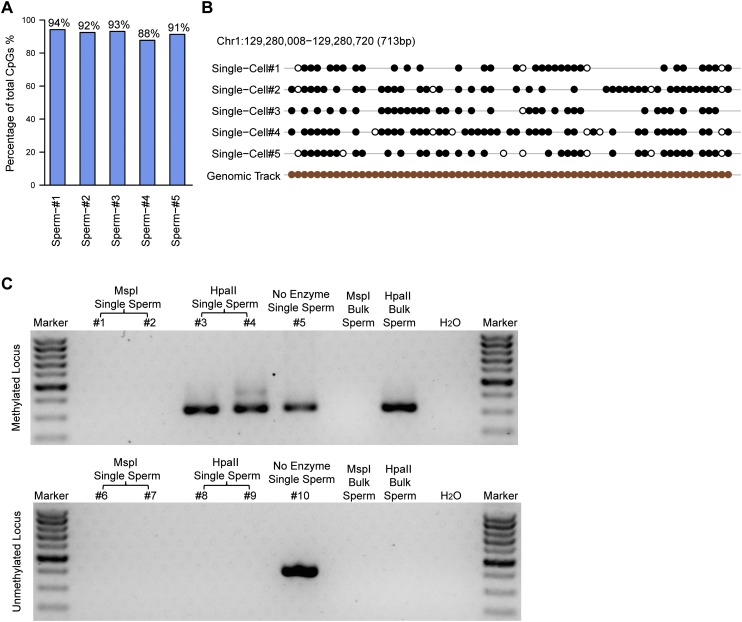
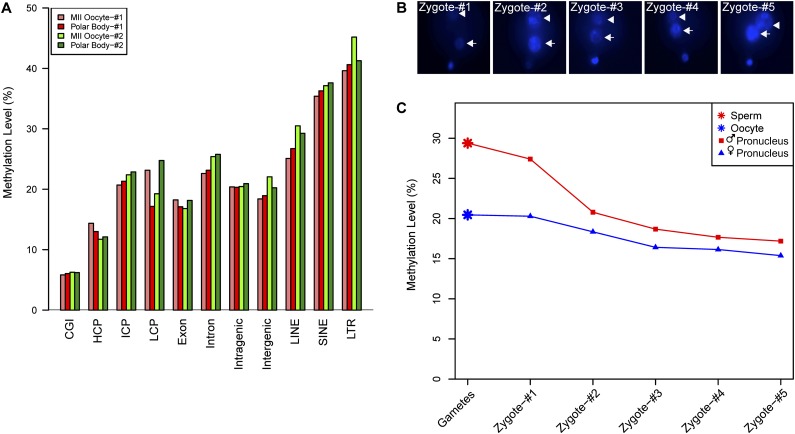
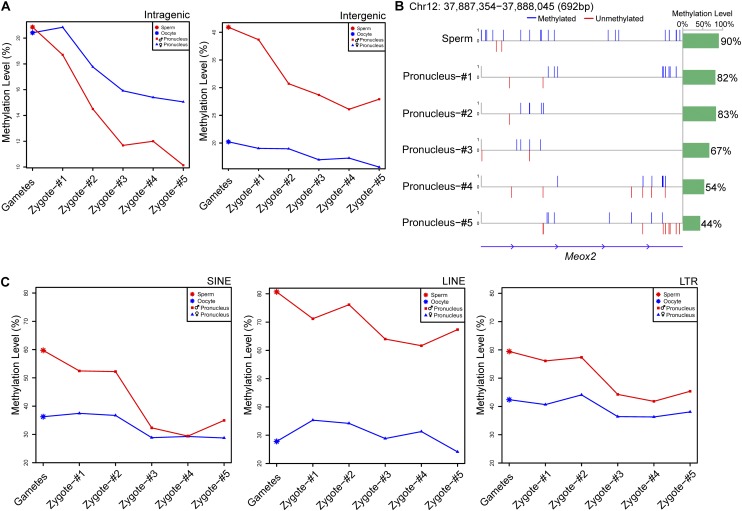
DNA methylation is crucial for a wide variety of biological processes, yet no technique suitable for the methylome analysis of DNA methylation at single-cell resolution is available. Here, we describe a methylome analysis technique that enables single-cell and single-base resolution DNA methylation analysis based on reduced representation bisulfite sequencing (scRRBS). The technique is highly sensitive and can detect the methylation status of up to 1.5 million CpG sites within the genome of an individual mouse embryonic stem cell (mESC). Moreover, we show that the technique can detect the methylation status of individual CpG sites in a haploid sperm cell in a digitized manner as either unmethylated or fully methylated. Furthermore, we show that the demethylation dynamics of maternal and paternal genomes after fertilization can be traced within the individual pronuclei of mouse zygotes. The demethylation process of the genic regions is faster than that of the intergenic regions in both male and female pronuclei. Our method paves the way for the exploration of the dynamic methylome landscapes of individual cells at single-base resolution during physiological processes such as embryonic development, or during pathological processes such as tumorigenesis.


Figures

Figure 1.
Figure 1.
A schematic of the single-cell RRBS (scRRBS) technique. Note the completion of all of the following steps within the same reaction tube: lysis of an individual cell, release of the naked double-stranded genomic DNA, spiking with lambda DNA, digestion of the genomic DNA using a restriction enzyme, end-repair and dA-tailing of the DNA fragments, ligation of the adaptors to the DNA fragments, and bisulfite conversion of the ligated DNA.
Figure 2.
Figure 2.
The sensitivity and reproducibility of the single-cell RRBS technique. (A) The number and proportion of CpG sites detected in the merged single mESC RRBS data set overlapped with those from the RRBS of the bulk mESCs. (B) Pearson correlation heatmap among the methylomes of all RRBS samples of single cells, pooled cells, or bulk cells. The color key from green to red indicates low to high correlation, respectively. (C) DNA methylation map of the CpG sites at a representative locus in the RRBS data from eight single cells and bulk mESCs. The upward blue bars and downward red bars indicate methylated CpGs and unmethylated CpGs, respectively. (D) The methylation levels of different genomic regions of single mESCs; pooled mESCs of five cells, 10 cells, and 20 cells; and bulk mESCs.
Figure 3.
Figure 3.
The methylation status of single sperm cells. (A) The proportion of fully methylated (≥90% methylated with read depths greater than or equal to three) and unmethylated (≤10% methylated with read depths greater than or equal to three) CpG sites within the total CpG sites covered in the scRRBS of an individual sperm cell. (B) The methylation status of a representative locus on chromosome 1 showing that most of the detected CpG sites were either methylated or unmethylated. Filled black circles represent methylated CpG sites, whereas open circles represent unmethylated CpG sites. Gaps in the methylation profiles represent CpG sites that were not recovered in the single-cell RRBS data. The filled brown circles represent all of the CpG sites in the corresponding region of the genome. (C) Agarose gel analysis of the methylation-sensitive restriction digestion coupled with nested PCR in single sperm cells. (Top) A methylated locus. (Bottom) An unmethylated locus. The first five lanes (excluding the marker lane) indicate five individual single sperm cells digested with MspI, MspI, HpaII, HpaII, and no enzyme, respectively. The next two lanes indicate 1 ng of bulk sperm genomic DNA treated with MspI or HpaII, respectively, as positive controls. A weaker band (468 bp) at the upward side of the strong band (320 bp) in the fourth lane (excluding the marker lane) of the top panel is the amplification product of the first-round PCR.
Figure 4.
Figure 4.
Global demethylation in male and female pronuclei during pronucleus stages within individual zygotes. (A) The DNA methylation levels of different genomic regions of metaphase II oocytes and the first polar bodies within the same gametes. (B) Hoechst 33342 staining of pronuclei in the zygotes, indicating the distance between each pair of male and female pronuclei in individual zygotes. From zygote 1 to zygote 5, the distance between the male and female pronuclei gradually decreases. (C) Global methylation levels in male and female pronuclei within the same zygotes. Note that the methylation levels decrease significantly in both male (red line) and female (blue line) pronuclei.
Figure 5.
Figure 5.
The demethylation patterns in various genomic regions in male and female pronuclei during zygotic development. (A) DNA methylation dynamics of male and female pronuclei in intragenic and intergenic regions. The methylation levels in the male (red line) and female (blue line) pronuclei decreased, whereas the demethylation in the male pronuclei was more dramatic than that in the female pronuclei. (B) The methylation profile of a representative Meox2 locus on chromosome 12 in the male pronuclei. The upward blue bars in the left panel represent fully methylated CpG sites, whereas the downward red bars represent unmethylated CpG sites. The green bar in the panel on the right shows the average methylation levels of the CpG sites in this region. (C) DNA methylation dynamics of male and female pronuclei in repeat regions. The left, middle, and right panels display the methylation levels of male and female pronuclei in the SINE, LINE, and LTR regions, respectively. Red and blue lines indicate male and female pronuclei, respectively.

References

    1. Bao S, Tang F, Li X, Hayashi K, Gillich A, Lao K, Surani MA 2009. Epigenetic reversion of post-implantation epiblast to pluripotent embryonic stem cells. Nature 461: 1292–1295 - PMC - PubMed
    1. Bird A 2002. DNA methylation patterns and epigenetic memory. Genes Dev 16: 6–21 - PubMed
    1. Bock C 2012. Analysing and interpreting DNA methylation data. Nat Rev Genet 13: 705–719 - PubMed
    1. Booth MJ, Branco MR, Ficz G, Oxley D, Krueger F, Reik W, Balasubramanian S 2012. Quantitative sequencing of 5-methylcytosine and 5-hydroxymethylcytosine at single-base resolution. Science 336: 934–937 - PubMed
    1. Chan MM, Smith ZD, Egli D, Regev A, Meissner A 2012. Mouse ooplasm confers context-specific reprogramming capacity. Nat Genet 44: 978–980 - PMC - PubMed

Publication types

MeSH terms

Associated data