. 2013 Aug 1;13(2):205-18.
doi: 10.1016/j.stem.2013.05.024. Epub 2013 Jun 13.

Induction of a hemogenic program in mouse fibroblasts

Affiliations

Induction of a hemogenic program in mouse fibroblasts

Carlos-Filipe Pereira et al. Cell Stem Cell. .

Abstract

Definitive hematopoiesis emerges during embryogenesis via an endothelial-to-hematopoietic transition. We attempted to induce this process in mouse fibroblasts by screening a panel of factors for hemogenic activity. We identified a combination of four transcription factors, Gata2, Gfi1b, cFos, and Etv6, that efficiently induces endothelial-like precursor cells, with the subsequent appearance of hematopoietic cells. The precursor cells express a human CD34 reporter, Sca1, and Prominin1 within a global endothelial transcription program. Emergent hematopoietic cells possess nascent hematopoietic stem cell gene-expression profiles and cell-surface phenotypes. After transgene silencing and reaggregation culture, the specified cells generate hematopoietic colonies in vitro. Thus, we show that a simple combination of transcription factors is sufficient to induce a complex, dynamic, and multistep developmental program in vitro. These findings provide insights into the specification of definitive hemogenesis and a platform for future development of patient-specific stem and progenitor cells, as well as more-differentiated blood products.


Figures

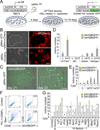
Figure 1
Figure 1. Screening for hematopoietic fate-inducing factors
(A) Strategy to test hematopoiesis-inducing factors. Mouse MEFs were isolated from 34/H2BGFP double transgenic mice and transduced with pools of candidate TFs (pMXs-TFs). 4 days after transduction MEFs were re-plated onto AFT024 stroma with or without cytokines (SCF, Flt3l, IL-3 and IL-6), co-cultured for 14–19 days and screened for GFP by immunofluorescence and flow cytometry. (B) MEFs transduced with pMXs-mCherry or the 18 TF cocktail plus mCherry were analyzed at day 21. The emergence of colonies was observed only in the 18 TF pool + mCherry (upper) and not in the mCherry control (lower). mCherry (red) shows the MEF origin of colonies and bright field shows morphologies. (C) A single colony was assayed for 34/H2BGFP activation (green) 21 and 23 days after transduction with 18 TFs. Dashed lines highlight morphological changes. Scale bars = 100 µm. (D) MEFs were transduced with 18 TF or empty vector control (C) and transferred to AFT024, methylcellulose-containing media (MC), gelatin or matrigel-coated dishes with cytokines. GFP+ and GFP- colonies were counted by immunofluoresence and bright field microscopy at 21 days. (E) MEFs were transduced with retroviral pools expressing 18 TFs, 14 TFs, or empty vector control (C) and cultured with (+) and without (−) cytokines on AFT024 stroma. (F) 34/H2BGFP MEFs were transduced with PU.1 + CEBPα. FACS plots show the expression of CD45, Mac1 and no activation of 34/H2BGFP at day 8. (G) GFP+ and GFP- colonies after removal of individual factors from the 14 TF pool. Factors whose removal decreased colony numbers were selected (asterisks). Colony numbers are per 10,000 infected MEFs (mean ± SEM). See also Figure S1.
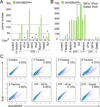
Figure 2
Figure 2. Combination of Gata2, Gfi1b, cFos and Etv6 induces efficient activation of 34/H2BGFP
(A-B) GFP+ colony numbers were counted after removal of individual TFs from the pool of 7 TFs, (Gfi1b/cFos/Gata2/Etv6/Scl/Bmi1/Runx1) (A), 5 TFs (Gfi1b/cFos/Gata2/Etv6/Scl) and 3 TFs (Gfi1b/cFos/Gata2) (B). Fluorescent colonies were counted 22 days after transduction with (+) or without (−) cytokines. TFs whose removal decreased colony number were selected (asterisks). 4 TFs (Gfi1b/cFos/Gata2/Etv6) yielded the optimal efficiency of activation (4–7%). Colony numbers per 10,000 infected MEFs are shown (mean ± SEM). (C) MEFs were analysed by flow cytometry 22 days after transduction with pools of 7, 5, 4, 3 (Gfi1b/cFos/Gata2) or 2 TFs (3F – TF). The percentages of GFP+ cells are shown (Auto, autofluorescence). See also Figure S2.
Figure 3
Figure 3. Induced 34/H2BGFP+ cells express endothelial and hematopoietic markers similarly to HSCs
(A) 34/H2BGFP MEFs were transduced with pools of 7, 5, 4 or 3 factors TFs (as indicated by dots in the upper panel) and co-cultured with AFT024 stroma with (+) or without (−) cytokines (Cyto). At day 0 (MEFs), day 4, day 20 and day 40 after transduction groups of 100 GFP+ cells were sorted and assayed for expression. MEFs transduced with pMXs-mCherry were included as controls. Levels of mRNA expression were compared to purified HSC populations isolated from BM of 34/H2BGFP mice (from left to right: LSKCD48-, LSKCD48-Flk2+, LSKCD48-Flk2-CD34+, LSKCD48-Flk2-CD34-, LSKCD48-Flk2-CD34-CD150+). Red indicates increased expression and green, decreased expression over the mean. Shading highlights the similarity between day 40 samples and bone marrow HSCs. Data were normalized to Hprt expression, analyzed by Cluster 3.0 and displayed by Treeview. (B) Relative mRNA expression leves of fibroblast-associated genes (Acta2; highlighted in black) and markers with expression initiated at day 20 (Prom1 Ly6a Kitl Csf1r CD34 Il3ra; highlighted in blue). Expression of hematopoietic (Csf3r CD43 cKit Mpl, CD45, CD41), endothelial (Vwf Id1, Nos3) and emerging HSC markers (Sox17 CD93/AA4.1) (red). Expression of Runx1 Bmi1 Scl Etv6 Gfi1b, cFos total mRNAs (transgene + endogenous) and endogenous Gata2 (endo) (brown). Transductions from 7 to 3 TFs are ordered from left to right. Expression levels are relative to Hprt.
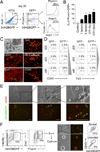
Figure 4
Figure 4. Induced hemogenic colonies emerging from a precursor cell-type
(A) MEFs were transduced with 4TFs (Gata2, Gfi1b, cFos and Etv6) and cultured on AFT024 stroma with cytokines. At day 20, GFP+ cells were analyzed for expression of Prom1 and Sca1 (Auto, autofluorescence). (B) Quantification of Prom1+GFP+ cell percentage after transduction with 7, 5, or 4 TFs. The highest percentage was achieved by transduction with Gfi1b, cFos, Gata2 and Etv6 (3F + Etv6, mean ± SEM). (C) MEFs were transduced with 7 TFs, cultured on AFT024 stroma without cytokines and analyzed at day 35 by immunofluorescence. The emergence of non-adherent cells is shown. The insert shows a higher magnification to highlight round, non-adherent cells. Shown in red is live staining for Tie2, CD31, VE-cadherin, Sca1 and CD45 as indicated and GFP expression is shown in green. (D) MEFs were transduced with 4 TFs, cultured on gelatin and analysed sequentially at days 25, 35 and 45. The percentages of CD45+ and Tie2+ cells are shown in gated GFP+ and GFP- populations. A representative experiment of three is shown. (E) MEFs were transduced with 4 TFs, plated on gelatin without cytokines and analysed at 40 days by immunofluorescence. GFP (green), CD45 staining (red) and brightfield shows morphology. The following cellular components are highlighted with arrows: a) small non-adherent or semi-adherent GFP+CD45+ cells, b) larger adherent GFP+CD45-cells and c) very large adherent GFP+CD45- cells. (F) GFP+Sca1+Prom1+ cells were isolated at day 20 after transduction with 4 TFs and re-plated on gelatin (left). After 6 days cultured cells were analysed by immunofluorescence and flow cytometry (right). CD45+ (red) and GFP+ (green) cells emerge in the cultures. Cell boundaries (dashed line) and nucleus (arrowhead) of bigger CD45- cells are highlighted. The insert shows a higher magnification to highlight GFP+CD45+ cells. Scale bars = 100 µm. Flow plots (far right panels) show the enrichment of CD45+ emerging in cultures of sorted versus unsorted populations. See also Figure S3.
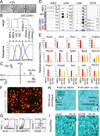
Figure 5
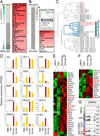
Figure 5. An endothelial-like gene expression program precedes hematopoietic specification
MEFs were transduced with 4 TFs and plated on gelatin without cytokines. Global gene expression levels in non-transduced MEFs, day 20 GFP+Sca1+Prom1+, and day 35 GFP+CD45+cKit+ and GFP+CD45+cKit- were profiled by mRNA-seq (biological replicates: 1 and 2). (A) Pictures show morphology of profiled populations. Scale bar = 100 µm. (B) Ordered tree linkage displays clustering of the profiled samples and the metagenes that represent most of the variability associated with each cell transition. (C) Principal component analysis shows the relative distances between samples and a hypothetical temporal trajectory. (D) Reads were aligned to the mouse genome and those that mapped to the Acta2, Ly6a, Ly6e and CD45 genes are displayed as maximum read heights. (E) The expression levels of fibroblast-specific genes in MEFs (red bars, upper panel) and genes overrepresented at day 20 (red bars, lower 2 panels) are shown as FPKM mean values ± SEM. (F) MEFs were transduced with 4TFs and analyzed at day 35 by immunofluorescence for GFP (green) and CD49f staining (red). a) CD49f+ endothelial-like and b) small semi-adherent GFP+CD49f+ cells are highlighted. Scale bar = 100 µm. (G) Flow plots show the expression of CD49f in CD45+ and CD45- population. (H) Statistically significant genes up regulated from day 0 MEFs to day 20 and from day 20 to day 35 CD45+cKit+ cells were analyzed for gene list enrichment with gene set libraries created from level 4 of the MGI mouse phenotype ontology using Network2Canvas (http://maayanlab.net/N2C/). Phenotype categories are organized on the grid according to gene list similarity; enriched categories are highlighted by circles. Circle brightness represents increasingly significant p-values. Relevant terms are highlighted. (I) Analysis using a gene set library created from the miRNA prediction tool TargetScan. Micro RNAs implicated in endothelial cells (left panel) or HSPCs (right panel) are highlighted. See also Figure S4 and S5.
Figure 6
Figure 6. Specified hematopoietic cells display hallmarks of definitive hematopoiesis
(A) Gene set enrichment analysis (GSEA) for day 20 and day 35 GFP+CD45+cKit+ samples. Gene expression lists were analyzed for enrichment of gene sets present in the MSigDB database (1,888 gene sets, gene size 0–5000). Orange lines represent HSC datasets and grey lines non-HSC datasets ordered according to the normalized enrichment score (NES). The dashed line highlights the cut-off FDR = 0.25. Right panels show GSEA of NetPath-annotated signaling pathways. Only enriched pathways are shown (FDR<0.25, colored according to NES). (B) GSEA for day 35 CD45+cKit+ and CD45+cKit- cells. The dashed line highlights the cut-off FDR = 0.35. The right panel shows the enrichment plot for 1 LT-HSC gene set. (C) Hierarchical clustering showing the integration of gene expression data from specified cells (highlighted in red) with HSCs at several developmental stages (data from McKinney-Freeman et al, 2012). (D) The expression of TFs implicated in HSC specification and maintenance is shown as FPKM values and highlighted in CD45+cKit+ (red bars). Data are represented as mean ± SEM. (E) Heat map showing the enriched expression of the Notch and (F) Cxcr4 pathway components in CD45+ cells. Notch1, Notch2 and Cxcr4 receptors are highlighted in red. FPKM values were analyzed by Cluster and displayed by Treeview. Red designates increased expression and green designates decreased expression relative to the mean. No detection is designated by grey. (G) MEFs, day 20, day 35 CD45+cKit+ and CD45+cKit- replicates (1, 2) were analyzed for expression of pMXs vector-derived sequences. Graphs show reads that align to the pMXs LTRs and maximum read heights are displayed.
Figure 7
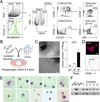
Figure 7. Specified cells contain a subpopulation with a LT-HSC cell surface phenotype and generate in vitro colonies after reaggregation culture
(A) A subpopulation of CD150+CD48-cKit+ is present in the Sca1+CD45+ population 30 days after transduction. The histogram shows reporter expression in the CD45+ and CD45- compartments of the Sca1+ population. The Sca1+CD45+CD150+CD48- and Sca1+CD45+CD150+CD48- cKit+ populations represent 1.6% and 0.64% of total cells, respectively. (B) Reaggregation strategy for cells generated with inducible (i) 4TFs at day 25 (+Dox) and irradiated mouse placental tissue (E12.5). Reaggregates were cultured (-Dox) for 4 or 5 days before transfer to methylcellulose-containing media. (C) Clonogenic activity in semisolid media after a reaggregation step of 4 (d4) or 5 (d5) days. Control irradiated placenta alone (Plc) did not generate colonies (n = 6). Colony numbers per 3 plated reaggregates are shown (mean ± SEM). Scale bars = 100 µm. (D) One colony was manually picked and analyzed by immunofluorescence for CD45 (red). Dapi staining is shown in blue. The flow cytometry plot shows the percentage of CD45-positive cells (red line) in 3 pooled colonies. Staining control is shown in black. Scale bar = 20 µm. (E) Mixed cell morphologies are observed from cells within the colonies; shown by modified Giemsa staining. Scale bar = 100 µm. (F) Integration of inducible lentivirus in 5 independent colonies was confirmed by PCR. The forward primer is in the lentiviral vector (tetO) and the reverse in the coding sequence of Gata2 (lower panel) or M2rtTA (upper panel). See also Figure S6.

Comment in

References

    1. Bertrand JY, Chi NC, Santoso B, Teng S, Stainier DY, Traver D. Haematopoietic stem cells derive directly from aortic endothelium during development. Nature. 2010;464:108–111. - PMC - PubMed
    1. Boisset JC, van Cappellen W, Andrieu-Soler C, Galjart N, Dzierzak E, Robin C. In vivo imaging of haematopoietic cells emerging from the mouse aortic endothelium. Nature. 2010;464:116–120. - PubMed
    1. Burda P, Laslo P, Stopka T. The role of PU.1 and GATA-1 transcription factors during normal and leukemogenic hematopoiesis. Leukemia. 2010;24:1249–1257. - PubMed
    1. Chen MJ, Li Y, De Obaldia ME, Yang Q, Yzaguirre AD, Yamada-Inagawa T, Vink CS, Bhandoola A, Dzierzak E, Speck NA. Erythroid/myeloid progenitors and hematopoietic stem cells originate from distinct populations of endothelial cells. Cell Stem Cell. 2011;9:541–552. - PMC - PubMed
    1. Deneault E, Cellot S, Faubert A, Laverdure JP, Frechette M, Chagraoui J, Mayotte N, Sauvageau M, Ting SB, Sauvageau G. A functional screen to identify novel effectors of hematopoietic stem cell activity. Cell. 2009;137:369–379. - PMC - PubMed

Publication types

MeSH terms

Associated data