

hnRNPLL controls pluripotency exit of embryonic stem cells by modulating alternative splicing of Tbx3 and Bptf
- PMID: 33349972
- PMCID: PMC7883296
- DOI: 10.15252/embj.2020104729
hnRNPLL controls pluripotency exit of embryonic stem cells by modulating alternative splicing of Tbx3 and Bptf
Abstract
The regulatory circuitry underlying embryonic stem (ES) cell self-renewal is well defined, but how this circuitry is disintegrated to enable lineage specification is unclear. RNA-binding proteins (RBPs) have essential roles in RNA-mediated gene regulation, and preliminary data suggest that they might regulate ES cell fate. By combining bioinformatic analyses with functional screening, we identified seven RBPs played important roles for the exit from pluripotency of ES cells. We characterized hnRNPLL, which mainly functions as a global regulator of alternative splicing in ES cells. Specifically, hnRNPLL promotes multiple ES cell-preferred exon skipping events during the onset of ES cell differentiation. hnRNPLL depletion thus leads to sustained expression of ES cell-preferred isoforms, resulting in a differentiation deficiency that causes developmental defects and growth impairment in hnRNPLL-KO mice. In particular, hnRNPLL-mediated alternative splicing of two transcription factors, Bptf and Tbx3, is important for pluripotency exit. These data uncover the critical role of RBPs in pluripotency exit and suggest the application of targeting RBPs in controlling ES cell fate.
Keywords: RNA-binding proteins; alternative splicing; embryonic stem cells; exit from pluripotency; hnRNPLL.
© 2020 The Authors.
Conflict of interest statement
The authors declare that they have no conflict of interest.
Figures
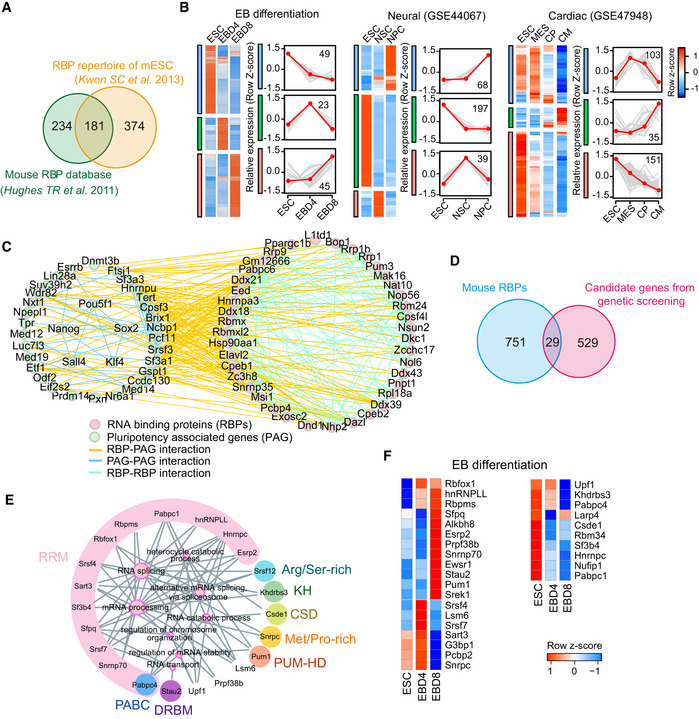
Overlap of the mouse RBP database and the RBP repertoire revealed by the mRNA interactome in mouse ES cells. All the 789 RBPs were subsequently analyzed.
The differentially expressed RBPs during embryoid body (EB) differentiation, neural differentiation, and cardiac differentiation, which are classified as different clusters. The right line plots show the dynamic expression pattern of each cluster, gray lines represent the expression of all genes in individual cluster, while the red line represents the average expression level. The number on the graph indicates the number of RBPs in the cluster. The expression value was firstly z‐score scaled before plotting. EBD4: embryoid body at day 4; EBD8: embryoid body at day 8; NSC: Neural Stem Cells; NPC: Neural Progenitor Cell; MES: mesodermal cells; CP: Cardiac Precursors; CM: Cardiomyocytes.
The protein–protein interaction (PPI) network between differentially expressed RBPs (pink dot) during EB formation and pluripotency‐associated genes (PAG) (green dot). The interaction relationships were downloaded from STRING database.
Overlap of the 789 RBPs with the published screen data on mouse ES cell exit from pluripotency. The overlapped 29 RBPs may function in exit from pluripotency.
Gene ontology (GO) enrichment of the above 29 RBPs. The node size of enriched GO terms indicates the number of enriched RBPs, and RBPs with the same domains (e.g., RPM) are clustered and filled with the same background color. The domain names are labeled around enriched RBPs.
Heatmap showing the expression pattern of the 29 RBPs during EB differentiation.
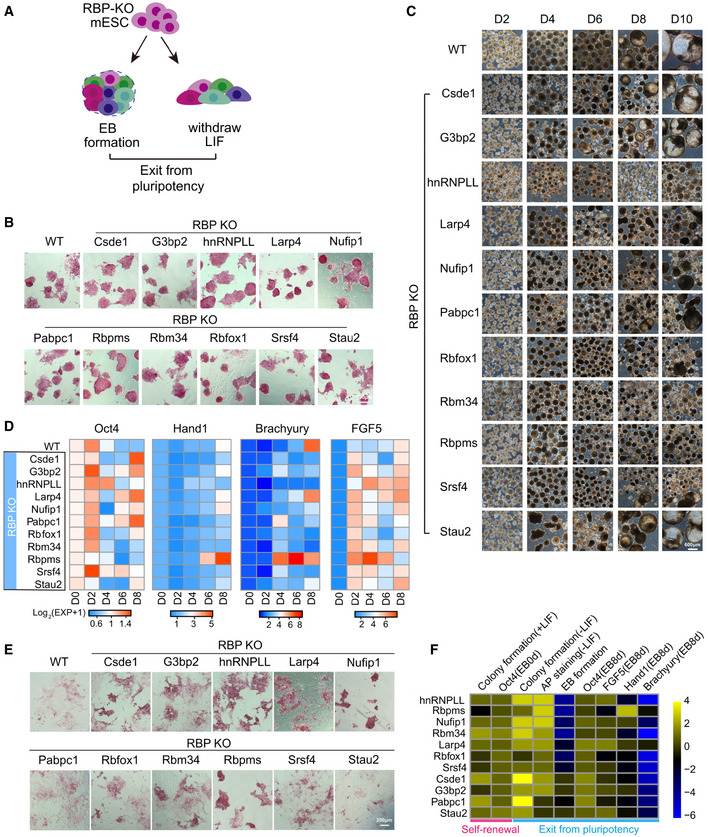
The research strategy to dissect the role of RBPs in regulating exit from pluripotency. Firstly, we constructed individual RBP‐KO ES cells and examined their ability to exit from pluripotency through forming EB and random differentiation by LIF withdrawal assay.
AP staining of 11 RBP‐KO ES cell lines maintained under ES cell culture conditions. Scale bar, 200 μm.
EB formation from WT and RBP‐KO ES cell lines. WT ES cell‐derived EBs formed cystic structures by day 8 of differentiation; most of RBP‐KO ES cell‐derived EBs were more compact. Scale bar, 600 μm.
Time‐course analysis of Oct4 expression and three lineage differentiation markers (Hand1, Brachyury, and FGF5) during EB formation. It was quantified by qRT‐PCR, the relative expression of genes was calculated by the double delta C t (ΔΔC t) method, normalized to the expression value at day 0. The relative expression data were represented as the heatmap.
AP staining of WT and 11 RBP‐KO ES cell lines after LIF withdrawal. Scale bar, 200 μm.
RBP ranking based on ES cell abilities to self‐renewal (determined by colony formation (±LIF) and Oct4 expression) and exit from pluripotency (determined by AP staining, EB formation, and marker genes expression) in the context of RBP‐KO. The expression value of Oct4, FGF5, Hand1, and Brachyury was represented as the relative level of these genes compared with their expressions in WT ES cells. The quantitation of other phenotypes, such as colony formation, AP staining, and EB formation was manually defined.
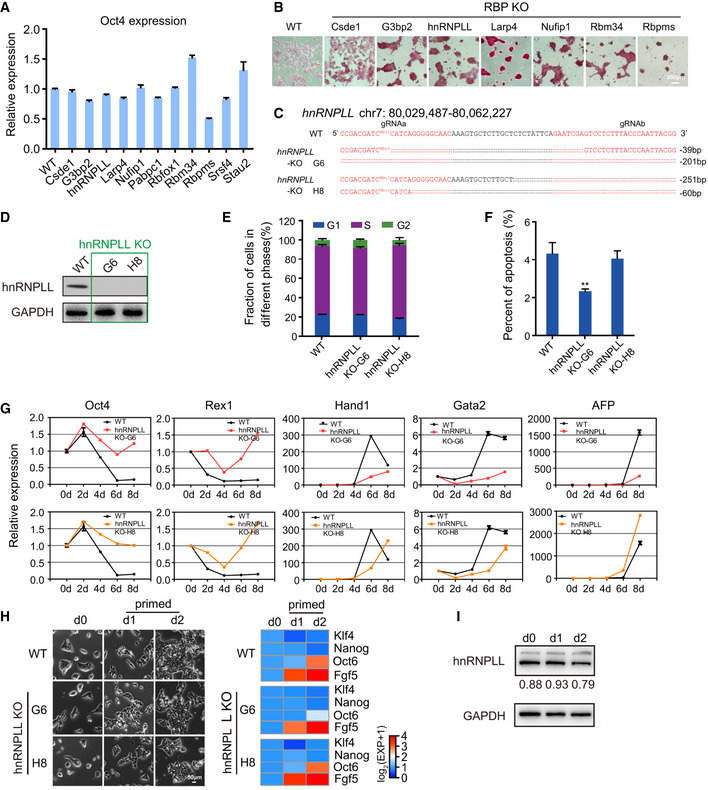
Relative expression of Oct4 determined by qRT–PCR. The data represent the means ± SD (n = 3, from biological repeats).
AP staining of WT and 7 RBP‐KO ES cell lines after 2i + LIF withdrawal under N2B27 culture conditions. Scale bar, 200 μm.
The sequence of the hnRNPLL‐KO allele in ES cell lines derived from clones G6 and H8.
Western blot analysis of hnRNPLL expression in hnRNPLL‐KO ES cell lines.
Cell cycle phase distribution in WT and hnRNPLL‐KO ES cell lines. The data represent the means ± SD (n = 3, from biological repeats).
Apoptosis analysis of WT and hnRNPLL‐KO ES cell lines. The data represent the means ± SD (n = 3, from biological repeats). **P < 0.01. t‐Test was used to determine the significance.
Relative expression levels of pluripotency genes (Oct4 and Rex1) and lineage‐specific genes (Hand1, Gata2, AFP) during EB formation at the indicated days as measured by qRT–PCR. The data represent the means ± SD (n = 3, from biological repeats).
The transition of WT and the two hnRNPLL‐KO ES cell clones from the naïve to the primed state. Cells were firstly cultured under the naïve state (2i + LIF) and then transited to the primed state for the indicated number of days. Naïve (Klf4 and Nanog) and primed (FGF5 and Oct6)‐associated gene expression during the transition process (right) was examined by qRT‐PCR. Scale bar, 50 μm.
Western blot detection of hnRNPLL expression during the transition of WT ES cells from the naïve to the primed state.
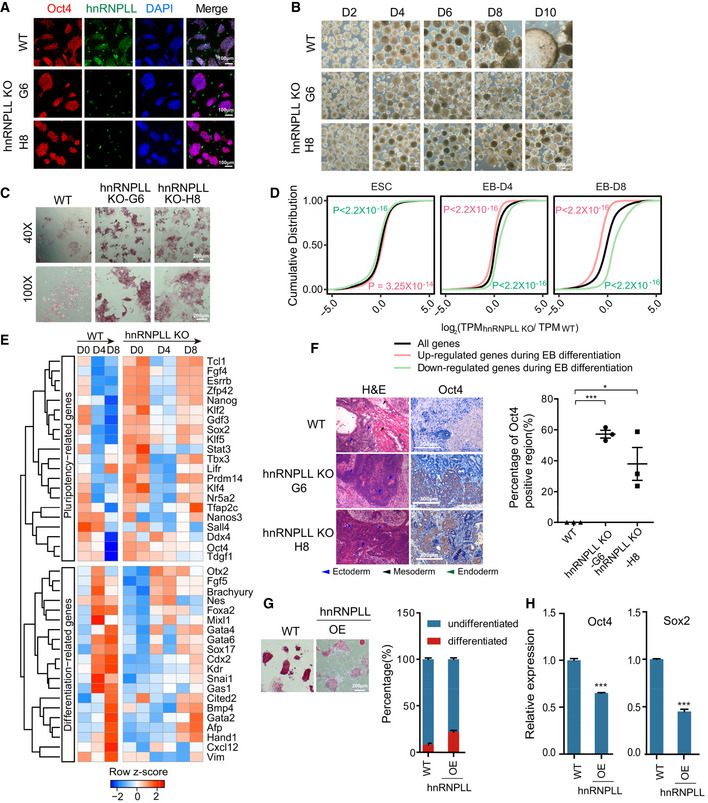
Immunofluorescence staining of Oct4 and hnRNPLL in WT and hnRNPLL‐KO ES cells from two clones (H8 and G6). hnRNPLL was not expressed in either of the hnRNPLL‐KO clones. DAPI stained the nuclei. Scale bar, 100 μm.
EB formation from WT and the two hnRNPLL‐KO ES cell clones. WT ES cell‐derived EBs formed cystic structures by day 8 of differentiation, while both hnRNPLL‐KO ES cell clones‐derived EBs were more compact. Scale bar, 200 μm.
AP staining of WT and both hnRNPLL‐KO ES cell clones after LIF withdrawal. Scale bar, 200 μm.
Cumulative distribution showing the relative expression of WT‐differentially expressed genes in hnRNPLL‐KO ES cells during EB differentiation. Red lines and green lines represent the up‐ and down‐regulated genes during EB differentiation of WT ES cells, while the black line stands for all expressed genes in WT and hnRNPLL‐KO ES cells. Kolmogorov–Smirnov test was used to determine the significance. The relative expression ratio was log2‐transformed before plotting.
Heatmap of key pluripotency‐ and differentiation‐associated gene expression during EB formation from WT and hnRNPLL‐KO clones (H8 and G6).
Hematoxylin and eosin labeling and Oct4 immunohistochemical staining of teratomas derived from WT and hnRNPLL‐KO ES cells (left). Representative Oct4‐positive regions are shown. The percentage of Oct4‐positive region (%) is plotted (right). The data represent the means ± SD, (n = 3, from biological repeats). *P < 0.05; ***P < 0.001. t‐Test was used to determine the significance. Scale bar, 100 μm.
AP staining of WT and hnRNPLL overexpression ES cell lines maintained under ES cell culture conditions and colony formation assay. Scale bar, 200 μm. The data represent the means ± SD (n = 3 biological repeats).
Relative expression of Oct4 and Sox2 after hnRNPLL overexpression. The data represent the means ± SD (n = 3, from biological repeats). ***P < 0.001. t‐Test was used to determine the significance.
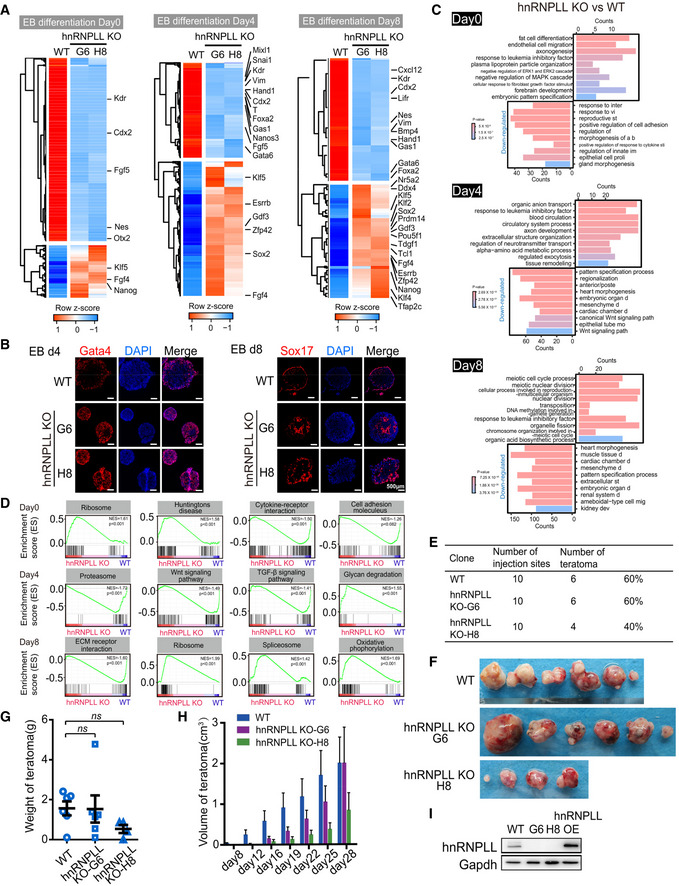
Heatmap showing the differential expressed genes between WT and hnRNPLL‐KO ES cells during EB formation. The important pluripotency‐ and differentiation‐associated genes were indicated.
Immunofluorescence staining of Gata4 or Sox17 in EBs generated from WT and two hnRNPLL‐KO ES cell clones (H8 and G6) at the indicated time point. Gata4‐ or Sox17‐positive endoderm cells were mainly at the outer layer of WT Ebs at differentiation day 4 or 8. Scale bar, 500 μm.
Top 10 enriched GO terms of differentially expressed genes between WT and hnRNPLL‐KO ES cells during EB formation.
GSEA of KEGG pathways between hnRNPLL‐KO and WT ES cells during EB formation at day 0 (upper), day 4 (middle), and day 8 (lower).
Teratoma formation efficiency from WT and hnRNPLL‐KO ES cell lines.
Representative images of teratomas formed from WT and hnRNPLL‐KO ES cell lines.
Weight of teratomas derived from WT and hnRNPLL‐KO ES cells (H8 and G6). The data represent the means ± SD (n > 3 biological repeats). Ns, not significant. t‐Test was used to determine the significance.
Volumes of teratomas at different days after injection. The data represent the means ± SD (n > 3, from biological repeats).
Western blot validation of hnRNPLL overexpression in ES cells.
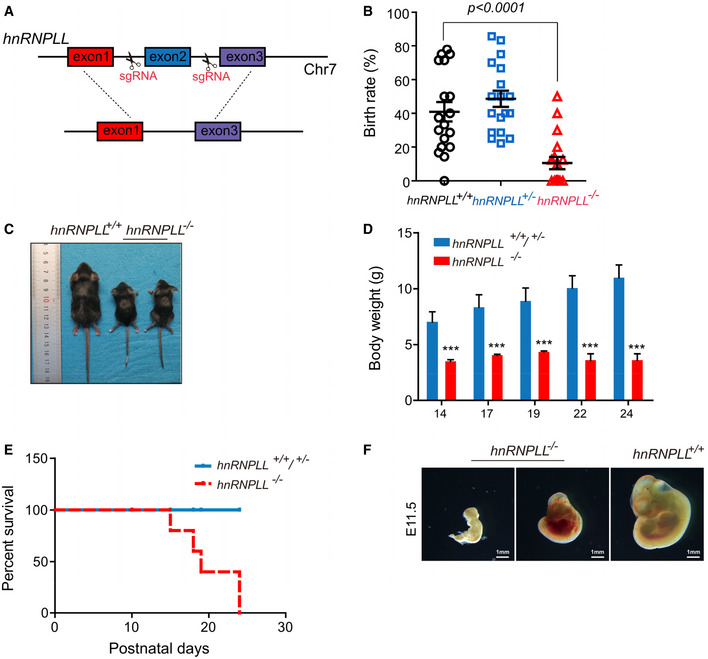
Schematic of hnRNPLL knockout mouse, in which its exon two is deleted.
Birth rate of the different hnRNPLL genotypes, the birth rate of hnRNPLL −/− mice was significantly lower than that of WT hnRNPLL +/+ mice. The data represent the means ± SD. t‐Test was used to determine the significance.
Representative images of hnRNPLL +/+ and hnRNPLL −/− littermates at 3 weeks.
Body weight growth curve of mice at different postnatal days. The data represent the means ± SD (n = 5–10). ***P < 0.001. t‐Test was used to determine the significance.
Survival curve analysis for hnRNPLL +/+, hnRNPLL +/−, and hnRNPLL −/−mice (ten mice in hnRNPLL +/+/+/− group and seven mice in hnRNPLL −/−group).
Genotypes and representative images of hnRNPLL +/+ embryo and retarded hnRNPLL −/− embryos at E11.5 which generated from hnRNPLL +/− intercrosses. Scale bar, 1 mm.
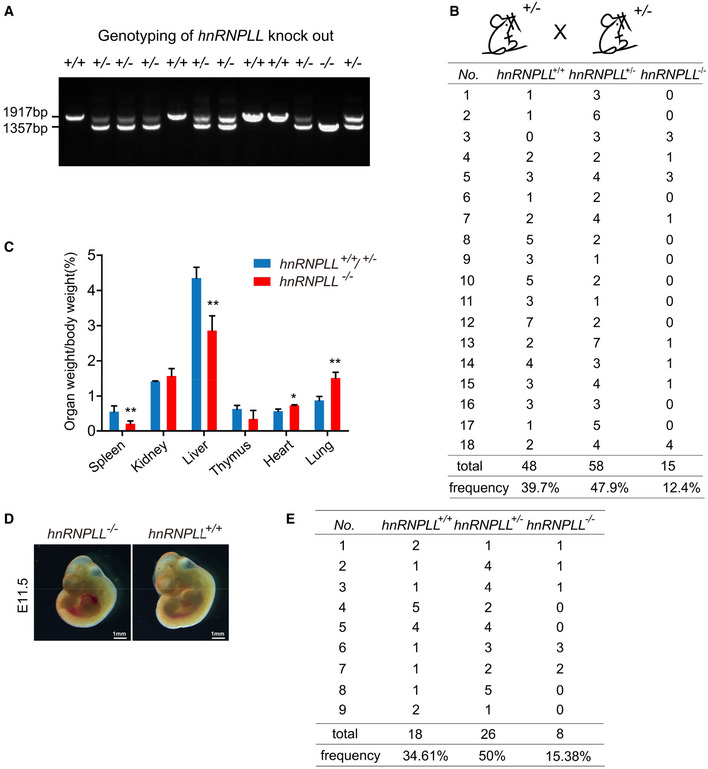
Genotyping of littermates generated from hnRNPLL +/− intercrosses.
Statistical analysis of the genotypes of 18 litters generated from hnRNPLL +/− intercrosses.
The organ to body weight ratio for hnRNPLL +/+, hnRNPLL +/−, and hnRNPLL −/− mice. The data represent the means ± SD (n ≥ 3, from biological repeats). *P < 0.05; **P < 0.01. t‐Test was used to determine the significance.
Representative images of hnRNPLL +/+ embryo and hnRNPLL −/− embryo at E11.5 which generated from hnRNPLL +/− intercrosses. The image of hnRNPLL +/+ embryo was a repeated display of Fig 4F. Scale bar, 1 mm.
Statistical analysis of the genotypes of 9 litters at E11.5 generated from hnRNPLL +/− intercrosses.
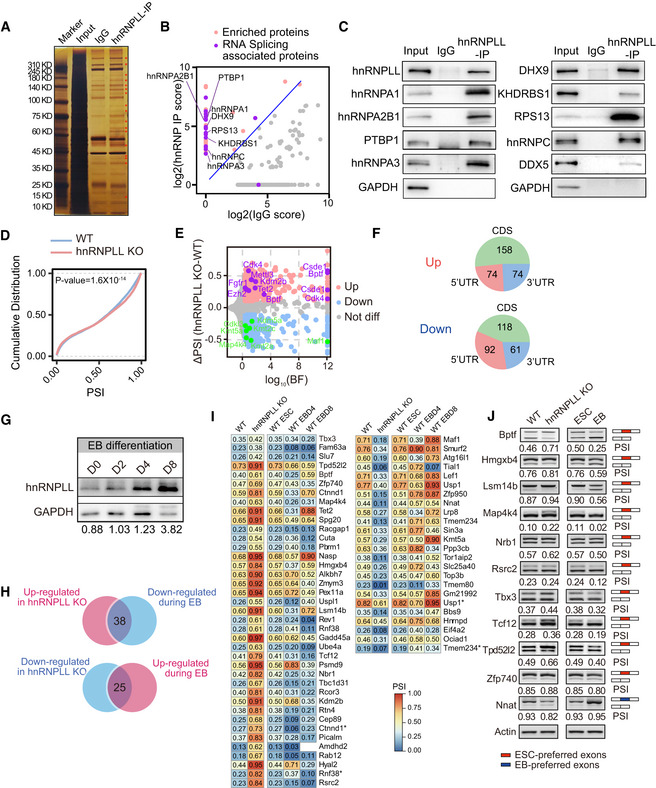
Silver nitrate‐stained NuPAGE gel of hnRNPLL‐interacting proteins. Red star indicate hnRNPLL‐specific interacting proteins compared with IgG.
Mass spectrum identification of the hnRNPLL interactome in ES cells. RNA splicing associated proteins are well enriched by hnRNPLL IP. The enrichment score was log2‐transformed before plotting.
Western blot validation the interactions between hnRNPLL and the indicated splicing‐associated proteins.
Cumulative distribution of PSI with exon skipping events between WT and hnRNPLL‐KO ES cells. Kolmogorov–Smirnov test was used to determine the significance.
Volcano plot of differential exon skipping events between WT and hnRNPLL‐KO ES cells. Indicated AS events were labeled in purple (up‐regulated) and green (down‐regulated) with gene names.
The regional distribution of differential exon skipping events between WT and hnRNPLL‐KO ES cells.
Western blot analysis of hnRNPLL protein during EB formation of WT ES cells at indicated days.
Venn plot showed the divergent exon skipping events between EB differentiation and hnRNPLL deletion. 38 exon skipping events that were inhibited by hnRNPLL but increased during EB differentiation, and 25 events that showed the opposite profile.
Heatmap of the 38 and 25 divergent exon skipping events in Fig 5I. * indicates the different exon skipping events of the same gene.
RT–PCR validation of partial divergent exon skipping events shown in Fig 5J. Red boxes represent ESC preferred exons, blue boxes indicate EB preferred exons.
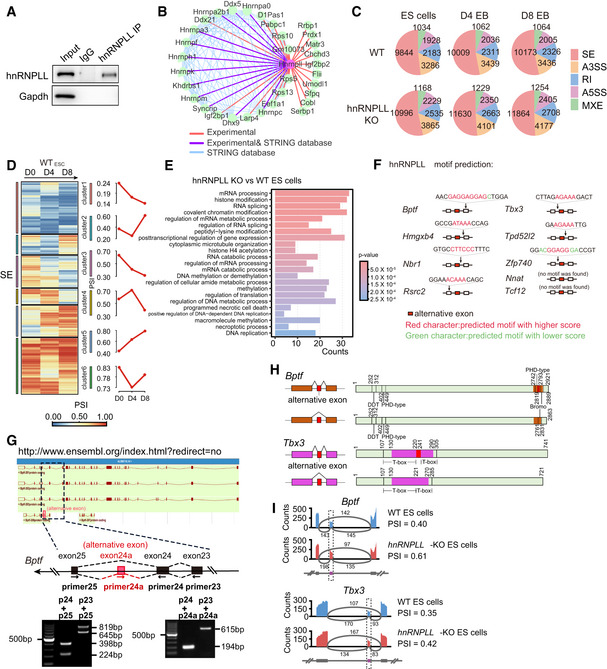
Immunoprecipitation of hnRNPLL in ES cells.
The protein–protein interaction network between hnRNPLL and its partners reported in the STRING database. The purple lines indicated the interactions verified by mass spectrum, while the red lines represent the interactions only reported in our mass spectrum data.
The number of AS events of five AS types occurring at each stage during differentiation, for WT and hnRNPLL‐KO ES cell lines.
Heatmap of the differential exon skipping events during WT EB formation (left). The AS events were classified into 6 clusters and average PSI value of each cluster were plot in red (right).
Gene ontology enrichment based on the differentially expressed AS genes between WT and hnRNPLL‐KO cells.
Predicted hnRNPLL‐binding motif in the indicated transcripts. Arrow indicates motif position relative to the alternatively spliced exon.
Verification of the Bptf isoforms including the alternative exon. Images of Bptf isoforms from Ensembl database (upper).
Position of the indicated alternative exon relative to the known Tbx3 or Bptf functional domain.
Sashimi plots showing the read distribution of alternative spliced exons of Bptf and Tbx3 between the WT and hnRNPLL‐KO ES cells. The alternative spliced exons of the AS events were colored in purple. Numbers of exon–exon junction reads were marked above gray arc. PSI of AS events was labeled on the right.
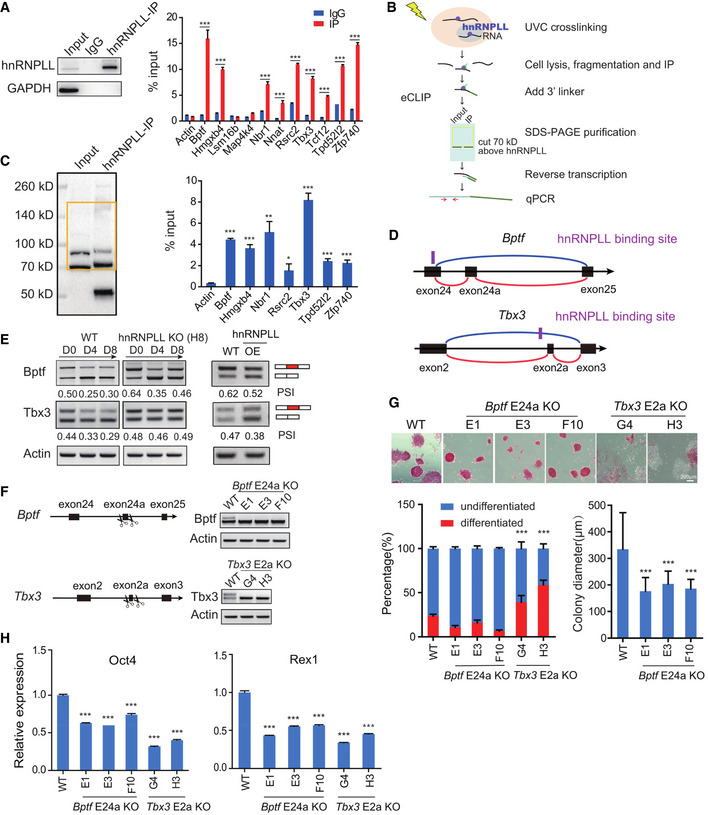
RIP‐PCR validation of the transcripts that interact with hnRNPLL. The left panel shows the results of Western blots verification of hnRNPLL Immunoprecipitation efficiency. The data represent the means ± SD (n = 3, from biological repeats). ***P < 0.001. t‐Test was used to determine the significance.
The CLIP‐PCR pipeline. Specifically, hnRNPLL and its target RNA are cross‐linked by UV, then enriched by immunoprecipitation. 3′linker is added to the RNA tag, then hnRNPLL–RNA complex is purified by SDS–PAGE. After protease K digestion, RNA is reversed into cDNA. qRT–PCR is performed to detect cross‐linked RNA.
Purification of hnRNPLL–RNA complex and detection of the RNA targets in the complex by PCR. The left panel shows the membrane position labeled as the yellow square which was cut to extract the hnRNPLL–RNA complex. The bands around 70KD indicate hnRNPLL proteins, and the bands around 50KD indicate the heavy chain of antibodies used in Immunoprecipitation. The right plot indicates the enrichment of these RNA targets in the hnRNPLL–RNA complex. The data represent the means ± SD (n = 3, from biological repeats). *P < 0.05; ***P < 0.001. t‐Test was used to determine the significance.
Bptf and Tbx3 alternative splicing model: Bptf exon24a and Tbx3 exon2a are alternatively spliced. The predicted hnRNPLL‐binding motif sites were marked in purple. The red and blue lines represented include and excluded isoforms of the AS events, respectively.
Detection of Bptf and Tbx3 exon skipping events during EB formation in WT and hnRNPLL‐KO ES cells (left) and in hnRNPLL overexpression ES cells under ES cell culture conditions (right) by RT–PCR. OE, hnRNPLL overexpression.
RT–PCR validation of Bptf exon24a and Tbx3 exon2a deletion in WT ES cells.
AP staining of Bptf E24a KO or Tbx3 E2a KO ES cells maintained under normal ES cell culture conditions (upper). Scale bar, 200 μm. Colony formation assay of Bptf E24a KO or Tbx3 E2a KO ES cells under ES cell culture condition (lower left). The data represent the means ± SD (n = 3, from biological repeats). ***P < 0.001. Colony diameter of Tbx3 E2a KO ES cells (lower right). The data represent the means ± SD (n > 80). ***P < 0.001. t‐Test was used to determine the significance.
Relative expression of Oct4 and Rex1, determined by qRT–PCR. The data represent the means ± SD (n = 3, from biological repeats). ***P < 0.001. t‐Test was used to determine the significance.
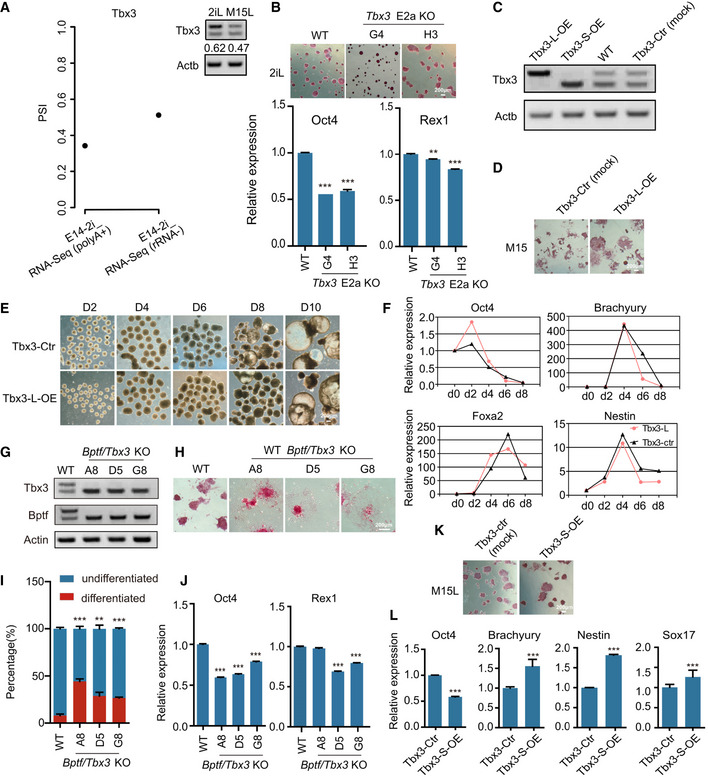
Utilization rate of Tbx3 alternative exon in 2i + LIF culture condition in the published 2i + LIF RNA‐seq data (GSE23943) (left) and also detected by RT–PCR (right).
AP staining and relative expression of Oct4 and Rex1 in WT or Tbx3 E2a KO ES cells maintained under 2i + LIF culture conditions. The data represent the means ± SD (n = 3, from biological repeats). **P < 0.01, ***P < 0.001. t‐Test was used to determine the significance. Scale bar, 200 μm.
RT–PCR validation of Tbx3‐L or Tbx3‐S overexpression in ES cells. Tbx3‐L‐OE, Tbx3 long isoform overexpression. Tbx3‐S‐OE, Tbx3 short isoform overexpression. Tbx3‐Ctr, ES cells transfected with empty vector.
AP staining of Tbx3‐Ctr and Tbx3‐L‐OE ES cell lines after LIF withdrawal. Scale bar, 200 μm.
EB formation from Tbx3‐Ctr and Tbx3‐L‐OE ES cell clones. Scale bar, 200 μm.
Relative expression levels of pluripotency genes (Oct4) and lineage‐specific genes (Brachyury, Nestin, Foxa2) during EB formation at the indicated days as measured by qRT–PCR. The data represent the means ± SD (n = 3, from biological repeats).
RT–PCR validation of Bptf and Tbx3 alternative exon deletion in WT ES cells.
AP staining of Bptf/Tbx3 KO ES cells maintained under normal ES cell culture conditions. Scale bar, 200 µm.
Colony formation assay of Bptf/Tbx3 KO ES cells under ES cell culture condition. The data represent the means ± SD (n = 3, from biological repeats). **P < 0.01, ***P < 0.001. t‐Test was used to determine the significance.
Relative expression of Oct4 and Rex1 in Bptf/Tbx3 KO ES cells, determined by qRT–PCR. The data represent the means ± SD (n = 3, from biological repeats). ***P < 0.001. t‐Test was used to determine the significance.
AP staining of Tbx3‐Ctr and Tbx3‐L‐OE ES cell lines under ES cell culture condition. Scale bar, 200 μm.
Relative expression of Oct4, Brachyury, Nestin, and Sox17 with Tbx3‐S‐OE. The data represent the means ± SD (n = 3, from biological repeats). ***P < 0.001. t‐Test was used to determine the significance.
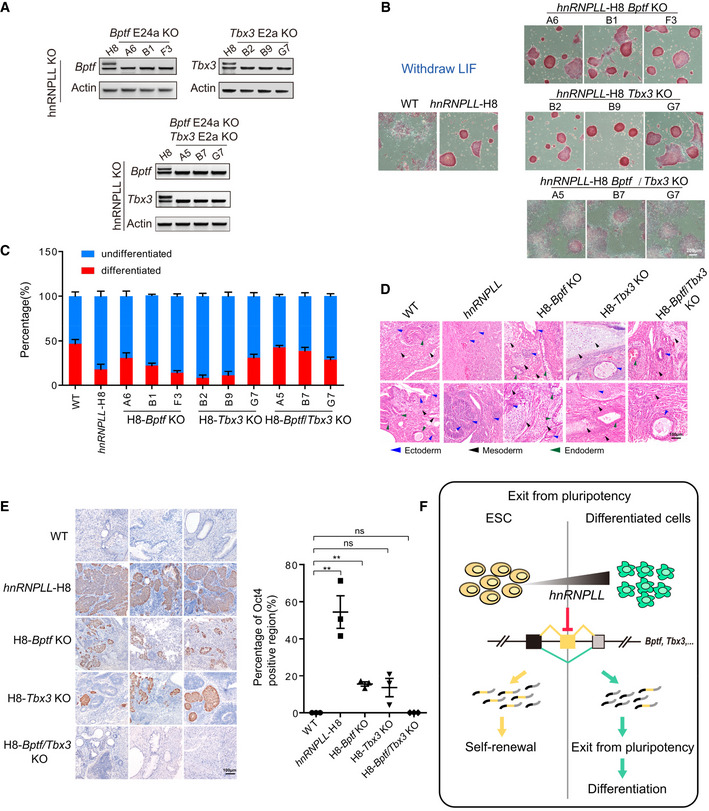
RT–PCR validation of Bptf and Tbx3 alternative exon deletion, separately in hnRNPLL‐KO H8 cells (upper) and simultaneously in hnRNPLL‐KO H8 cells (lower).
AP staining of H8‐Bptf or H8‐Tbx3 exon‐KO ES cells after LIF withdrawal. hnRNPLL‐H8, hnRNPLL‐KO ES cells; H8‐Bptf KO, alternative Bptf exon was deleted in hnRNPLL‐KO H8 cells; H8‐Tbx3 KO, alternative Tbx3 exon was deleted in hnRNPLL‐KO H8 cells; H8‐Bptf/Tbx3 KO, alternative Bptf or Tbx3 exons were simultaneously deleted in hnRNPLL‐KO H8 cells. Scale bar, 200 μm.
Colony formation assay of H8‐Bptf or H8‐Tbx3 exon‐KO ES cells after LIF withdrawal. The data represent the means ± SD (n = 3, from biological repeats).
Hematoxylin and eosin labeling of teratomas derived from WT and H8‐Bptf or H8‐Tbx3 exon‐KO ES cells. The blue triangle represent ectoderm, the dark one represent mesoderm, and the green one represent endoderm. Scale bar, 100 μm.
Oct4 immunohistochemical staining of teratomas derived from WT and H8‐Bptf or H8‐Tbx3 exon‐KO ES cells. Representative Oct4‐positive regions are shown (left). Scale bar, 100 µm. The percentage Oct4‐positive region (%) is shown (right). The data represent the means ± SD (n = 3 biological repeats). **P < 0.01; ns, not significant. t‐Test was used to determine the significance.
Schematic representation of hnRNPLL regulating the AS of crucial genes that have an important role in mediating exit from pluripotency.
References
-
- Alexander J, Wamstad J (2013) Gene Expression Omnibus GSE47948 (https://www.ncbi.nlm.nih.gov/geo/query/acc.cgi?acc=GSE47948) [DATASET]
-
- Chen J, Weiss WA (2015) Alternative splicing in cancer: implications for biology and therapy. Oncogene 34: 1–14 - PubMed
Publication types
MeSH terms
Substances
Associated data
- Actions
- Actions
- Actions
Grants and funding
LinkOut - more resources
Full Text Sources
Molecular Biology Databases
Research Materials
