. 2013 Oct;20(10):1206-13.
doi: 10.1038/nsmb.2667. Epub 2013 Sep 22.

Cycles in spatial and temporal chromosomal organization driven by the circadian clock

Affiliations

Cycles in spatial and temporal chromosomal organization driven by the circadian clock

Lorena Aguilar-Arnal et al. Nat Struct Mol Biol. 2013 Oct.

Abstract

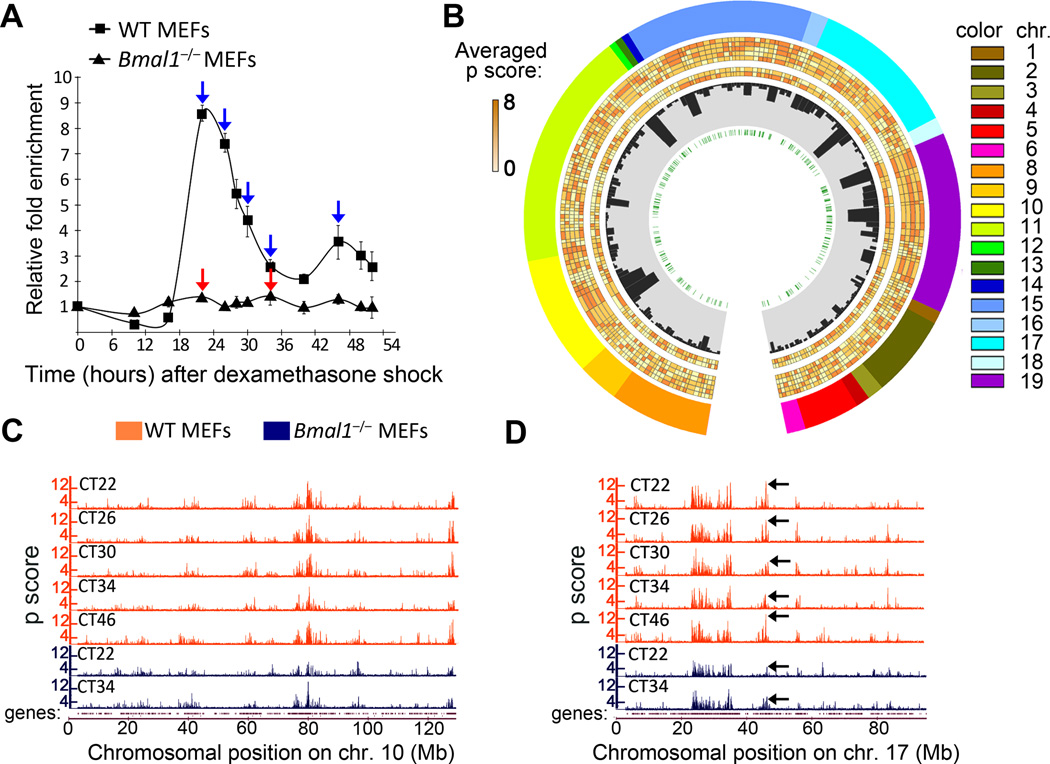
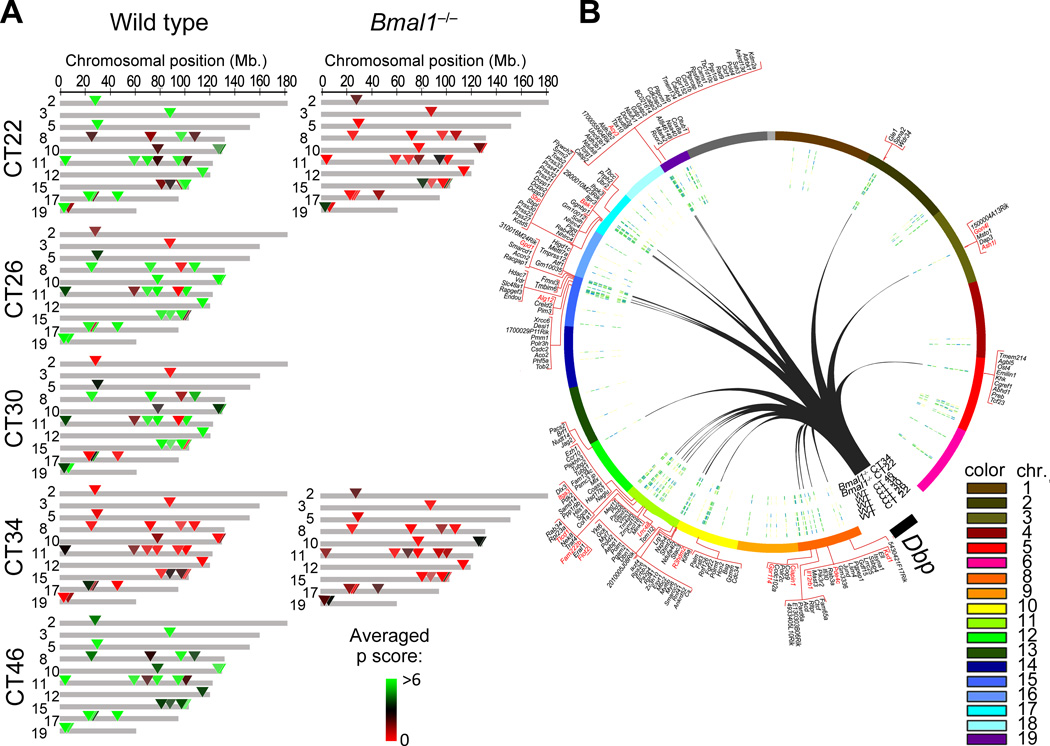
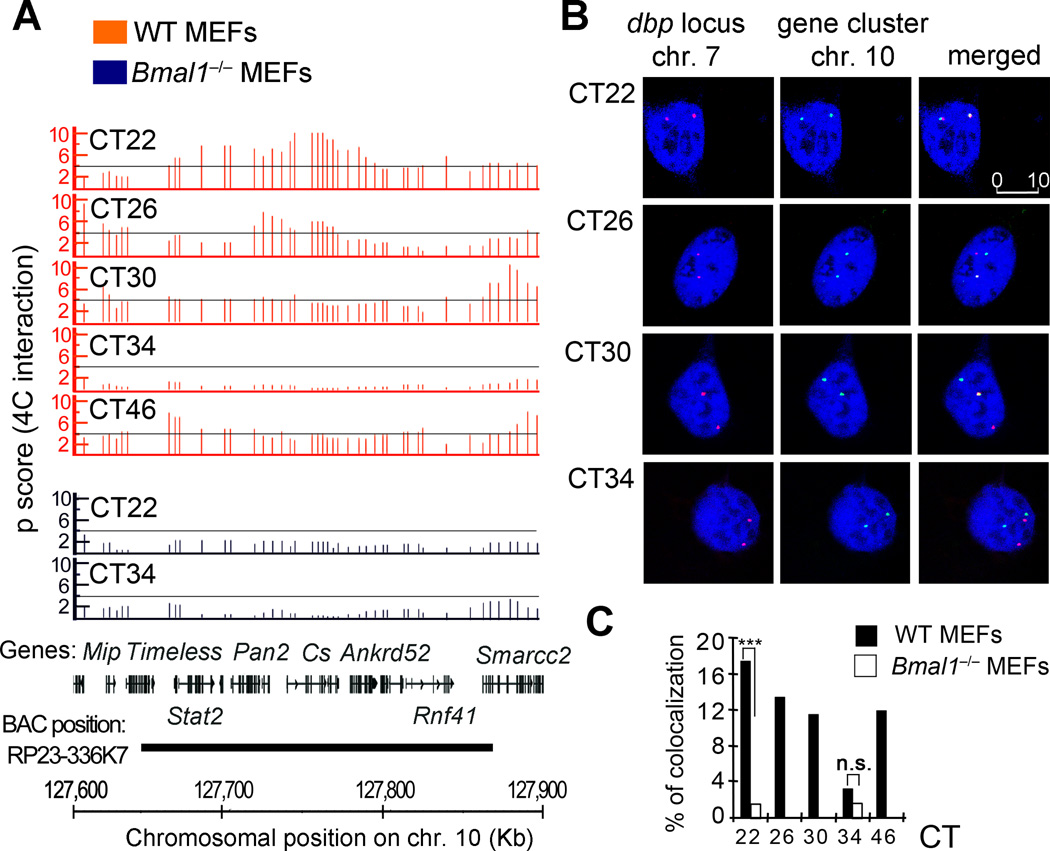
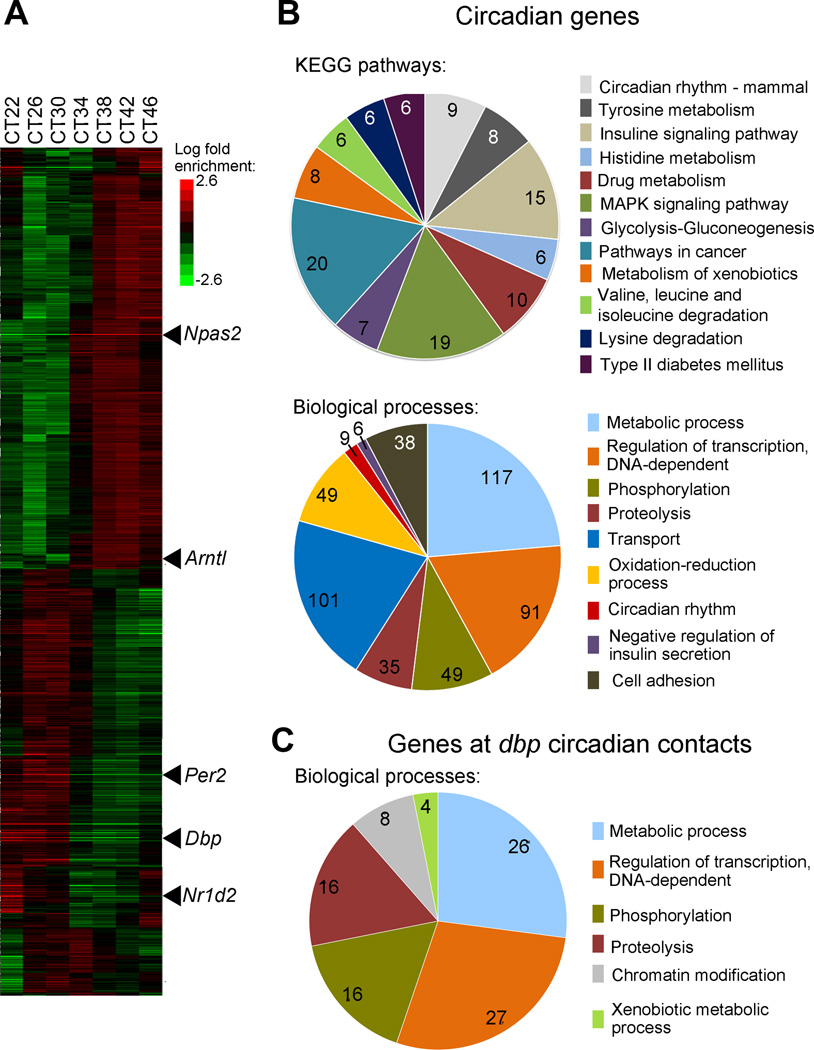
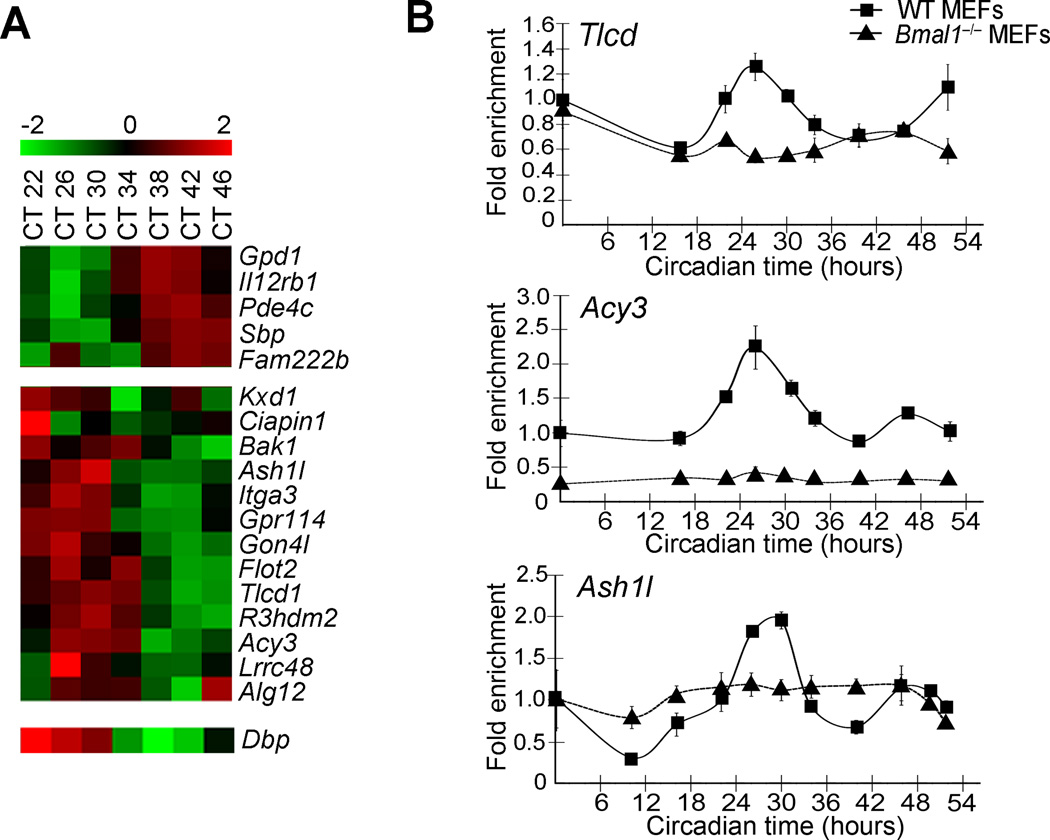
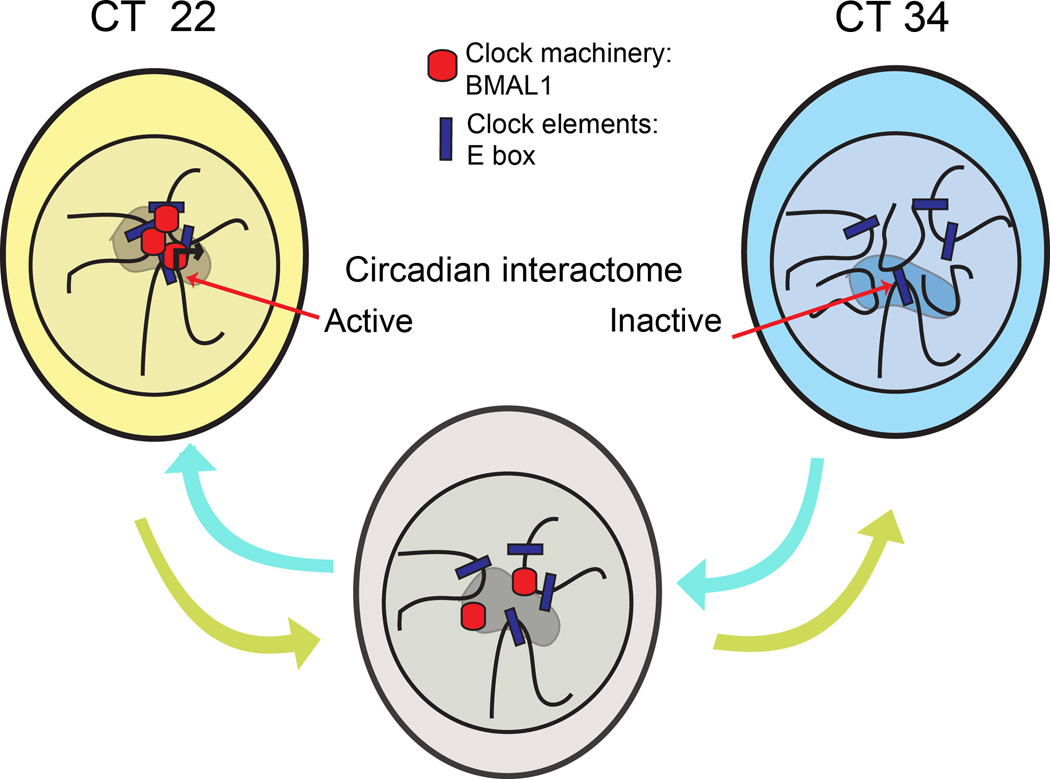
Dynamic transitions in the epigenome have been associated with regulated patterns of nuclear organization. The accumulating evidence that chromatin remodeling is implicated in circadian function prompted us to explore whether the clock may control nuclear architecture. We applied the chromosome conformation capture on chip technology in mouse embryonic fibroblasts (MEFs) to demonstrate the presence of circadian long-range interactions using the clock-controlled Dbp gene as bait. The circadian genomic interactions with Dbp were highly specific and were absent in MEFs whose clock was disrupted by ablation of the Bmal1 gene (also called Arntl). We establish that the Dbp circadian interactome contains a wide variety of genes and clock-related DNA elements. These findings reveal a previously unappreciated circadian and clock-dependent shaping of the nuclear landscape.


Figures

Figure 1
Figure 1. Characterization of genomic long-range interactions during the circadian cycle
A, Dbp expression profile in wild type (WT) and Bmal1−/− MEFs after dexamethasone synchronization was analyzed by quantitative RT-PCR. Time 0 value was set to 1. Data were normalized to β-actin, and are represented as average and s.e.m. of three independent biological replicates. Blue and red arrows indicate the circadian times (CT) in which wild type (WT) and Bmal1−/− cells were harvested for 4C analysis. B, Circos plot representing the Dbp interactome. The layers indicate, from the outside to the inside: chromosome, number is indicated as a color code and length is proportional to the actual length of the interacting regions; averaged p scores for each genomic region shown as a color scale; histogram bars representing the gene content for each region; E-box elements location. The averaged p scores correspond to each 4C experiment, from the outside to the inside: WT CT22, WT CT26, WT CT30, WT CT34 and WT CT46, Bmal1−/− CT22 and Bmal1−/− CT34. C and D, microarray profiles showing the interaction frequencies (p score from the 4C data) between Dbp and mouse chromosomes 10 (C) and 17 (D). Orange and blue plots represent the data for wild type (WT) and Bmal1−/− MEFs respectively. The corresponding circadian time (CT) is indicated for each lane. The datasets are highly correlated, but major differences in the interaction frequencies become apparent (black arrows on plots in D). The genomic position in mm8 coordinates is indicated on the horizontal axis. The profiles for the rest of the chromosomes are provided in Supplementary Figure 3.
Figure 2
Figure 2. Genomic location of Dbp long-range contacts that follow a BMAL1-dependent circadian pattern of interaction
A, genomic map of the Dbp circadian interactome at the indicated circadian times (CT) after dexamethasone synchronization in wild type (WT) and Bmal1−/− MEFs. Averaged p scores for each region are indicated in green-red color scale according to the intensity of the interaction which is proportional to the probe signal (4C over genomic DNA). Colored triangles indicate the positions of the Dbp circadian contacts. Gray areas do not show circadian contact. The genomic position in mm8 coordinates is indicated on the top horizontal axis. Chromosomes that do not present circadian interaction with Dbp are not represented in this plot. B, Circos plot representing the genome-wide view of Dbp circadian interactions (black lines) with the corresponding chromosomes in trans. The gene content corresponding to each contact region is indicated in the outer layer of the plot. In red color are the names of those genes that present circadian mRNA accumulation after dexamethasone synchronization as defined by the gene expression analysis (JTK p<0.01).
Figure 3
Figure 3. FISH validation of 4C data
A, 4C microarray profiles for a selected region on chromosome 10, showing the running mean enrichments of 4C signal over genomic signal for 100-kilobases windows (p scores). Threshold (p score = 4) is indicated as a grey line. The corresponding circadian time (CT) after dexamethasone synchronization, is indicated on the top right for each plot. Orange plots represent data for wild type (WT) MEFs, and the data corresponding to Bmal1−/− MEFs is shown in the blue plots. The gene position and the genomic location in mm8 coordinates for all the plots are indicated at the bottom of the figure. The region covered by the BAC used as a probe for this experiment is also indicated. B, representative double label DNA FISH for Dbp locus on chromosome 7 (red) and the selected region on chromosome 10 (green). DNA was counterstained with DRAQ5 (blue). Representative picture shots correspond to wild type MEFs synchronized with dexamethasone, and fixed for FISH analysis at the indicated hours after synchronization (circadian time, CT). 280 to 350 nuclei were analyzed for each time point and genotype using three biological replicates. The scale bar in µm is indicated in the top right panel. C, bar chart showing the interchromosomal interaction frequencies between Dbp and the selected gene cluster on chromosome 10. Dexamethasone synchronized wild type (WT) and Bmal1−/− MEFs were fixed at the indicated CTs for further DNA FISH analysis. Data is represented as a percentage of colocalization based on overlapping events of the green (chromosome 10 locus) and red (Dbp locus on chromosome 7) FISH probes from a total of 280–350 cell nuclei at each condition from three biological replicates. ***P <0.001; n.s. non-significant (P>0.05), Two tailed Fisher exact test.
Figure 4
Figure 4. Circadian gene expression profiles in dexamethasone synchronized MEFs
A, heat map view of global hierarchical cluster analysis of genes expressed in wild type MEFs on a circadian basis. Each gene is represented as a horizontal line, ordered vertically by phase determined by Cluster 3.0. mRNA was extracted from wild type MEFs every four hours after dexamethasone synchronization, and microarray analyses were done per triplicate using GeneChip Mouse Gene 2.0 ST Array. Some of the genes that constitute the circadian machinery are indicated as examples. CT, circadian time. B and C, pie charts represent functional categories of circadian genes in wild-type MEFs (B) and of the genes that are present on the 4C genomic regions that interact with Dbp on a circadian basis (C). The number of genes sharing common biological processes is presented. The key shows the functional categories used to classify the genes. P values for each functional category are indicated in Supplementary Table 7
Figure 5
Figure 5. Circadian expression of Dbp and genes located in spatial proximity
A, Heat map showing the log2 expression values of the circadian genes that are found in the Dbp circadian interactome. Selected genes were plotted according to their phase. CT, circadian time. B, Quantitative Real time PCR of selected transcripts confirms the microarray data. Total RNA was collected before dexamethasone synchronization (CT0) and at 16, 22, 26, 30, 34, 40, 46 and 52 h after dexamethasone induction from wild type (WT) and Bmal1−/− MEFs. Data were normalized to β-actin, and are represented as average and s.e.m. of three independent biological replicates.
Figure 6
Figure 6. A schematic model of the cyclic events in chromosomal organization along the circadian cycle
Hypothetical model of cyclic long-range chromosomal interactions dictated by the circadian clock. During the circadian time (CT) which corresponds with high Dbp gene expression (CT22), a specific genomic environment is associated with gene transcription (represented as a shaded area in the nucleus of the cells). Genes participating in this process constitute the circadian interactome. As the circadian cycle progresses, the clock machinery is disassembled and circadian gene expression decreases. When Dbp circadian transcription is at its trough (CT34), the clock machinery is already uncoupled from E-boxes, and this event correlates with a different genomic environment around Dbp locus (see Discussion).

References

    1. Bass J. Circadian topology of metabolism. Nature. 2012;491:348–356. - PubMed
    1. Schibler U, Sassone-Corsi P. A web of circadian pacemakers. Cell. 2002;111:919–922. - PubMed
    1. Wijnen H, Young MW. Interplay of circadian clocks and metabolic rhythms. Annual review of genetics. 2006;40:409–448. - PubMed
    1. Mohawk JA, Green CB, Takahashi JS. Central and peripheral circadian clocks in mammals. Annual review of neuroscience. 2012;35:445–462. - PMC - PubMed
    1. Reppert SM, Weaver DR. Coordination of circadian timing in mammals. Nature. 2002;418:935–941. - PubMed

METHODS-ONLY REFERENCES

    1. Hirayama J, et al. CLOCK-mediated acetylation of BMAL1 controls circadian function. Nature. 2007;450:1086–1090. - PubMed
    1. Pando MP, Morse D, Cermakian N, Sassone-Corsi P. Phenotypic rescue of a peripheral clock genetic defect via SCN hierarchical dominance. Cell. 2002;110:107–117. - PubMed
    1. Grimaldi B, et al. PER2 controls lipid metabolism by direct regulation of PPARgamma. Cell metabolism. 2010;12:509–520. - PMC - PubMed
    1. Balsalobre A, et al. Resetting of circadian time in peripheral tissues by glucocorticoid signaling. Science. 2000;289:2344–2347. - PubMed
    1. Hughes ME, Hogenesch JB, Kornacker K. JTK_CYCLE: an efficient nonparametric algorithm for detecting rhythmic components in genome-scale data sets. Journal of biological rhythms. 2010;25:372–380. - PMC - PubMed

Publication types

Substances

Associated data