. 2014 Nov 20;515(7527):419-22.
doi: 10.1038/nature13919. Epub 2014 Oct 29.

Tissue-specific clocks in Arabidopsis show asymmetric coupling

Affiliations

Tissue-specific clocks in Arabidopsis show asymmetric coupling

Motomu Endo et al. Nature. .

Abstract

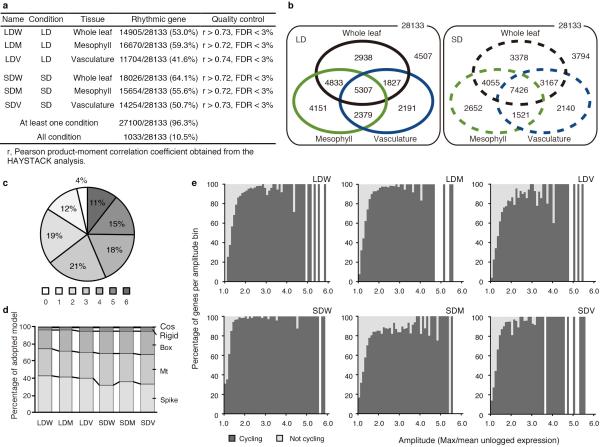
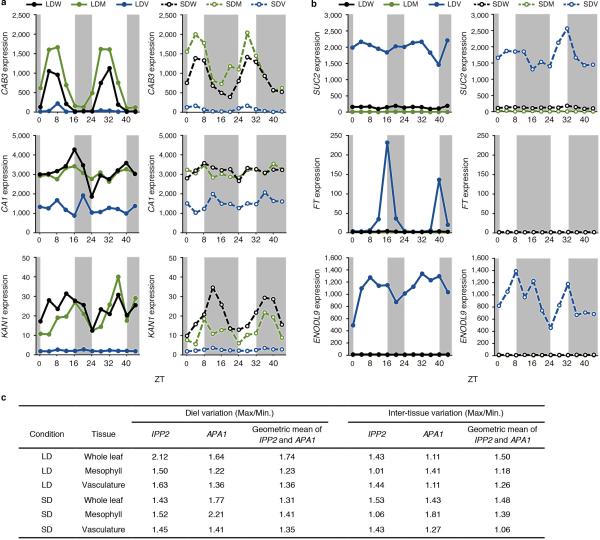
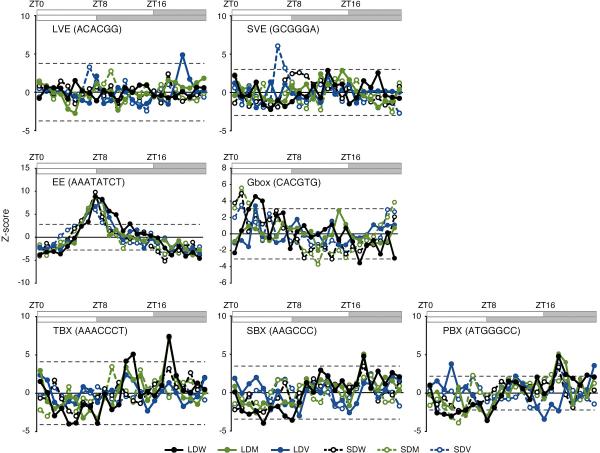
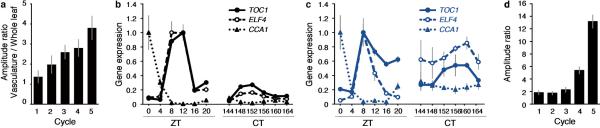
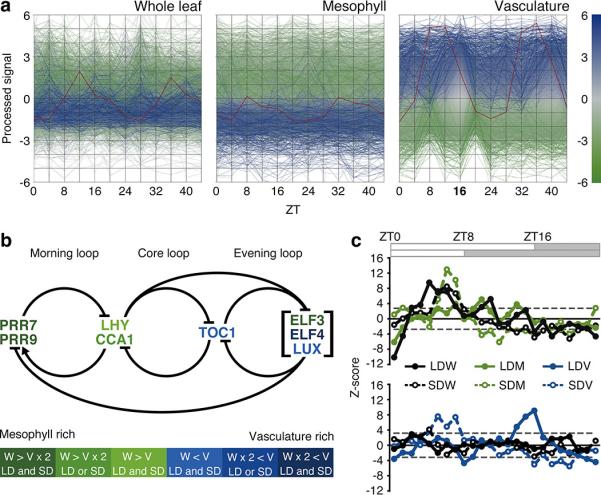
Many organisms rely on a circadian clock system to adapt to daily and seasonal environmental changes. The mammalian circadian clock consists of a central clock in the suprachiasmatic nucleus that has tightly coupled neurons and synchronizes other clocks in peripheral tissues. Plants also have a circadian clock, but plant circadian clock function has long been assumed to be uncoupled. Only a few studies have been able to show weak, local coupling among cells. Here, by implementing two novel techniques, we have performed a comprehensive tissue-specific analysis of leaf tissues, and show that the vasculature and mesophyll clocks asymmetrically regulate each other in Arabidopsis. The circadian clock in the vasculature has characteristics distinct from other tissues, cycles robustly without environmental cues, and affects circadian clock regulation in other tissues. Furthermore, we found that vasculature-enriched genes that are rhythmically expressed are preferentially expressed in the evening, whereas rhythmic mesophyll-enriched genes tend to be expressed in the morning. Our results set the stage for a deeper understanding of how the vasculature circadian clock in plants regulates key physiological responses such as flowering time.


Figures

Extended Data Figure 1
Extended Data Figure 1. Optimization and validation of gene expression analysis in isolated tissues
a, b, Relationship between enzyme concentration and opacity of the enzyme solutions (a) or processing time for vasculature and epidermis isolation (b). Higher concentrations of enzyme (>2%) lead to lower handling ability during tissue isolation because of its opacity (gray box). Mean±SD (n=6). c, The expression levels of the 10 reference genes in whole leaves, mesophyll, and vasculature were detected under long day (LD) and short day (SD) conditions, and then the average expression stabilities M were calculated according to Vandesompele's method. We chose ACTIN2 (ACT2), TUBULIN5 (TUB5), POLYUBIQUITIN10 (UBQ10), ELONGATION FACTOR1α (EF1α), ASCORBATE PEROXIDASE 3 (APX3), and ISOPENTENYL PYROPHOSPHATE:DIMETHYLALLYL PYROPHOSPHATE ISOMERASE 2 (IPP2) as commonly used reference genes, and we also chose ARABIDOPSIS TRITHORAX 3 (ATX3), REGULATORY PARTICLE TRIPLE-A 1A (RPT1a), THIOREDOXIN 3 (TRX3), and ASPARTIC PROTEINASE A1 (APA1) based on microarray analysis. d, The expression of tissue-specific marker genes was detected in vasculature from plants grown under LD for 10 days. Sultr2;1 was used as a marker of phloem companion cell. WUSCHEL RELATED HOMEOBOX 4 (WOX4) and HOMEOBOX GENE 8 (AtHB8) were used as markers of procambium/cambium. IRREGULAR XYLEM 3 (IRX3) was used as a marker of xylem. Gene expression levels were calculated relative to Lhcb2.1 expression. e, Total RNA was extracted from 10 cotyledons and 10 vasculatures grown under LD for 10 days. Extracted RNA was quantified and RNA content per single cotyledon and vasculature was estimated. n=23. f, Expression of TOC1 and CCA1 in whole leaves, mesophyll, vasculature, and epidermis. Plants were grown under LD for 10 days, and whole leaves, mesophyll, vasculature, and epidermis were collected and/or isolated every four hours. g, The expression level of the stress-induced genes (COLD-REGULATED 15A (COR15A), ALCOHOL DEHYDROGENASE 1 (ADH1), and RESPONSIVE TO DESSICATION 29A (RD29A)) in isolated mesophyll and vasculature with or without 50 μg/ml of α-Amanitin (an inhibitor of RNA polymerase II). d, f, g, The geometric mean of APA1 and IPP2 was used as a control. Mean±SEM (n=3).
Extended Data Figure 2
Extended Data Figure 2. Models used to identify cycling transcripts
Models used in the HAYSTACK analysis were named Spike, Rigid, Cos, Mt, AsyMt1, AsyMt2, hBox, Box1, Box1.5, and Box2. All models are shifted in 1 h increments, and diel peak at ZT0 (black) and ZT2 (gray) are shown as examples. Underlined models were used in a previous study.
Extended Data Figure 3
Extended Data Figure 3. Number of cycling genes, percentage of adopted models, and relationship between amplitude and genes called cycling in each condition
a, b, Number of genes that cycle under LD or SD in each tissue. c, Percentage of genes called cycling in a number of conditions. 4% of genes were not rhythmic in any condition. The remaining 96% of genes were broken down by the number of conditions for which they were called cycling. d, Frequency of model name adopted by the HAYSTACK analysis. Mt, AsyMt1, and AsyMt2 are integrated as Mt; and hBox, Box1, Box1.5, and Box2 are integrated as Box. e, Comparison of the percentage of genes called cycling versus genes not called cycling, by amplitude. Amplitude was estimated by dividing the maximum by the mean expression value across the time course.
Extended Data Figure 4
Extended Data Figure 4. Validation of the sensitivity and specificity of the microarray analysis
a, b, Expression profiles of mesophyll- (a) and vasculature-specific marker genes (b) under LD (left) and SD (right). CAB3, CARBONIC ANHYDRASE 1 (CA1), and KANADI 1 (KAN1) were applied as mesophyll markers. SUC2, FT, and EARLY NODULIN-LIKE PROTEIN 9 (ENODL9) were applied as vasculature markers. c, Diel and inter-tissue variations in the expression of the reference genes APA1 and IPP2.
Extended Data Figure 5
Extended Data Figure 5. Relative gene expression levels, percentage of phase shift genes and percent of overlapping genes
a, b, Relative gene expression levels in whole leaf, mesophyll, and vasculature under SD (a) and LD (b). The average expression level in vasculature at ZT16 (a) and ZT0 (b) was set to 0. Blue and green colored genes indicate higher and lower expression than average, respectively. c, Gene expression patterns of the PRR7, TOC1, and ELF4 in whole leaf, mesophyll, and vasculature under LD and SD. d, Percentage of genes showing a given phase shift when comparing two given tissues under LD and SD. Phase shifts plotted as positive are phase delay. e, Phase shift topology graph with phase shift of the target tissue on the y-axis and the reference tissue phase bin on the x-axis. Heatmap indicates percent of genes that are rhythmic between both conditions. f, Percentage of overlapping genes (POG) between any two tissues under LD and SD. The p-value resulting from the HAYSTACK analysis was used for gene ranking.
Extended Data Figure 6
Extended Data Figure 6. Z-score profiles of cis-regulatory elements in each tissue
Z-score profiles of the long day vasculature element (LVE), short day vasculature element (SVE), evening element (EE), Gbox, telo-box (TBX), starch box (SBX), and protein box (PBX) under LD and SD are shown. The horizontal dotted line indicates the threshold (FDR<1%).
Extended Data Figure 7
Extended Data Figure 7. Luciferase complementation assay of TOC1/CaMV 35S-, TOC1/SUC2-, CCA1/CaMV 35S-, CCA1/SUC2-, and CaMV 35S/SUC2-TSLA
a-c, Real time monitoring of the luminescence of 10-day-old TOC1/SUC2-TSLA #2 (n=9) and TOC1/CaMV 35S-TSLA #4 (n=12) (a), CCA1/SUC2-TSLA #11 (n=18) and CCA1/CaMV 35S-TSLA #1 (n=12) (b), and CaMV 35S/SUC2-TSLA #9 (n=12) (c) seedlings under L/D or free-running conditions. CT; circadian time. Signals after subtraction of background noise are shown. Mean±SD. cps; counts per second. cp30s; counts per 30 second. d, Period length of the TSLA lines shown in Fig. 3e, f and Extended Data Fig. 7a, b are calculated by the FFT-NLLS. Mean±95% confidence interval.
Extended Data Figure 8
Extended Data Figure 8. Clock genes expression in whole leaf and vasculature under L/D and continuous light free-running conditions
a, Ratio between the amplitude in the vasculature with respect to amplitude in whole leaf extracted from Fig. 5a (V(Peak-Trough)/W(Peak-Trough))/ Mean±SEM. b, c, TOC1, ELF4, and CCA1 expression under L/D and free-running conditions in whole leaves (b) and vasculature (c). Plants were entrained for 5 days and shifted into continuous light condition for 1 week. ZT; Zeitgeber time. CT; circadian time. Mean±SD (n=3). To validate the robustness of each gene, the highest expression level in each gene in each tissue is set to 1. d, Ratio between the amplitude of TOC1::LUC with respect the amplitude of TOC1::LUC; SUC2::CCA1 #18 extracted from Fig. 5b. Mean±SEM.
Extended Data Figure 9
Extended Data Figure 9. Organ- and tissue-specific expression of CCA1-GFP driven by tissue-specific promoters
Expression levels of CCA1-GFP in a specific organ (a) and tissue (b). Plants were grown for 10 days under L/D condition and seedlings were separated into each organ and tissue at ZT0. Based on contamination rate obtained from Fig. 1d, cross-contamination adjusted signals were shown (b). For the CCA1-GFP detection, GFP expression was measured by qPCR and the geometric mean of APA1 and IPP2 was used as a control. The highest values are set as 1. Mean±SEM (n=3).
Figure 1
Figure 1. Direct tissue isolation from cotyledons
a, Schematic drawings of the tissue-isolation strategy and isolated mesophyll (left), vasculature (middle), and epidermis (right) visualized by dark field microscopy. See Methods online for the detailed protocol. Bar=250 μm. b, Expression analysis of Lhcb2.1, Sultr2;1, and GC1 as mesophyll-, vasculature-, and epidermis markers, in the isolated tissues from 10-day-old seedlings grown under long day conditions. ZT; Zeitgeber time. The figure shows representative qPCR results from the three independent biological repeats. c, d, Purities of the isolated tissues (c) and contribution ratios of each of them to whole leaf mRNA (d) are estimated using the data in Fig. 1b. See Methods online for details. Mean±SEM (n=14).
Figure 2
Figure 2. Vasculature and mesophyll have different gene expression profiles
a, Relative gene expression levels in whole leaf, mesophyll and vasculature under LD. Blue and green colored genes indicate higher and lower expression than average in the vasculature at ZT16, respectively. As an example, the red line highlights ELF4 expression profile. b, Color code expression level representation of the clock genes in the circadian clock model. Mesophyll- and vasculature-rich genes are defined based on arithmetic mean expression levels and frequencies. See Methods online for the detailed definition. c, Z-score profiles of mesophyll-rich genes (upper panel) and vasculature-rich genes (lower panel) across the entire day. Dotted horizontal lines indicate threshold, (FDR<3%). See Methods online for details.
Figure 3
Figure 3. Tissue-specific luciferase assay (TSLA)
a, Schematic drawings of the TSLA strategy. b-d, Luminescence images of TOC::LUC (b), TOC1/SUC2-TSLA (c) and TOC1/CaMV 35S-TSLA (d) seedlings grown under L/D for 10 days. Right panels shows enlarged cotyledons surrounded by white boxes. Bar=1 cm (left) and 1 mm (right). e, f, Real time monitoring of the luminescence of 10-day-old TOC1/SUC2-TSLA #3 (n=6) and TOC1/CaMV 35S-TSLA #3 (n=12) seedlings (e), and CCA1/SUC2-TSLA #12 (n=14) and CCA1/CaMV 35S-TSLA #2 (n=12) seedlings (f) under L/D and free-running conditions. Mean±SD. cps; counts per second. Signals after subtraction of background noise are shown. Period lengths calculated by FFT-NLLS are shown in the Extended Data Fig. 7e.
Figure 4
Figure 4. The vasculature clock is robust and dominant to other clocks
a, TOC1 expression in whole leaf and vasculature under L/D and continuous light free-running conditions. Days 5 to 9 and day 12 are shown. Mean±SEM (days 5-9, n=3, and day 12, n=4). b, Luminescence of TOC1::LUC (n=22) and TOC1::LUC; SUC2::CCA1 #18 (n=24) seedlings grown under L/D and continuous light free-running conditions. Days 5 to 9 are shown. Mean±SD. c, TOC1 expression in whole leaf, mesophyll, and vasculature from 10-day-old wild type, CAB3::CCA1 and SUC2::CCA1 seedlings. Plants were grown under L/D for 5 days and then transferred into free-running conditions and analyzed. Mean±SEM (n=3). d, Flowering time and FT expression analysis under LD. Mean±SD (n=12). Promoters of 3-KETOACYL-COA SYNTHASE 6 (CER6), UNUSUAL FLORAL ORGAN (UFO), and TERPENE SYNTHASE-LIKE SEQUENCE-1,8-CINEOLE (TPS-CIN) were used as epidermis-, shoot apical meristem-, and hypocotyl/root promoters, respectively. FT expression was detected at ZT16 of LD grown 10-day-old seedlings. Mean±SD (n=3). a, c, d, The gene expression was checked by qPCR. e, Our model proposes that vasculature (phloem companion cells) clock and mesophyll clock asymmetrically affect each other in leaves. Through long and short-distance signaling, the vasculature clock regulates the mesophyll clock and photoperiodic flowering.

Comment in

References

    1. Barclay JL, Tsang AH, Oster H. Interaction of central and peripheral clocks in physiological regulation. Prog. Brain Res. 2012;199:163–181. - PubMed
    1. Mohawk JA, Green CB, Takahashi JS. Central and peripheral circadian clocks in mammals. Annu. Rev. Neurosci. 2012;35:445–462. - PMC - PubMed
    1. Thain SC, Hall A, Millar AJ. Functional independence of circadian clocks that regulate plant gene expression. Curr. Biol. 2000;10:951–956. - PubMed
    1. James AB, et al. The circadian clock in Arabidopsis roots is a simplified slave version of the clock in shoots. Science. 2008;322:1832–1835. - PubMed
    1. Para A, et al. PRR3 Is a vascular regulator of TOC1 stability in the Arabidopsis circadian clock. Plant Cell. 2007;19:3462–3473. - PMC - PubMed

Publication types

Associated data