. 2013 Sep 26;155(1):200-214.
doi: 10.1016/j.cell.2013.08.054.

NCoR repression of LXRs restricts macrophage biosynthesis of insulin-sensitizing omega 3 fatty acids

Affiliations

NCoR repression of LXRs restricts macrophage biosynthesis of insulin-sensitizing omega 3 fatty acids

Pingping Li et al. Cell. .

Abstract

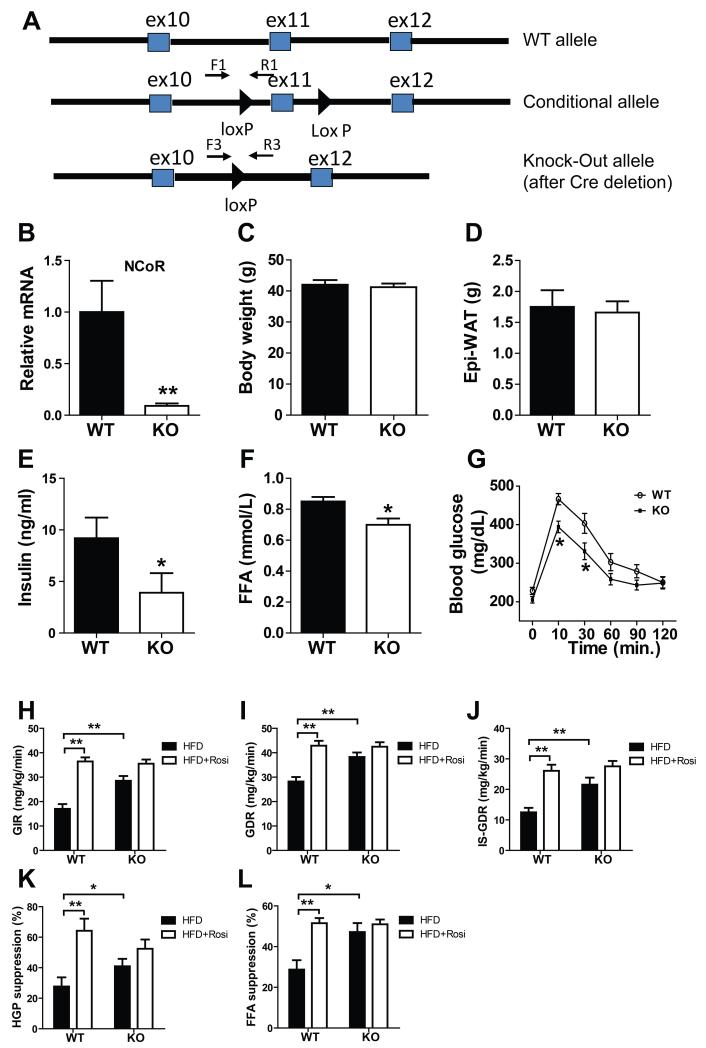
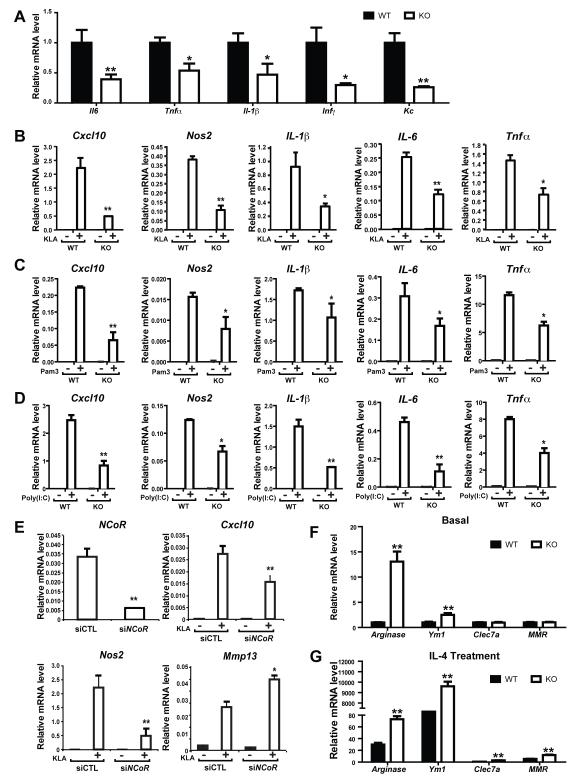
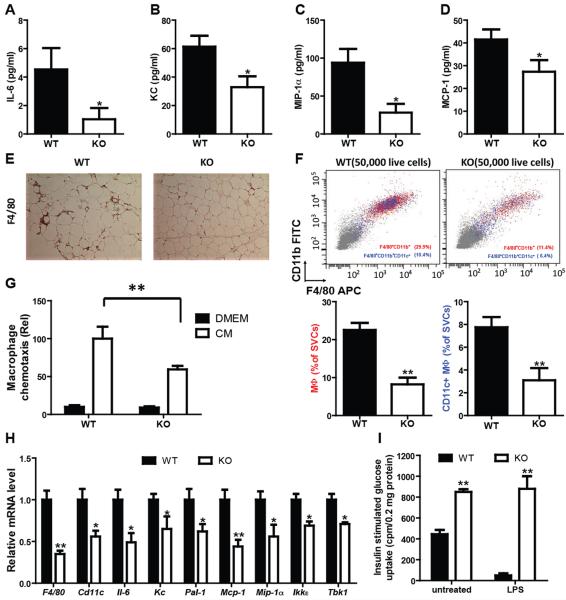
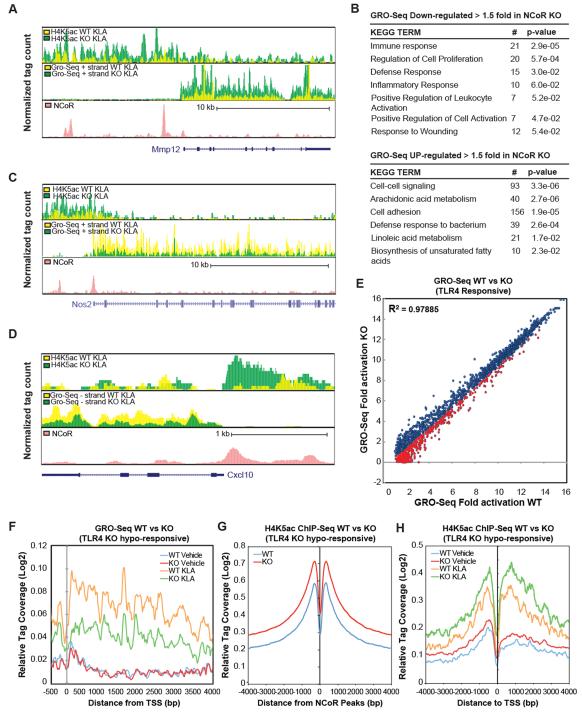
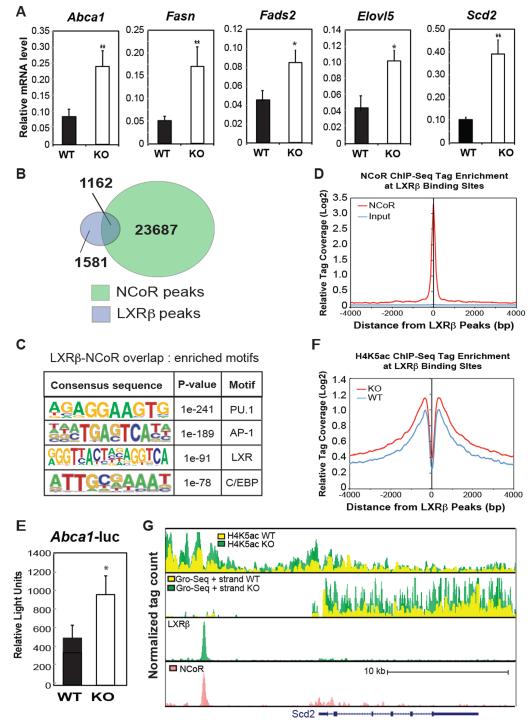
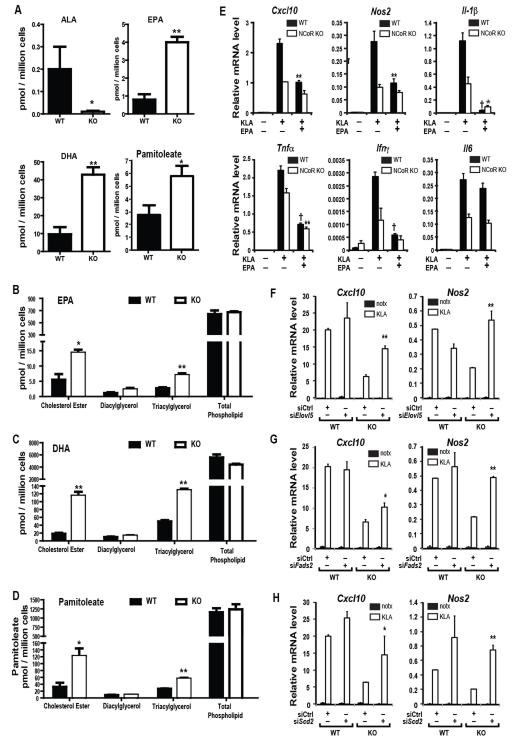
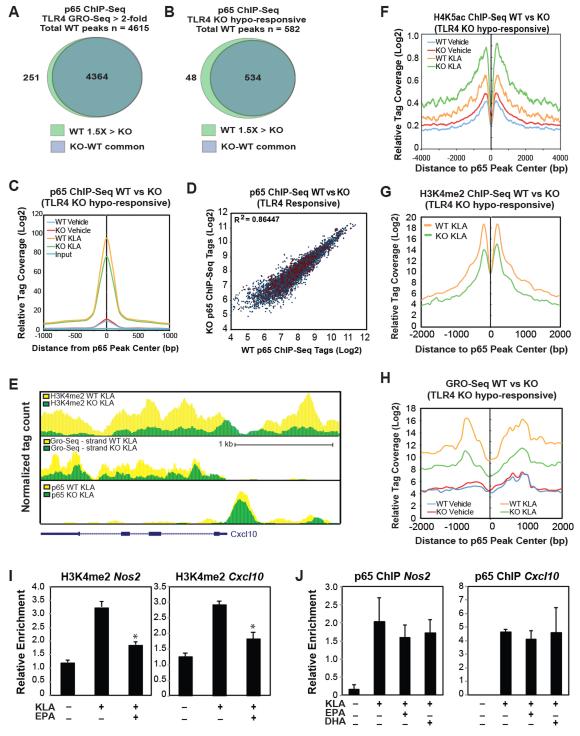
Macrophage-mediated inflammation is a major contributor to obesity-associated insulin resistance. The corepressor NCoR interacts with inflammatory pathway genes in macrophages, suggesting that its removal would result in increased activity of inflammatory responses. Surprisingly, we find that macrophage-specific deletion of NCoR instead results in an anti-inflammatory phenotype along with robust systemic insulin sensitization in obese mice. We present evidence that derepression of LXRs contributes to this paradoxical anti-inflammatory phenotype by causing increased expression of genes that direct biosynthesis of palmitoleic acid and ω3 fatty acids. Remarkably, the increased ω3 fatty acid levels primarily inhibit NF-κB-dependent inflammatory responses by uncoupling NF-κB binding and enhancer/promoter histone acetylation from subsequent steps required for proinflammatory gene activation. This provides a mechanism for the in vivo anti-inflammatory insulin-sensitive phenotype observed in mice with macrophage-specific deletion of NCoR. Therapeutic methods to harness this mechanism could lead to a new approach to insulin-sensitizing therapies.


Figures

Figure 1
Figure 1
Improved glucose metabolism and insulin sensitivity of MNKO mice. (A) Shown (top to bottom) are wild-type, floxed, and deleted NCoR gene loci. (B) Relative messenger RNA levels of NCoR in macrophages. Values are fold induction of gene expression normalized to the housekeeping gene 36B4 and expressed as mean ± s.e.m. (C) Body weight of WT and KO mice on 60% HFD. (D) Epi-WAT mass. (E) Fasting blood insulin levels. (F) Fasting FFA levels. (G) Glucose tolerance tests. (H) Glucose infusion rate (GIR) during hyperinsulinmic euglycemic clamp. (I) Glucose disposal rate (GDR). (J) Insulin-stimulated glucose disposal rate (IS-GDR). (K) Percent suppression of HGP by insulin (HGP suppression). (L) Percent suppression of free fatty acid levels (FFA suppression). Values are expressed as mean ± s.e.m. * P<0.05, ** P<0.01 for KO versus WT, or for comparisons as indicated.
Figure 2
Figure 2
Reduced inflammation in IP-macrophages of MNKO mice. (A) Relative mRNA levels of inflammatory cytokines in IP-macrophages without treatment, or (B) with TLR4 agonist treatment. (C) Relative mRNA levels of inflammatory cytokines in IP-macrophages after TLR2 agonist treatment, or (D) TLR3 agonist treatment. (E) Relative mRNA levels of NCoR and indicated inflammatory cytokines in control (siCTL) versus siNCoR treated IP-macrophages after TLR4 agonist treatment. (F) Relative mRNA levels of M2-like cytokines in IP-macrophages without IL-4 treatment, or (G) with IL-4 treatment. Values are relative to GAPDH and are expressed as mean ± s.e.m. * P<0.05, ** P<0.01 for KO versus WT, or siCTL versus si NCoR in 2E.
Figure 3
Figure 3
Hypoinflammatory phenotype of MNKO mice. Inflammatory cytokine expression in serum, including IL-6 (A), KC (B), MIP-1α (C), and MCP-1 (D). (E) F4/80 staining in Epi-WAT of WT and MNKO mice. (F) FACS analysis of macrophages and CD11c positive macrophage content in Epi-WAT. (G) Chemotaxis assay on the IP-macrophages from WT and MNKO mice. (H) Proinflammatory cytokine expression in Epi-WAT from WT and MNKO. (I) Effect of conditioned medium from IP-macrophages treated with LPS on glucose uptake in L6 cells. Values are expressed as mean ± s.e.m. * P<0.05, ** P<0.01. See also Fig. S1.
Figure 4
Figure 4
Genome-wide impact of NCoR deletion. (A) UCSC genome browser image illustrating normalized tag counts for H4K5Ac ChIP-Seq, GRO-Seq, and NCoR ChIP-Seq (Barish et al., 2012)in WT and MNKO macrophages at the Mmp12 locus. (B) Functional KEGG annotations associated with genes demonstrating increased or reduced expression in MNKO macrophages by more than 1.5-fold. (C-D) UCSC genome browser images corresponding to panel A for the Nos2 and Cxcl10 genomic loci. (E) Scatter plot of fold change of genes induced > 2-fold by 1h KLA treatment in WT macrophages vs fold change of the same genes in MNKO macrophages. Fold activation is plotted as normalized GRO-Seq tag counts for genes comparing log2 values of KLA versus vehicle treated. MNKO hypo-responsive genes are highlighted in red. The Pearson’s correlation coefficient is reported in the figure (p<0.0001). (F) Normalized distribution of GRO-Seq tag counts in the vicinity of the transcriptional start sites of TLR4-responsive genes exhibiting compromised activation in MNKO macrophages. (G) Normalized distribution of H4K5Ac ChIP-Seq tag counts in the vicinity of NCoR binding sites under basal conditions. (H) Normalized distribution of H4K5Ac ChIP-Seq tag counts in the vicinity of transcriptional start sites (TSS) under basal conditions. For Figures 4G-H, H4K5Ac tag counts are presented as averages at indicated positions of KLA-activated genes demonstrating hypo-responsiveness in MNKO macrophages. TLR4 MNKO hypo-responsive loci are chosen according to those genes demonstrating 1.5-fold decrease in KLA response of MNKO relative to WT, as measured by comparison of normalized GRO-Seq tag counts of MNKO versus WT macrophages. See also Fig. S2.
Figure 5
Figure 5
Impact of NCoR KO on LXR target gene expression in macrophages. (A) Q-PCR analysis of the indicated LXR target genes in WT and MNKO macrophages. (B) Venn diagram of overlap between LXRβ and NCoR peaks in macrophages. (C) Sequence motifs associated with LXRβ and NCoR cobound sites. (D) Distribution of NCoR ChIP-Seq tag density in the vicinity of LXRβ binding sites. (E) LXR-dependent Abca1-luciferase reporter assays in WT and MNKO macrophages. (F) Distribution of H4K5ac ChIP-Seq tag density in the vicinity of LXRβ binding sites. (G) UCSC genome browser image illustrating normalized tag counts for H4K5Ac ChIP-Seq, GRO-Seq, LXRβ ChIP-Seq and NCoR ChIP-Seq (Barish et al., 2012) at the Scd2 locus. Values are expressed as mean ± s.e.m. * P<0.05, ** P<0.01 for KO versus WT.
Figure 6
Figure 6
Increased ω3 fatty acid in IP-macrophages from MNKO mice. (A) ALA, EPA, DHA and Pamitoleic acid content in vehicle or KLA-treated IP-macrophages from WT and MNKO mice. (B) EPA level, DHA level (C), and pamitoleate level (D) in different lipid fractions in IP-macrophages from WT and MNKO mice. (E) Effects of ω3 fatty acid treatment on inflammatory gene expression in KLA-treated WT and MNKO IP-macrophages. (F) KLA-induced inflammatory gene expression in IP-macrophages after siRNA knockdown of Elovl5, Fads2 (G), or Scd2 (H). Values are expressed as mean ± s.e.m. * P<0.05, ** P<0.01, P<0.001 for KO versus WT, or EPA-KLA versus KLA in 6E, or KLA treated target specific siRNA (Scd2, Elovl5, or Fads2) versus siCTL in 6F-H. See also Fig. S3.
Figure 7
Figure 7
Increased ω3 FA production leads to decreased NF-κB activity in IP-macrophages of MNKO mice. (A) Venn diagram of overlap between p65 peaks within 50kb of TLR4 responsive genes (WT fold change >2, RPKM> 0.5, FDR<0.01) in KLA-treated WT and MNKO macrophages. (B) Venn diagram of overlap between p65 peaks within 50kb of MNKO hypo-responsive genes in KLA-treated WT and MNKO macrophages. (C) Normalized distribution of for p65 ChIP-Seq tag counts at enhancer-like regions associated with MNKO hypo-responsive genes (defined in 7B) in vehicle or KLA-treated WT and MNKO macrophages. (D) Scatter plot of normalized tag counts for p65 at enhancer-like regions associated with TLR4 responsive genes (defined in 7A) in KLA-treated MNKO and WT macrophages. The p65 peaks corresponding to hypo-responsive genes in MNKO macrophages (defined in 7B) are highlighted in red. The Pearson’s correlation coefficient is reported in the figure (p<0.0001). (E) UCSC genome browser image illustrating normalized tag counts for H3K4me2 ChIP-Seq, GRO-Seq, p65 ChIP-Seq, and NCoR ChIP-Seq (from Barish, et al, 2012) in WT and MNKO macrophages for the Cxcl10 genomic locus as indicated. (F) Normalized distribution of H4K5Ac ChIP-Seq tag density in the vicinity of p65 binding sites at enhancers associated with MNKO hypo-responsive genes (defined in 7B) in vehicle or KLA-treated WT and MNKO macrophages. (G) Normalized distribution of H3K4me2 ChIP-Seq tag density in the vicinity of p65 binding sites at enhancers associated with MNKO hypo-responsive genes (defined in 7B) in KLA-treated cells. (H) Normalized distribution of GRO-Seq tag counts in the vicinity of p65 peaks associated with MNKO hypo-responsive genes (defined in 7B) in vehicle or KLA-treated cells. (I) ChIP for H3K4me2 at Nos2 and Cxcl10 loci in WT macrophages treated with KLA in the presence or absence of EPA. (J) ChIP for p65 at Nos2 and Cxcl10 loci in WT macrophages treated with KLA in the presence or absence of EPA. Values are expressed as mean ± s.e.m. * P<0.05, ** P<0.01 for KLA versus EPA-KLA. See also Fig. S4.

References

    1. Barish GD, Yu RT, Karunasiri MS, Becerra D, Kim J, Tseng TW, Tai LJ, Leblanc M, Diehl C, Cerchietti L, et al. The Bcl6-SMRT/NCoR cistrome represses inflammation to attenuate atherosclerosis. Cell Metab. 2012;15:554–562. - PMC - PubMed
    1. Bouhlel MA, Derudas B, Rigamonti E, Dievart R, Brozek J, Haulon S, Zawadzki C, Jude B, Torpier G, Marx N, et al. PPARgamma activation primes human monocytes into alternative M2 macrophages with anti-inflammatory properties. Cell Metab. 2007;6:137–143. - PubMed
    1. Brown HA, Henage LG, Preininger AM, Xiang Y, Exton JH. Biochemical analysis of phospholipase D. Methods in enzymology. 2007;434:49–87. - PubMed
    1. Cao H, Gerhold K, Mayers JR, Wiest MM, Watkins SM, Hotamisligil GS. Identification of a lipokine, a lipid hormone linking adipose tissue to systemic metabolism. Cell. 2008;134:933–944. - PMC - PubMed
    1. Chen JD, Evans RM. A transcriptional co-repressor that interacts with nuclear hormone receptors. Nature. 1995;377:454–457. - PubMed

Publication types

Associated data