. 2013 Dec 19;504(7480):451-5.
doi: 10.1038/nature12726. Epub 2013 Nov 13.

Metabolites produced by commensal bacteria promote peripheral regulatory T-cell generation

Affiliations

Metabolites produced by commensal bacteria promote peripheral regulatory T-cell generation

Nicholas Arpaia et al. Nature. .

Abstract

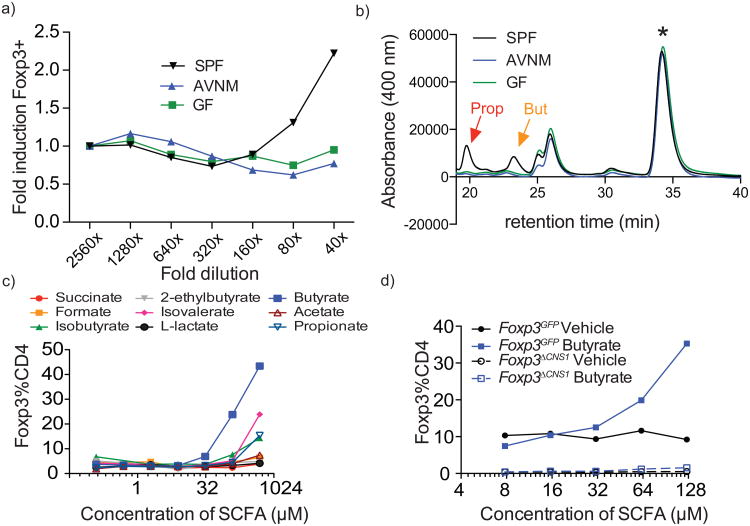
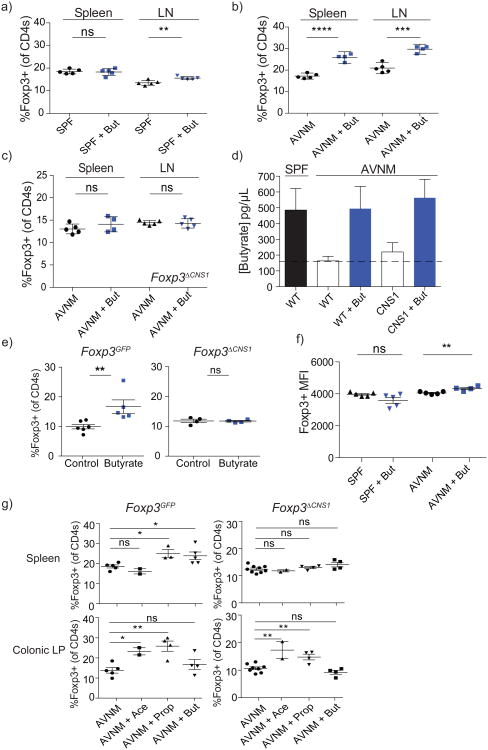
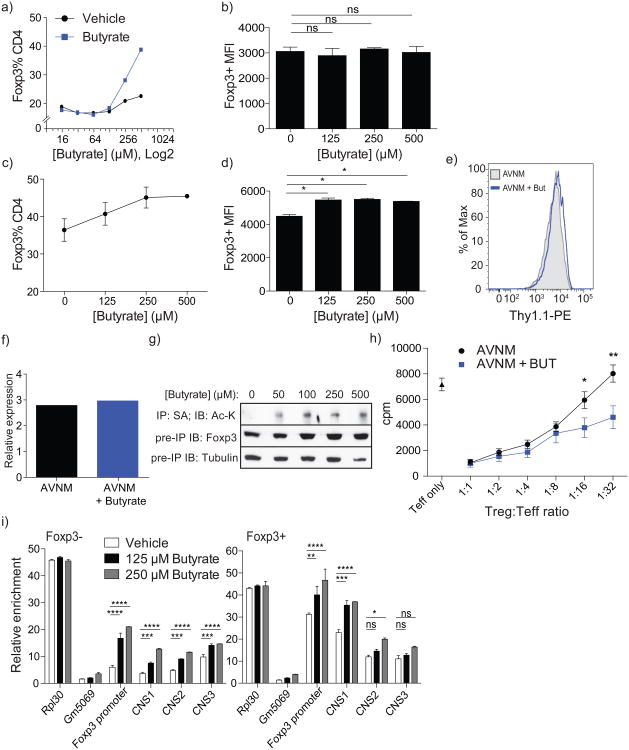
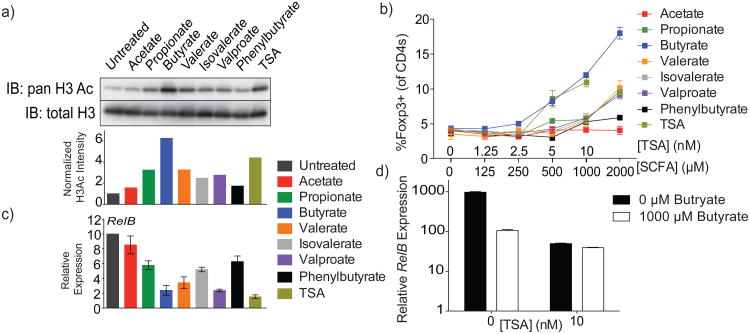
Intestinal microbes provide multicellular hosts with nutrients and confer resistance to infection. The delicate balance between pro- and anti-inflammatory mechanisms, essential for gut immune homeostasis, is affected by the composition of the commensal microbial community. Regulatory T cells (Treg cells) expressing transcription factor Foxp3 have a key role in limiting inflammatory responses in the intestine. Although specific members of the commensal microbial community have been found to potentiate the generation of anti-inflammatory Treg or pro-inflammatory T helper 17 (TH17) cells, the molecular cues driving this process remain elusive. Considering the vital metabolic function afforded by commensal microorganisms, we reasoned that their metabolic by-products are sensed by cells of the immune system and affect the balance between pro- and anti-inflammatory cells. We tested this hypothesis by exploring the effect of microbial metabolites on the generation of anti-inflammatory Treg cells. We found that in mice a short-chain fatty acid (SCFA), butyrate, produced by commensal microorganisms during starch fermentation, facilitated extrathymic generation of Treg cells. A boost in Treg-cell numbers after provision of butyrate was due to potentiation of extrathymic differentiation of Treg cells, as the observed phenomenon was dependent on intronic enhancer CNS1 (conserved non-coding sequence 1), essential for extrathymic but dispensable for thymic Treg-cell differentiation. In addition to butyrate, de novo Treg-cell generation in the periphery was potentiated by propionate, another SCFA of microbial origin capable of histone deacetylase (HDAC) inhibition, but not acetate, which lacks this HDAC-inhibitory activity. Our results suggest that bacterial metabolites mediate communication between the commensal microbiota and the immune system, affecting the balance between pro- and anti-inflammatory mechanisms.


Figures

Figure 1
Figure 1. SCFA produced by commensal bacteria stimulate in vitro generation of Treg cells
a) Effect of fecal extracts from SPF, antibiotic-treated (AVNM), or germ-free (GF) mice on in vitro induction of Foxp3 expression in naïve CD4+ T cells stimulated with CD3 antibody in the presence of Flt3L-elicited DC and TGF-β. Foxp3 expression was assessed by flow cytometric analysis on day 4 of culture. Naïve CD25+CD62LhiCD44loCD4+ T cells were FACS-purified from B6 mice. Fecal extracts were prepared in 70% ethanol. Data are shown as fold induction over corresponding dilution of vehicle and are representative of 2 independent experiments. b) HPLC fractionation of 2-nitrophenylhydrazine-HCl derivatized SCFA present in indicated fecal extracts. Red and yellow arrows indicate peaks corresponding to propionate and butyrate, respectively. Internal standard peak is indicated with a star. The HPLC fractionation profile of fecal extracts pooled from three animals each is representative of two independent experiments. c) Effect of indicated purified SCFA on in vitro induction of Foxp3 expression in naïve CD4+ T cells isolated from B6 or Foxp3GFP mice as described in (a). Data are representative of 3 independent experiments. d) Effect of butyrate on Foxp3 induction in CNS1-sufficient and -deficient naïve CD4+ T cells from Foxp3GFP and Foxp3ΔCNS1 as described in (a). Data are representative of at least two independent experiments.
Figure 2
Figure 2. Butyrate provision promotes extrathymic Treg cell generation in vivo
a, b) Flow cytometric analysis of Foxp3+ Treg cell subsets in the spleen and lymph nodes (LN) of AVNM-treated (AVNM) or untreated (SPF) B6 or Foxp3GFP mice treated with (+But; blue symbols) or without (black symbols) butyrate in drinking water. Data are representative of 3 independent experiments. c) CNS1-deficient mice were treated with AVNM with or without butyrate as in (a) and analyzed for Foxp3 expression in splenic and lymph node (LN) CD4+ T cell populations. Data are representative of 2 independent experiments. d) LC-MS analysis of butyrate in serum from CNS1-sufficient B6 (WT) and -deficient mice (CNS1) treated as in (a). Serum was derivatized with 2-nitrophenylhydrazine-HCl. Butyrate levels in serum of untreated (SPF) B6 mice are shown in black. Antibiotic-treated (AVNM) WT and CNS1-deficient animals supplemented with (+But; solid bars) or without (empty bars) butyrate are shown. At least 4 mice per group; error bars denote SEM. e) Flow cytometric analysis of Foxp3+ Treg cell populations in colonic lamina propria of Foxp3GFP (left) and CNS1-deficient mice(right). Mice were administered butyrate (blue symbols) or pH-matched water (control; black symbols) by enema for 7 days and analyzed for Foxp3 expression in colonic CD4+ T cell populations. The data represent the combination of 2 independent experiments; error bars denote SEM. f) Flow cytometric analysis of Foxp3 protein expression on a per cell basis in splenic Foxp3+ Treg cells in B6 mice treated with butyrate (+But) alone (SPF) or in combination with antibiotics (AVNM) as indicated. The data are shown as mean fluorescence intensity (MFI) +/- SD. Data are representative of at least 3 independent experiments. g) AVNM-treated Foxp3GFP (left) and CNS1-deficient mice (right) were administered acetate (Ace), propionate (Prop), butyrate (But), or no SCFA (AVNM) for a period of 3 weeks followed by analysis of Foxp3+ Treg cell subsets within CD4+ cells isolated from the colonic lamina propria (top panels) or spleens (bottom panels). Data represent the combination of 2 independent experiments; error bars denote SEM. * P ≤ 0.05, ** P ≤ 0.01, *** P ≤ 0.001, **** P ≤ 0.0001 as determined by Student's t-test.
Figure 3
Figure 3. Butyrate acts within T cells to enhance acetylation of the Foxp3 locus and Foxp3 protein
a) Induction of Foxp3 expression upon stimulation of naïve CD4+ T cells by CD3 antibody in the presence of butyrate-treated or untreated Flt3L-elicited DC and TGF-β. DC were cultured with titrated amounts of butyrate or medium alone for 6 h, washed and co-cultured with FACS-purified naïve CD4+ T cells in the presence of CD3 antibody and TGF-β. The data are shown as percent CD4+ cells expressing Foxp3 after 4 days of culture. Data are representative of at least 4 independent experiments. b) Analysis of Foxp3 protein expression on a per-cell basis in Treg cells generated in the presence of butyrate pre-treated Flt3L-elicited DC [as in (a)]. The data are shown as mean fluorescence intensity (MFI); error bars denote SEM. c) Percent of CD4+ cells expressing Foxp3 after 4 days in FACS-sorted naïve CD4+ T cells incubated with CD3/CD28 antibody-coated beads under Treg-inducing conditions. Data are representative of at least 2 independent experiments; error bars denote SEM. d) MFI of Foxp3 expression in Foxp3+ CD4+ cells from (c). Data are representative of at least 2 independent experiments; error bars denote SEM. e) Thy1.1 expression in CD4+Foxp3+ splenocytes isolated from bi-cistronic Foxp3Thy1.1 reporter mice treated with AVNM with (+But) or without butyrate as described in Figure 2a legend. Cell surface expression of IRES-driven Thy1.1 reporter inserted into the endogenous Foxp3 locus reflects Foxp3 mRNA levels. The data are representative of at least 3 mice in each group and 2 independent experiments. f) CD4+Foxp3+ splenocytes from FoxpGFP reporter mice treated with AVNM with or without butyrate (as in Figure 2a) were FACS-sorted and analyzed for Foxp3 mRNA expression by qPCR. g) AVI-tagged Foxp3-expressing TCli hybridoma cells were treated for 15 h with butyrate at the indicated concentrations followed by immunoprecipitation of tagged Foxp3 protein using streptavidin beads and immunoblotting for acetylated-lysine residues (top panel), total Foxp3 protein (middle panel) and tubulin (bottom panel) from pre-precipitation whole cell lysate. Data are representative of 2 independent experiments. h) Analysis of suppressor capacity of GFP+ Treg cells sorted from antibiotic-treated (AVNM) Foxp3GFP mice administered (+But) or not administered butyrate in drinking water. Data represent two independent experiments combined with at least 4 mice per group each. i) FACS-sorted naïve CD4+ T cells isolated from Foxp3GFP animals were incubated with CD3/CD28 antibody-coated beads under Treg-inducing conditions in the presence of indicated amounts of butyrate. Foxp3+ and Foxp3- CD4+ cells were FACS-purified at day 3 of culture and H3K27 acetylation at the Foxp3 promoter and CNS1-3 enhancers was assessed using ChIP-qPCR. Enrichment over input for each indicated Foxp3 regulatory region at given concentrations of butyrate is shown. Data in this figure are representative of at least 2 independent experiments. The data represent mean +/- SEM. * P ≤ 0.05, ** P ≤ 0.01, *** P ≤ 0.001, **** P ≤ 0.0001, as determined by Student's t-test.
Figure 4
Figure 4. HDAC-inhibitory activity of butyrate decreases pro-inflammatory cytokine expression within DC to promote Treg induction
a) Histone acetylation in Flt3L-elicited DC from B6 mice treated with the indicated SCFA (500 μM) or TSA (10 nM) for 6 h followed by acid extraction of histones from isolated nuclei, SDS-PAGE and blotting with antibody for pan-acetylated H3. Total histone H3 served as a loading control. Shown below is the relative acetylated H3 band intensity calculated over total H3 and normalized as fold over untreated. b) Induction of Foxp3 expression upon stimulation of naïve CD4+ T cells by CD3 antibody in the presence of SCFA or TSA, Flt3L-elicited DC and TGF-β. DC were cultured with titrated amounts SCFA or TSA for 6 h, washed and co-cultured with FACS-purified naïve CD4+ T cells in the presence of CD3 antibody and TGF-β. The data are shown as percent CD4+ cells expressing Foxp3 after 4 days of culture. Data are representative of at least 2 independent experiments. c) RelB gene expression quantified by qPCR in purified Flt3L-elicited DC from B6 mice treated for 6 h with SCFA or TSA, as in (a). Data are representative of 4 independent experiments. d) RelB gene expression quantified by qPCR in purified Flt3L-elicited DC from B6 mice treated with or without TSA in combination with, or in the absence of, butyrate at the indicated concentrations. Data in this figure are representative of at least 2 independent experiments, unless otherwise noted. The data represent mean +/- SEM.

Comment in

References

    1. Josefowicz SZ, et al. Extrathymically generated regulatory T cells control mucosal T(H)2 inflammation. Nature. 2012;482:395–U1510. - PMC - PubMed
    1. Round JL, Mazmanian SK. Inducible Foxp (3+) regulatory T-cell development by a commensal bacterium of the intestinal microbiota. Proceedings of the National Academy of Sciences of the United States of America. 2010;107:12204–12209. - PMC - PubMed
    1. Ivanov II, et al. Induction of intestinal Th17 cells by segmented filamentous bacteria. Cell. 2009;13998:485. - PMC - PubMed
    1. Lathrop SK, et al. Peripheral education of the immune system by colonic commensal microbiota. Nature. 2011;478:250–4. - PMC - PubMed
    1. Atarashi K, et al. Induction of Colonic Regulatory T Cells by Indigenous Clostridium Species. Science. 2011;331:337–341. - PMC - PubMed

Publication types

MeSH terms

Associated data